Tracing the atomic nitrogen abundance in star-forming regions with ammonia deuteration
Abstract
Partitioning of elemental nitrogen in star-forming regions is not well constrained. Most nitrogen is expected to be partitioned among atomic nitrogen (N i), molecular nitrogen (\ceN2), and icy N-bearing molecules, such as \ceNH3 and \ceN2. N i is not directly observable in the cold gas. In this paper, we propose an indirect way to constrain the amount of N i in the cold gas of star-forming clouds, via deuteration in ammonia ice, the []/[] ratio. Using gas-ice astrochemical simulations, we show that if atomic nitrogen remains as the primary reservoir of nitrogen during cold ice formation stages, the []/[] ratio is close to the statistical value of 1/3 and lower than unity, whereas if atomic nitrogen is largely converted into N-bearing molecules, the ratio should be larger than unity. Observability of ammonia isotopologues in the inner hot regions around low-mass protostars, where ammonia ice has sublimated, is also discussed. We conclude that the []/[] ratio can be quantified using a combination of VLA and ALMA observations with reasonable integration times, at least toward IRAS 16293-2422 where high molecular column densities are expected.
keywords:
astrochemistry — ISM: molecules — ISM: clouds — stars: formation1 Introduction
One of the most fundamental questions in the field of astrochemistry is how heavy elements are partitioned among chemical species at each evolutionary stage during star- and planet-formation. Nitrogen is the fifth most abundant element with the abundance of [N/H] in the local interstellar medium (ISM) (Przybilla et al., 2008). The partitioning of elemental nitrogen in dense star-forming regions is not well constrained. Determining it is important for several reasons. It is a key for the understanding of differential behavior of N-bearing species from O- and C-bearing species in the gas phase in prestellar cores and nitrogen isotope fractionation chemistry (e.g., Bergin & Tafalla, 2007; Rodgers & Charnley, 2008). The elemental nitrogen partitioning would also affect the formation efficiency of N-bearing complex organic molecules, as, for example, \ceN2 is more stable than \ceNH3 (e.g., Daranlot et al., 2012). Furthermore, the nitrogen partitioning in star forming clouds may affect that in protoplanetary discs (Schwarz & Bergin, 2014), which would shape the composition of planets.
There is no clear evidence of nitrogen depletion into dust grains unlike other elements (Jenkins, 2009). Then most nitrogen should be present in the gas phase in diffuse clouds. The dominant form of nitrogen in diffuse clouds is the atomic form (N i) rather than either the ionic form or molecular nitrogen (N2) (Viala, 1986; Knauth et al., 2004). In dense molecular clouds and cores, nitrogen chemistry consists of three competing processes; (i) the conversion of N i into N2 in the gas phase, (ii) destruction of N2 via e.g., photodissociation and reaction with He+, and (iii) freeze out of N i and N2 onto dust grains followed by surface reactions (e.g., Herbst & Klemperer, 1973; Hidaka et al., 2011; Daranlot et al., 2012; Li et al., 2013). From these, most nitrogen is expected to be partitioned among N i, N2, and icy N-bearing molecules, such as ammonia (NH3) and N2 ices. The Spitzer ice survey showed that the ice in star-forming regions contains, on average, 10 % of overall nitrogen as NH3, NH, and OCN- (Öberg et al., 2011), adopting the water ice abundance of with respect to hydrogen nuclei (Boogert & Ehrenfreund, 2004; Gibb et al., 2004; Pontoppidan et al., 2004). The remaining nitrogen would be present in the gas phase mainly as N i or N2. Alternatively, there is still the possibility that a large fraction of nitrogen is locked up in N2 ice. Indirect measurements of the upper limits on the amount of N2 ice in molecular clouds are rather uncertain, 40 % of overall nitrogen (Elsila et al., 1997; Boogert et al., 2002, 2015).
Gas-phase nitrogen chemistry that converts N i into N2 is different from oxygen and carbon chemistry, in which formation of molecules from atoms are initiated by reactions with \ceH3+. It has been thought that N2 forms via neutral-neutral reactions as follows (e.g., Herbst & Klemperer, 1973; Hily-Blant et al., 2010; Daranlot et al., 2012):
| (1) | ||||
| (2) |
and
| (3) | ||||
| (4) |
According to gas-phase astrochemical models for dense clouds and cores, where the interstellar UV radiation field is significantly attenuated, either \ceN2 or N i can be the biggest nitrogen reservoir in steady-state, depending on the C/O elemental ratio and the elemental abundance of sulfur that are available for gas phase chemistry (Hily-Blant et al., 2010; Le Gal et al., 2014). Both the C/O ratio and the sulfur abundance would be time-dependent due to ice formation in reality. Recent gas-ice astrochemical simulations (Furuya et al., 2015, 2016), which trace the physical and chemical evolution from translucent clouds to denser cores, have predicted that N2 is the primary form of nitrogen in the gas phase in cold dense cores, while most of elemental nitrogen exists as ice in the forms of \ceNH3 and \ceN2 (see also Maret et al., 2006; Daranlot et al., 2012).
Neither N i nor N2 in the gas phase is directly observable in dense cores due to the cold temperatures. Several observational studies have attempted to constrain the abundance of N2 in the gas phase via a proxy molecule, N2H+ which is primary formed by N2 + H. Maret et al. (2006) inferred the gaseous N2 abundance in dense cloud B68 from the observations of N2H+ supplemented by CO and HCO+ observations, which were used to constrain the abundances of main destroyers for \ceN2H+, i.e., CO and electrons. They concluded that the gaseous N2 abundance is low (a few %) compared to overall nitrogen abundance of , based on chemical and radiative transfer models (see also Pagani et al., 2012). The result is consistent with earlier investigation of the N2 abundance in the gas of several cold dense clouds estimated from N2H+ observations with simpler analysis. McGonagle et al. (1990) estimated the gaseous \ceN2/\ceCO ratio of 8 % in dark cloud L134N, assuming that the ratio is close to the \ceN2H+/\ceHCO+ ratio, i.e., destruction of \ceN2H+ by CO is neglected. If the canonical CO abundance of 10-4 is adopted, the gaseous \ceN2 abundance is evaluated to be with respect to hydrogen nuclei, corresponding to 30 % of overall nitrogen. Womack et al. (1992) estimated the gaseous \ceN2 abundance of four cold clouds to be 3 with respect to hydrogen nuclei, corresponding to 10 % of overall nitrogen.
Hily-Blant et al. (2010) suggested that the N i abundance in the gas phase can be constrained from the CN/HCN abundance ratio. The basic idea (or assumption) behind this is that both the production rate and destruction rate of CN depend on the N i abundance (see Reactions (1) and (2)), while for HCN, only the production rate depends on the N i abundance. Based on the observationally derived CN/HCN ratio in several prestellar cores, it was suggested that the N i abundance is low, up to a few % of overall nitrogen. The method, however, suffers from uncertainties of formation and destruction pathways of relevant species and their rate coefficients (Hily-Blant et al., 2010). Indeed, their astrochemical models failed to explain the observationally derived abundances of N-bearing molecules in the prestellar cores.
Thus previous studies of the nitrogen budget exploration are inconclusive, while it seems unlikely that most elemental nitrogen exists as gaseous \ceN2. In this paper, we propose a new way to indirectly trace the evolution of the N i abundance in the cold gas of star-forming regions via deuteration of ammonia ice. The paper is organized as follows. A proposed method is presented through a simple analytical model in Section 2, while in Section 3, the method is verified by gas-ice astrochemical simulations. Deuteration measurements of the ISM ice relies heavily on the gas observations toward inner warm (100 K) regions in the deeply embedded protostars, where ices have sublimated. The observability of deuterated ammonia in the warm gas is discussed in Section 6. Our findings are summarized in Section 7.
2 Multiple deuteration of ammonia ice
Infrared ice observations have shown that ice formation (at least water ice formation) already starts before the dense core stage, where the cores gravitationally collapse to form protostars (e.g., Whittet, 1993; Murakawa et al., 2000). Ice formation in star-forming regions can be roughly divided into two stages (or ice mantles have two layered structure in terms of their molecular compositions) (e.g., Pontoppidan, 2006; Öberg et al., 2011); in the early stage, \ceH2O-dominated ice layers are formed. In the later stage, at higher extinction and density, the catastrophic CO freeze out happens, and ice layers which mainly consist of CO and its hydrogenated species (\ceH2CO and \ceCH3OH) are formed. Observations toward deeply embedded low mass protostars have revealed that the level of methanol deuteration, in particular the \ceCH3OD/\ceCH3OH ratio, is much higher than the HDO/\ceH2O ratio in the warm (100 K) gas around the protostars, where ices have sublimated (10-2 versus 10-3, Parise et al., 2006; Persson et al., 2013, 2014; Coutens et al., 2014). This trend indicates that deuterium fractionation is more efficient in the later stage of the ice formation when the catastrophic CO freeze out happens (Cazaux et al., 2011; Taquet et al., 2012, 2014; Furuya et al., 2016).
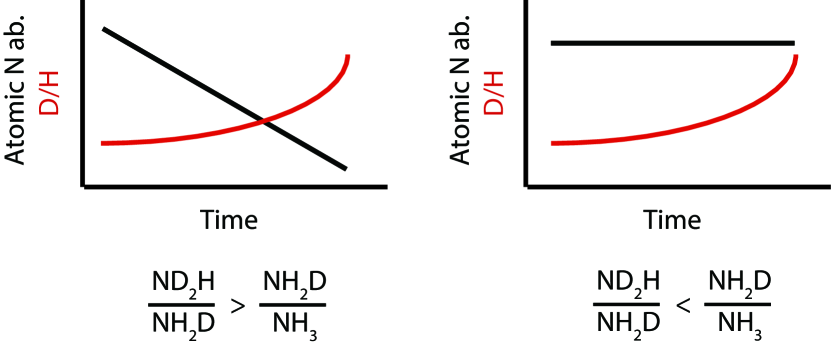
It is thought that ammonia ices are primary formed via sequential hydrogenation/deuteraion of atomic nitrogen on a (icy) grain surface, supported by laboratory experiments (Hidaka et al., 2011; Fedoseev et al., 2015a, b). We show how the evolution of atomic nitrogen abundance during ice formation is reflected in the []/[] ratio, using a simple analytical model. Specifically, one can distinguish two cases, whether the significant fraction of elemental nitrogen is present in the atomic form until the later stage of ice formation or not, using the []/[] ratio. A similar analysis was made by Furuya et al. (2016) for water ice to explain the higher \ceD2O/HDO ratio than the HDO/\ceH2O ratio observed in the warm gas around a protostar (10-2 versus 10-3; Coutens et al., 2014).
Let us consider a two stage model (or a two-layer ice model). We denote the total amount of nitrogen locked into \ceNH3, \ceNH2D, or \ceND2H ices at each stage (or in each layer) , where = I or II, as . Denoting the fraction of nitrogen locked into \ceNX3 ice, where X is H or D, as , one can express the amount of \ceNX3 ice formed in stage as . We introduce a free parameter that satisfies / = /. Fedoseev et al. (2015b) found that sequential reactions of H and D atoms with atomic nitrogen on a cold substrate lead to the []/[] production rate ratio of 1/3, i.e., the statistical ratio, in their experiments. On the other hand, they found that the production rates for \ceNH3:\ceNH2D:\ceND2H:\ceND3 (0.4:2.1:3.5:2) are deviated from the statistical distribution of 1:3:3:1, assuming the atomic D/H ratio of unity in the mixed atom beam fluxes. This result indicates that every deuteration reaction has a probability of a factor of 1.7 higher to occur over the corresponding hydrogenation reactions (Fedoseev et al., 2015b). They concluded that the main reason for this deuterium enrichment is higher sticking probability of D atoms than that of H atoms in their experiments (i.e., the atomic D/H ratio on a surface is higher than unity). Indeed, the production rates obtained by their experiments can be explained by the statistical distribution with a H:D ratio of 1:1.7, i.e., \ceNH3:\ceNH2D:\ceND2H:\ceND3 = 0.4:2.1:3.5:2 = 1:5.3:8.8:5 1:::. It should be noted that the statistical distribution of \ceNH3:\ceNH2D:\ceND2H:\ceND3 does depend on the atomic D/H ratio, while the statistical ratio of []/[] does not. This characteristic makes the []/[] ratio more useful for investigating nitrogen chemistry than the \ceNH3:\ceNH2D:\ceND2H distribution (cf. Rodgers & Charnley, 2002). We assume .
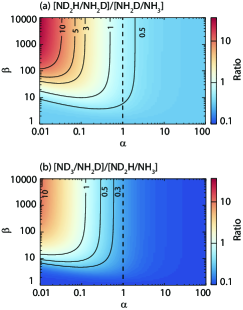
Using the above relations and denoting the ratio and the ratio as and , respectively, one can express the / ratio in the whole ice mantle as follows (cf. Eq. 4 in Furuya et al., 2016):
| (5) | ||||
| (6) |
where parameter is defined as , and is assumed to be 1. Parameter is defined as (i.e., amount of gaseous N i in the later stages versus early stages). Then corresponds to the case when most \ceNH3 ice is formed in the early stage, but the production of ammonia ice continues in the later stage with reduced efficiency. This can be interpreted that most N i is consumed by the formation of N-bearing molecules, such as \ceN2 and \ceNH3, in the early stage, and only a small amount of N i remains in the later stage. corresponds to the case when most \ceNH3 ice is formed in the later stage, i.e., gaseous N i (the source of \ceNH3 ice) remains as the primary nitrogen reservoir until the later stage, and the production of \ceNH3 ice is enhanced due to increased density and attenuation of UV radiation.
Figure 1, the top panel shows the / ratio as a function of and . It is sufficient to consider the case of , because the deuterium fractionation becomes more efficient in the later stage. Note that to explain 10 times higher \ceD2O/HDO ratio than the HDO/\ceH2O ratio, is required for HDO (Furuya et al., 2016). For and , the ratio is higher than unity and increases with decreasing . For , the ratio is lower than unity, regardless of . Then the ratio allows us to prove the evolution of the N i abundance. The situation is summarized in Figure 2.
The above discussion may be an oversimplification. For example, the gas-phase formation of ammonia followed by freeze-out was neglected. In the rest of this paper the robustness of the method is tested using astrochemical simulations.
In order to find the best tracer of N i, we explored other combinations of ammonia deuteration ratios than the / ratio, using the two-stage model. Our conclusion is that the / ratio is the best. For example, the [\ceND3/\ceNH2D]/[\ceND2H/\ceNH3] ratio shows the similar dependence on and (Figure 1, bottom panel), assuming the statistical ratio, / = /. It is, however, required to additionally detect triply deuterated ammonia, \ceND3. Then we focus on the / ratio in this paper.
3 Numerical setup
We simulate molecular evolution from the formation of a molecular cloud to a protostellar core as in our previous studies (Furuya et al., 2015, 2016).
3.1 Physical model
We use two types of physical models: one dimensional shock model for the formation and evolution of a molecular cloud due to the compression of diffuse H i gas by super-sonic accretion flows (Bergin et al., 2004; Hassel et al., 2010) and one-dimensional radiation hydrodynamics simulations for the evolution of a prestellar core to form a protostar via the gravitational collapse (Masunaga & Inutsuka, 2000). Here we present brief descriptions of the two models, while more details can be found in the original papers.
The shock model simulates the physical evolution of post-shock materials, i.e., molecular cloud, considering heating and cooling processes in a plane-parallel configuration. The interstellar UV radiation field of Draine (1978) is adopted. The cosmic-ray ionization rate of H2 is set to be s-1. We assume the pre-shock H i gas density of 10 cm-3 and the pre-shock velocity of 15 km s-1 as in Furuya et al. (2015). The forming and evolving cloud has the gas density of 104 cm-3 and gas and dust temperatures of 10-20 K, depending on time (Figure 3, panel a). The column density of the cloud increases linearly with time and the time it takes for the column density to reach = 1 mag is 4 Myr. In the shock model, ram pressure dominates the physical evolution rather than self-gravity.
The collapse model simulates the gravitational collapse of a prestellar core with the mass of 3.9 assuming spherical symmetry. The protostar is born at the core center at yr after the beginning of the collapse, corresponding to 1.4, where is the free-fall time of the initial central density of hydrogen nuclei 6 cm-3. After the birth of the protostar, the model further follows the physical evolution for yr.
3.2 Chemical model
In the physical models, Lagrangian fluid parcels are traced. The kinetic rate equation is solved along the fluid parcels to obtain the molecular evolution in the fluid parcels (e.g., Aikawa, 2013). The molecular abundances obtained by the cloud formation model are used as the initial abundances for the gravitational collapse model.
Our chemical model is basically the same as that used in Furuya et al. (2015). The gas-ice chemistry is described by a three-phase model, in which three distinct phases, gas-phase, icy grain surface, and the bulk of ice mantle are considered (Hasegawa & Herbst, 1993). Gas-phase reactions, gas-surface interactions, and surface reactions are considered, while the bulk ice mantle is assumed to be chemically inert. We consider the top four monolayers of the ice as a surface following Vasyunin & Herbst (2013). Our chemical network is originally based on that of Garrod & Herbst (2006), while gaseous nitrogen chemistry has been updated following recent references (Wakelam et al., 2013; Loison et al., 2014; Roueff et al., 2015). The network has been extended to include up to triply deuterated species and nuclear spin states of \ceH2, \ceH3+, and their isotopologues. The state-to-state reaction rate coefficients for the \ceH2-\ceH3+ system are taken from Hugo et al. (2009). The self-shielding of \ceH2, HD, CO, and \ceN2 against photodissociation are taken into account (e.g., Visser et al., 2009; Li et al., 2013). The photodesorption yield per incident FUV photon is for water ice (Arasa et al., 2015). We assume the yield of for ammonia ice. The photodesorption yields for CO and \ceN2 ices are treated in a special way and given as increasing functions of the surface coverage of CO (Furuya et al., 2015). The yield for CO ice varies from to 10-2, while that for \ceN2 ice varies from to (Fayolle et al., 2011; Bertin et al., 2012, 2013).
There are some updates from the model in Furuya et al. (2015); (i) the treatment of charge exchange and proton/deuteron transfer reactions, (ii) the binding energy on a grain surface, and (ii) mass for calculating transmission probabilities of tunneling reactions on grain surfaces. In our previous work, complete scrambling of protons and deuteron was assumed for all types of reactions (Aikawa et al., 2012). The assumption on the complete scrambling is not appropriate, at least, for charge exchange and proton/deuteron transfer reactions (Rodgers & Millar, 1996; Sipilä et al., 2013). We relax the assumption for these two types of reactions, following Sipilä et al. (2013). This modification reduces the production rates of multiply deuterated species, such as \ceND2H and \ceND3, via gas-phase reactions when deuterium fractionation proceeds significantly and multiply deuterated \ceH3+ becomes abundant.
Laboratory experiments have shown that the binding energy of species depends on the type of surfaces (e.g., Fayolle et al., 2016). As described in Section 2, the surface composition of the ISM ice can vary from a \ceH2O-rich polar surface to a \ceCO-rich apolar surface, depending on time. In our model the binding energy of species , , is calculated as a function of surface coverage of species , , where = \ceH2, CO, \ceCO2, or \ceCH3OH:
| (7) |
where is the binding energy of species on species . The set of the binding energies on a water ice substrate, , is taken from Collings et al. (2004); Garrod & Herbst (2006); Wakelam et al. (2017). In particular for this work, for O i, N i, CO, and \ceN2 are set to be 1320 K, 720 K, 1300 K, and 1170 K, respectively, following laboratory experiments (Fayolle et al., 2016; Minissale et al., 2016). for atomic hydrogen and \ceH2 are set to be 550 K. There is no laboratory data or estimate for most in the literature. In order to deduce for all species, where is either \ceH2, CO, \ceCO2. or \ceCH3OH, we assume scaling relations (cf. Taquet et al., 2014),
| (8) |
where is . We adopt = 23/550, = 855/1300, = 2300/2690, and = 4200/5500 (e.g., Öberg et al., 2005; Cuppen & Herbst, 2007; Noble et al., 2012). Fayolle et al. (2016) found that the binding energy ratio of \ceN2 to CO is around 0.9 regardless of a type of a substrate in their laboratory experiments. This partly supports the above assumption that is independent of adsorbed species . The energy barrier against surface diffusion by thermal hopping is set to be 0.45 for all species.
The sticking probability of neutral species on a grain surface is given as a function of the binding energy and dust temperature:
| (9) |
where is the sticking probability formula recommended by He et al. (2016) (see their Eq. 1), who experimentally investigated the sticking probability for stable molecules on nonporus amorphous water ice. Equation (9) gives, in general, the sticking probability of around unity for all species at 10 K, while the probability is close to zero well above the sublimation temperature of each species.
Grain-surface reactions are assumed to occur by the Langmuir-Hinshelwood mechanism. When the rates of surface reactions with activation energy barriers are calculated, reaction-diffusion competition is considered (e.g., Chang et al., 2007; Garrod & Pauly, 2011). The activation energy barriers are assumed to be overcome either thermally or via quantum tunneling, whichever is faster. The transmission probability of tunneling reactions is calculated assuming a rectangular potential barrier, using the reduced mass of the system (Tielens & Hagen, 1982). As pointed out by several authors, the use of the reduced mass of the system for hydrogen abstraction reactions, such as OH + \ceH2 \ceH2O + H, underestimates the transmission probability by orders of magnitude (Hidaka et al., 2009; Oba et al., 2012; Lamberts et al., 2014). We use the mass of a hydrogen (deuterium) atom instead of the reduced mass in the calculation of the transmission probability of hydrogen (deuterium) abstraction reactions.
3.3 Parameters
Elemental abundances adopted in this work are the so called low metal abundances and taken from Aikawa & Herbst (1999). The elemental abundances relative to H are for C, for N, and for O. Deuterium abundance is set to be (Linsky, 2003). Our model also includes He, S, Si, Fe, Na, Mg, P, and Cl. All the elements, including H and D, are initially assumed to be in the form of either neutral atoms or atomic ions, depending on their ionization potential. Then the ortho-to-para ratio of \ceH2 is calculated explicitly in our model without making an arbitrary assumption on its initial value. For initial molecular abundances of the collapse model, we use the molecular abundances at the epoch when the column density reaches 2 mag in the cloud formation model.
Before the onset of the core collapse, we assume that the prestellar core keeps its hydrostatic structure for 106 yr (5.6). The visual extinction at the outer edge of the core is set to be 5 mag, being irradiated by the interstellar radiation field of Draine (1978). The cosmic-ray ionization rate of H2 is set to be s-1 throughout the simulations, while the flux of FUV photons induced by cosmic-rays is set to be cm-2 s-1.
4 Simulation results
4.1 Ice chemistry
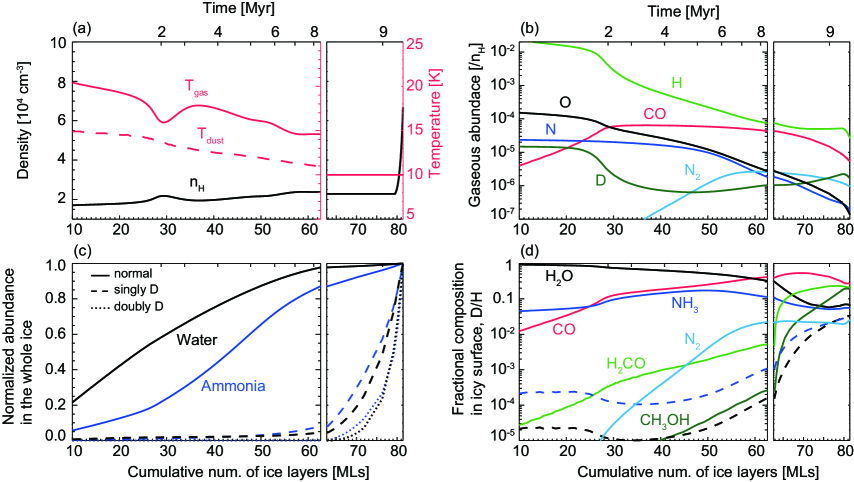
Figure 3 shows abundances of selected gaseous species with respect to hydrogen nuclei (panel b) and the fractional composition in the surface ice layers (panel d) as functions of the cumulative number of layers formed in the ice mantle. In each panel, 60 monolayers (MLs) correspond to the cloud formation stage, while 60 MLs correspond to the core stage. For the core stage, the results for the fluid parcel which reaches 5 AU from the central star at the final simulation time are shown. The label at the top represents time, in which corresponds to the time when the fluid parcel passes through the shock front, i.e., the onset of cloud formation.
H2O ice is the dominant component of the lower ice mantles (60 MLs) formed in the early times, while the upper ice layers (60 MLs) mainly consists of CO and its hydrogenated species, \ceH2CO and \ceCH3OH. The significant freeze-out of CO happens later than the formation of most of water ice in our model, because the freeze-out of CO is a self-limited process (Furuya et al., 2015); with increasing the CO coverage on a surface, the photodesorption yield of CO is enhanced and the binding energy of CO is reduced, the latter of which enhances the non-thermal desorption rate due to the stochastic heating by cosmic rays. The conversion of CO ice to \ceCH3OH ice becomes more efficient with increasing the abundance ratio of H atoms to CO in the gas phase (70 MLs; e.g., Charnley et al., 1997). The ratio and the ratio are much higher in the upper ice mantles than those in the lower ice mantles, due to the CO freeze-out, the drop of the ortho-to-para ratio of \ceH2, and the attenuation of UV radiation field (Furuya et al., 2016).
4.2 Elemental nitrogen partitioning
At the end of ice formation, when the number of ice layers reaches 80 MLs, most elemental nitrogen is distributed among \ceNH3 ice (76 %), gaseous and icy \ceN2 (22 %), and N i (1 %). In our model, \ceNH3 ice forms via sequential surface reactions,
| (10) | |||
| (11) | |||
| (12) |
The last reaction has an activation energy barrier of 2700 K in the gas phase (Espinosa-Garcia & Corchado, 2010; Hidaka et al., 2011), and the transmission probability of this barrier-mediate reaction is set to be 10-9. Note that reaction-diffusion competition is considered in our model. In our surface chemical network, the barrierless reaction \ceNH2 + \ceH \ceNH3 is included, in addition to Reaction (12). Neverthless, Reaction (12) is more efficient in our model, because the adsorption rate of \ceH2 on grain surfaces is much higher than that of atomic H, and thus \ceH2 is much more abundant than atomic H on surfaces. The rate-limiting step of the \ceNH3 ice formation is the adsorption of N i on a surface, and thus the formation rate of \ceNH3 ice should not depend on the surface reaction rates significantly. The \ceNH3 ice formation is balanced with the photodesorption of \ceNH3 ice in the cloud formation stage, and then the timescale of \ceNH3 ice formation is much longer than the freeze out timescale of N i (105 yr for the density of 104 cm-3). In the core stage, the interstellar UV radiation is attenuated significantly, and the timescale of \ceNH3 ice formation is determined by the freeze out of N i.
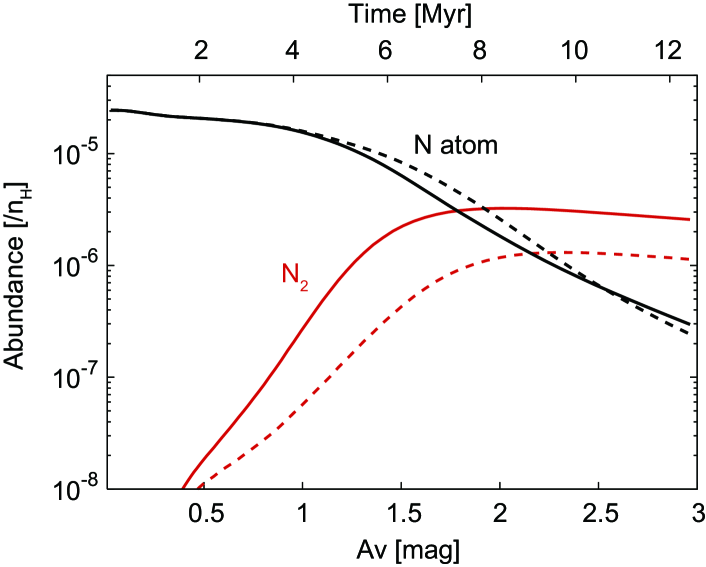
Interestingly, the formation of \ceNH3 ice helps the conversion of N i into \ceN2 in the gas phase through photodesorption; photodesorbed \ceNH3 is further photodissociated in the gas phase and the photofragment (\ceNH2 or \ceNH; Heays et al., 2017) reacts with N i to form \ceN2. \ceNH and \ceNH2 also react with C-bearing species to form CN, eventually leading to \ceN2 formation by Reaction (2). Figure 4 shows the impact of \ceNH3 photodesorption on the conversion of N i into \ceN2. The solid lines represent our fiducial model, while the dashed lines represent the model, in which the products of \ceNH3 photodesorption are set to be N + 3H. The comparison between the two models indicates that the formation of nitrogen hydrides in the gas phase triggered by \ceNH3 photodesorption accelerates the conversion of N i into \ceN2. Note that in the context of dark cloud chemistry where interstellar UV radiation field is neglected, \ceNH and \ceNH2 are produced from \ceN2 via ion-neutral gas-phase chemistry (e.g., Hily-Blant et al., 2010).
N2 ice is formed via the adsorption of gaseous \ceN2. Reaction between \ceN2 and atomic hydrogen is significantly endothermic, 104 K (Hidaka et al., 2011, and references therein), and thus \ceN2 ice does not react with icy H atoms.
4.3 Ammonia deuteration
Figure 5 shows the radial profiles of the abundances of selected species with respect to hydrogen nuclei (top panel) and the deuterium fractionation ratios in water and ammonia (bottom panel) in the protostellar envelope. Both icy water and ammonia sublimate into the gas phase at AU at temperatures of 150 K in our model. \ceN2 trapped in the ice mantle also sublimates into the gas phase with the sublimation of water and ammonia ices.
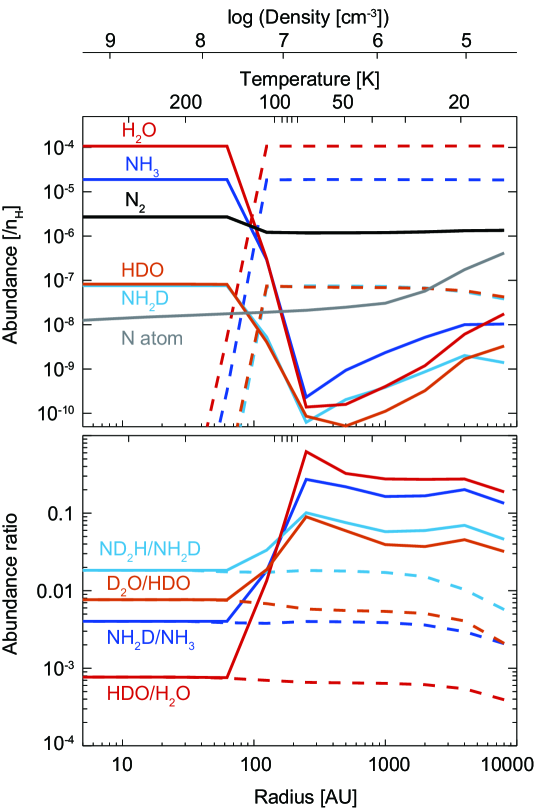
The deuteration ratios of ammonia and water in the gas phase of the protostellar envelope have two common characteristics in our model, both of which have been observationally confirmed for water (Coutens et al., 2012, 2014; Persson et al., 2013). First, the abundance ratio between singly-deuterated and non-dueterated forms in the inner warm regions ( K) is smaller than that in the outer cold envelope (e.g., versus 0.2 for ammonia in our model). The deuteration ratio in the outer envelope is determined by the gas-phase ion-neutral chemistry, while that in the warm regions is dominated by ice sublimation (see also Aikawa et al., 2012; Taquet et al., 2014). Second, in the warm regions, the abundance ratio between doubly-deuterated and singly-deuterated forms is higher than that between singly-deuterated and non-deuterated forms (e.g., []/[] 4). This is consistent with our prediction from the analytical two-stage model; in the case when most of atomic nitrogen is consumed during ice formation stages, the []/[] ratio in the whole ice mantle is greater than unity. The []/[] ratio in the inner warm regions is ten in our model, which is consistent with our previous work (Furuya et al., 2016). The molecular abundances and the deuterium fractionation ratios in the warm regions are summarized in Table d.
| Model11footnotemark: 1 | N i (%)22footnotemark: 2 | \ceN2 (%)22footnotemark: 2 | \ceNH3 (%)22footnotemark: 2 | |||||||
|---|---|---|---|---|---|---|---|---|---|---|
| A33footnotemark: 3 | 5.1(-2) | 22 | 76 | 1.8(-1) | 4.0(-3) | 1.8(-2) | 4.6 | 7.7(-4) | 10 | 1.4(-2) |
| B | 0.1 | 51 | 46 | 1.1(-1) | 1.0(-2) | 1.8(-2) | 1.8 | 7.6(-4) | 9.5 | 1.3(-2) |
| C | 57 | 13 | 28 | 6.5(-2) | 2.0(-2) | 1.3(-2) | 6.6(-1) | 7.9(-4) | 8.3 | 1.3(-2) |
| A’44footnotemark: 4 | 6.4(-2) | 29 | 69 | 1.6(-1) | 9.6(-3) | 1.8(-2) | 1.9 | 7.9(-4) | 9.4 | 1.4(-2) |
Values in the warm gas ( K) at yr after the protostellar birth. means . bbbbFractions of elemental nitrogen in percentage form. ccccOur fiducial model. ddddSimilar to model A, but without Reaction (12) and the same reactions of the corresponding deuterium isotopologues.
Figure 3, panel (c) shows the abundances of non-deuterated and deuterated forms of water ice (black) and ammonia ice (blue) normalized by their maximum abundances. The formation of \ceNH3 ice is behind that of \ceH2O ice (in terms of the analytical two-stage model, for nitrogen is smaller than that for oxygen), while the timing of the formation of deuterated ammonia ice and deuteratd water ice are similar. These are reflected in the lower []/[] ratio than the []/[] ratio in the warm regions in our fiducial model. Also the delayed \ceNH3 ice formation is reflected in the ratio in our fiducial model; the ratio is between the ratio and the \ceCH3OD/\ceCH3OH ratio (but see Section 5.2).
5 Parameter dependences
5.1 Primary nitrogen reservoir
In our fiducial model, most nitrogen is locked in \ceNH3 ice (76 % of overall nitrogen and the \ceNH3/\ceH2O abundance ratio of 18 %), as widely seen in published gas-ice astrochemical models (e.g., Chang & Herbst, 2014; Pauly & Garrod, 2016). In this subsection, we discuss the effect of the primary nitrogen reservoir on the []/[] ratio.
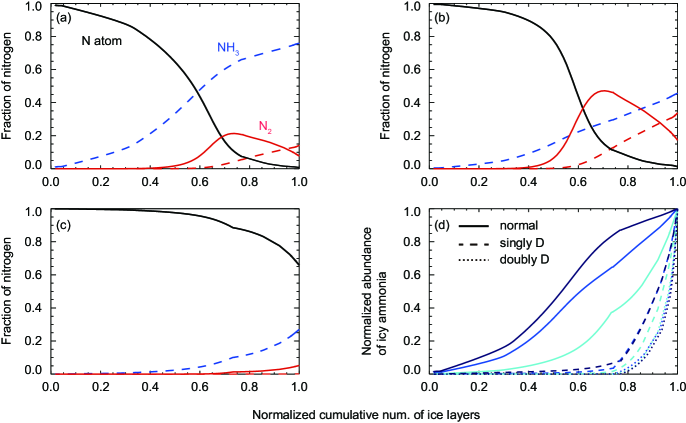
As discussed in Section 4.2, photodesorption of \ceNH3 assists the conversion of N i into \ceN2, while it slows down the accumulation of \ceNH3 ice. Then it is expected that the fraction of nitrogen locked in \ceNH3 ice decreases with increasing the photodesorption yield of \ceNH3, while that of \ceN2 increases. The recently measured photodesorption yield for pure \ceNH3 ice in laboratory is per incident photon (Martin-Domenech et al., 2017). We run the model in which the ptotodesortption yield of \ceNH3 is (i.e., 3 times larger than in our fiducial model). Hereafter we refer to this model as model B. Figure 6 compares the fractions of elemental nitrogen locked in the selected species in our fiducial model (panel a) and those in model B (panel b). The horizontal axis is the cumulative number of layers formed in the ice mantle normalized by the total number of ice layers at the end of ice formation (70-80 MLs depending on a model). As has been expected, the fraction of elemental nitrogen locked in \ceN2 is higher in model B than in the fiducial model (51 % versus 22 %). In model B, \ceNH3 ice, gas and icy \ceN2, and N i contain 46 %, 51 %, and 0.1 % of overall nitrogen, respectively. Partitioning of nitrogen between \ceNH3 ice and \ceN2 is sensitive to the photodesorption yield of \ceNH3 ice.
Both in the fiducial model and in model B, most nitrogen is locked in molecules. The analytical model presented in Section 2 predicts that the []/[] ratio is similar to the statistical value of 1/3 and lower than unity when N i remains as the primary nitrogen reservoir. In order to simulate this case, we run an additional model (labeled model C). In model C, the rates of any reactions which include N i as a reactant are reduced by a factor of 20. Then in model C, both the formation of \ceNH3 ice and \ceN2 gas are slowed down compared to that in the fiducial model. This assumption is very artificial and model C should be considered as just a numerical experiment. In model C, \ceNH3 ice, gas and icy \ceN2, and N i contain 28 %, 13 %, and 57 % of overall nitrogen, respectively (Table d and Figure 6, panel c).
The []/[] ratio is the largest in the fiducial model (4.6) followed in order by model B (1.8) and model C (0.66). The conversion of N i to \ceNH3 ice and \ceN2 occurs earlier in the fiducial model than in model B, and the significant fraction of nitrogen remains as N i even at the end of the ice formation stage in model C (Figure 6, panels a,b,c). Thus, as predicted by the analytical stage model, the evolution of the N i abundance is reflected in the []/[] ratio. Figure 6, panel d shows when non-deuterated and deuterated forms of ammonia ice are mainly formed in the fiducial model, in model B, and in model C. The fraction of ammonia ice without significant deuterium fractionation (0.8 in the normalized cumulative number of ice layers) is the largest in the fiducial model and the smallest in model C (in terms of the analytical two-stage model, is the smallest in the fiducial model and the largest in model C).
5.2 Additional considerations
In our fiducial model, the main formation reaction of \ceNH3 ice is the barrier-mediated reaction \ceNH2 + \ceH2 \ceNH3 + H on a grain surface rather than the barrierless reaction \ceNH2 + \ceH \ceNH3. Furuya et al. (2015) found that the level of water ice deuteration depends on which formation reaction, the barrier-mediated reaction \ceOH + \ceH2 \ceH2O + H or the barrierless reaction \ceOH + \ceH \ceH2O is more effective. When the barrier-mediated reaction is the primary formation reaction, water ice deuteration can be significantly suppressed through the cycle of photodissociation by interstellar UV radiation and reformation of water ice, which efficiently removes deuterium from water ice chemistry (see also Kalvāns et al., 2017). We confirmed that the same mechanism is at work for ammonia as well as water. In our fiducial model, the ratio in the icy species (10-4-10-3) is smaller than the atomic D/H ratio in the gas phase (10-3-10-2) in the cloud formation stage by a factor of 10, while the difference becomes much smaller in the core stage (Figure 3, panels b,d). While laboratory experiments demonstrated that \ceOH + \ceH2 \ceH2O + \ceH proceeds on a cold surface by quantum tunneling (Oba et al., 2012), to the best of our knowledge, \ceNH2 + \ceH2 \ceNH3 + H on a cold surface has not been studied in laboratory.
In order to check the dependence of our results on the main formation reaction of \ceNH3 ice, we rerun our fiducial model without the surface reaction \ceNH2 + \ceH2 and the same reactions of the corresponding deuterium isotopologues. Compared to the fiducial model, the ratio in the warm gas ( K) is enhanced by a factor of 2, and close to the \ceCH3OD/\ceCH3OH ratio. The []/[] ratio is reduced by a factor of 2, but still much higher than that in model C, in which N i remains as the primary reservoir of nitrogen. The main formation reaction of \ceNH3 ice does not affect our results qualitatively.
Fedoseev et al. (2015a) performed laboratory experiments for ammonia ice formation in CO ice through sequential hydrogenation of N atoms. They found that HNCO forms in their experiments likely via the reaction,
| (13) |
where NH is the intermediate in the formation of \ceNH3. Similarly formamide (\ceNH2CHO) may be formed via the following surface reaction (Fedoseev et al., 2016),
| (14) |
These two reactions, which are not included in our surface chemical network, may reduce the production rate of ammonia ice on CO-rich layers and thus could enhance the []/[] ratio.
Recent observations of the warm gas around low-mass protostar IRAS 16293-2422B (Coutens et al., 2016) found that the levels of deuteration in HNCO and \ceNH2CHO are similar to the \ceCH3OD/\ceCH3OH ratio. This finding is consistent with the scenario that HNCO and \ceNH2CHO are formed via surface reactions on CO-rich ice layers (Coutens et al., 2016). The observed \ceHNCO and \ceNH2CHO column densities are, however, lower than the \ceCH3OH column density in the same source by factors of 1000 (Coutens et al., 2016; Jørgensen et al., 2016). According to infrared ice observations, the \ceNH3/\ceCH3OH ratio in the cold outer envelope of low-mass protostars is the order of unity (Öberg et al., 2011). These indicate that either atomic nitrogen is already poor when the catastrophic CO freeze out happens or only the small fraction of atomic nitrogen adsorbed on grain surfaces contributes to the formation of HNCO and \ceNH2CHO ices. In either case, Reactions (13)-(14) would not affect our results qualitatively.
6 Discussion: Observability of deuterated ammonia in the warm gas
There have been several observational studies to quantify the ammonia deuteration in star formation regions. Most measurements are of the cold gas in prestellar cores and in outer envelopes of deeply embedded protostars, using single dish telescopes (e.g., Lis et al., 2002; Roueff et al., 2005; Harju et al., 2017). For example, observations toward the prestellar core I16293E shows ratios of % (Loinard et al., 2001; Roueff et al., 2005). Measurements for the cold large scale envelope toward a deeply embedded low-mass protostar NGC 1333-IRAS 4A show a ratio of 7 % (Shah & Wootten, 2001). These extremely high and ratios are reasonably well reproduced in the outer cold regions of our protostellar envelope model (1000 AU, Figure 5).
While in agreement with the modeling presented here, these previous measurements, however, would not reflect the deuteration in ice, being supported by astrochemical models (Figure 5, see also Aikawa et al., 2012; Taquet et al., 2014). The nitrogen deuterium fractionation in the cold gas in the large scale envelope do not differ significantly between the various models. The ratio deduced in the large scale envelope is thus not a suitable indicator for distinguishing between the different scenarios of atomic nitrogen evolution. To measure the ammonia deuteration in the bulk ice, interferometric observations towards the recently sublimated warm gas in the inner regions of protostars are necessary. It has been already shown that the values of water deuteration measured in the large scale cold envelope is much higher than that measured in the warm envelope around protostars, where water ice has sublimated (Coutens et al., 2012; Persson et al., 2013).
To assess the possibility of distinguishing between the different models with observations, we here calculate the spectra of \ceNH3, \ceNH2D and \ceND2H toward a typical Class 0 protostar assuming the ratios in model A in Table d. The synthetic spectra are compared to typical sensitivities in the relevant Karl G Jansky Very Large Array (VLA) and Atacama Large Millimeter/submillimeter Array (ALMA) bands with reasonable integration times (10 hours with VLA and 4 hours with ALMA) calculated using officially available tools (sensitivity calculators111VLA https://obs.vla.nrao.edu/ect/, ALMA https://almascience.eso.org/proposing/sensitivity-calculator) at a target resolution of 04. This can then aid the planning of future observations.
To this date, very few detections of compact ammonia emission toward a deeply-embedded protostar exists. Choi et al. (2007, 2010) presented detections of the and transitions of \ceNH3 using the VLA telescope at high resolution () toward the protobinary source IRAS 4A, located at a distance of 235 pc (Hirota et al., 2008). In Fig. 5 the relevant volume hydrogen density in the warm region is typically cm-3, which is well above the critical density for all \ceNH3 lines (e.g., Maret et al., 2009), which shows that LTE is prevalent in these sources and scales. We can then use general relations e.g., Goldsmith & Langer (1999) to reproduce the observed line fluxes. A similar method to constrain an abundance is presented in e.g. Persson et al. (2013); Coutens et al. (2016). The detected ammonia spectral lines are well reproduced by a column density of cm-2 at an excitation temperature of 250–300 K, assuming LTE and accounting for the optical depth. For Class I sources, Sewilo et al. (2017) presented archival observations of ammonia toward the source HH111/HH121 at medium spatial resolution (″). The sparse results on compact ammonia emission highlights even further the importance of more observations constraining the ammonia abundances in these warm inner regions of deeply embedded protostars.
With observations of \ceH2^18O (Persson et al., 2013, 2014) we can estimate the \ceNH3/\ceH2O column density ratio in the warm gas222Assuming a \ce^16O/\ce^18O ratio of 560 (relevant for these galactocentric distances Wilson & Rood, 1994; Wilson, 1999), that can be compared with that obtained by infrared ice observations. For the north-western source of the IRAS 4A binary the \ceH2O column density was constrained by Persson et al. (2014) to cm-2, and we get a \ceNH3/\ceH2O column density ratio in the warm gas of 13-16 %. This value is close the \ceNH3/\ceH2O ice column density ratio in low-mass protostellar envelopes, 3-10 %, depending on sources (Boogert et al., 2015, and references therein), indicating that our LTE method is reasonable. Note that IRAS 4A is a highly extincted Class 0 source and ice measurements are not available.
To estimate the line fluxes of \ceNH3, \ceNH2D and \ceND2H we will use the deeply embedded source IRAS 16293-2422 (hereafter I16293). It is located in the Ophiucus star forming complex, at a distance of 120 pc (Loinard et al., 2008) and is a binary source with a 5″ (600 AU) separation where the north western source is referred to as A, and the south easter as B. The molecular content of I16293 has been extremely well explored with both interferometers and single dish telescopes (Bottinelli et al., 2004; Bisschop et al., 2008; Jørgensen et al., 2011). Jørgensen et al. (2016) presents an extensive review of the work done towards I16293. The water isotopologue \ceH2^18O was observed at high resolution with ALMA and SMA (Persson et al., 2013), and it was only possible to deduce the column density toward source A. Using the derived water column density and the \ceNX3/\ceH2O abundance ratio in our models (X is H or D; Table d), we can estimate the \ceNX3 column density in I16293. Assuming the conservative scenario of model A from Table d, we here estimate the column densities of \ceNH3, \ceNH2D, and \ceND2H. The \ceH2O water column density from Persson et al. (2013) is cm-2. Assuming an excitation temperature of 200 K towards the warm gas of I16293 as in the innermost regions of the model (c.f. Fig. 5), similar to e.g. Persson et al. (2013) we can calculate the expected line strengths. The water column density gives a column density of cm-2 for \ceNH3, cm-2 for \ceNH2D, and cm-2 for \ceND2H. For the modeled spectra, we assume a size of the emitting region of 04 and a beam size of 04.
The \ceNH3v=0 transition frequencies and constants are taken from the Spectral Line Atlas of Interstellar Molecules (SLAIM), available at http://www.splatalogue.net (F. J. Lovas, Remijan et al., 2007) queried through the Astroquery interface (Ginsburg et al., 2017). For \ceNH2D and \ceND2H the frequencies and constants are from the Cologne Database for Molecular Spectroscopy (CDMS, Müller et al., 2005).
6.1 Lines in the 1 to 52 GHz frequency range
The VLA receivers operate mainly in 8 different bands with a combined continuous spectral coverage between 1 and 50 GHz333This excludes band 4 and the P-band, operating below 1 GHz, but with only on a limited number of antennae and at a highest angular resolution of 56, which is not relevant for this study.. With a schedule of different configurations it achieves resolutions ranging from 0043 to 46″. ALMA band 1 covers the frequency range 35 to 52 GHz (50-52 GHz is on best-effort basis). The typical 3 sensitivity of an observation run of about 10 hours for VLA is 1 mJy in a 04 beam, valid between around 4 and 48 GHz444Assuming 27 antennae, winter conditions, 2.2 km s-1 channel width, and an elevation of the target between 50–90 degrees.. For ALMA band 1 it is not possible to estimate the sensitivity with the online estimator, but it is assumed to be at a similar level to VLA (1 mJy/beam), but with less observation time.
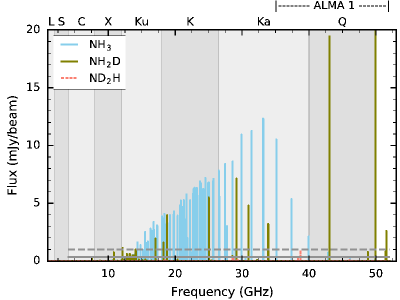
The resulting LTE spectra for \ceNH3, \ceNH2D and \ceND2H in the VLA spectral range (1–50 GHz) is shown in Figure 7. The main lines to target with VLA are between 15–38 GHz for \ceNH3, and while 7 lines of \ceNH2D are available in the same range, there are no \ceND2H lines predicted to be above the level. The \ceNH2D line at 49.96 GHz is just at the edge of the Q-band where sensitivity is significantly lower. Furthermore, as optical depth might be an issue for some of the transitions, a wide spread in and Einstein A coefficient is the best strategy. The beam is matched to the rough size of the warm inner regions of the sources, once abundances and emission extent has been determined more exact with high sensitivity observations, it is possible to observe the lines at higher spatial and spectral resolution to constrain the distribution and kinematic origin of ammonia further. As can be seen only a few lines of deuterated ammonia are available with VLA, and they are spread out over several bands which is not an ideal observing strategy. Furthermore, no \ceND2H transitions can be detected with VLA, thus we have to turn to higher frequencies and observe the target with the ALMA telescope. ALMA band 1 covers a few \ceNH3 and \ceNH2D lines, and could thus be used for observations, once operational. However, the main transition bands are covered by VLA and is thus the most suitable instrument.
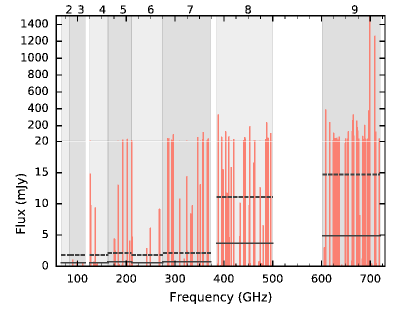
6.2 Lines 65 to 720 GHz frequency range
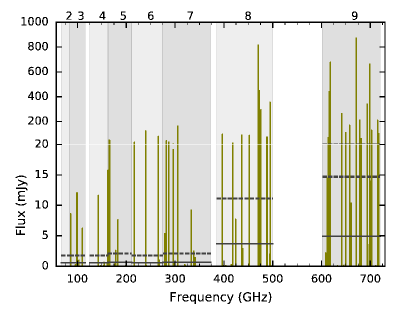
The ALMA telescope array is equipped with receivers covering frequencies between 35 and 720 GHz in bands 1 through 9. Band 1 and 2, i.e. 35 to 90 GHz is under construction, thus the band 2 sensitivity is assumed to be similar as in band 3 (and band 1 sensitivity similar to VLA at same frequency). With baselines ranging from 160 m to 16 km the resulting spatial resolution range from 0020 to 48. The typical 3 sensitivity of an observation run of about 4 hours integration time in a 04 beam differs between the bands, but lies around 0.7 mJy beam-1 in bands 1 through 7, and increases to around 4 mJy beam-1 in band 8 and 5 mJy beam-1 in band 9. However, the high frequency bands (band 8 and 9) need lower levels of precipitable water vapor (PWV) for these sensitivities. Thus they are less favorable since less time is available for such observations, and there are transitions at lower frequencies.
As the figures show, there are several lines of \ceNH2D and \ceND2H present well above the sensitivity level in most receiver bands. However the highest overlapping density of lines with high signal-to-noise (SNR) is in band 7. Thus the best target for deuterated ammonia with ALMA is in band 7, around 300 GHz. The higher frequency bands, band 8 and 9 need better weather for a given sensitivity, and is as such less efficient to observe. Furthermore, given the high SNR of the lines in band 7, it is possible to observe sources with lower column densities.
While the main frequency region for \ceNH3 is in the VLA receiver bands, there are two lines in ALMA band 7 that might be possible to detect (at 354 and 361 GHz). However, their high energy levels ( K) and low Einstein A () makes them more difficult to detect. In addition to the target lines of \ceNH2D and \ceND2H, there are two \ceND3 lines as well; the \ceND3 transition at 307 GHz, and the transition at 310 GHz. Thus with a single spectral setup and around 4 hours of ALMA integration time in band 7, it should be possible to characterize the \ceNH2D, \ceND2H and \ceND3 column densities, all at once. This further highlights the importance of band 7 for ALMA observations of ammonia. Combining this with VLA observations of \ceNH3 it is possible to constrain the ratios studied here, and constrain the amount of N i in young, deeply embedded protostars. Once again, targeting a combination of transitions with different energy levels and transition probabilities is the best strategy to constrain the abundances.
7 Conclusion
Partitioning of elemental nitrogen in star-forming regions is not well constrained. Most nitrogen is expected to be partitioned among N i, \ceN2, and icy N-bearing molecules, such as \ceNH3 and \ceN2. Neither N i nor \ceN2 is directly observable in the cold gas, while the \ceN2 abundance can be constrained via a proxy molecule, \ceN2H+. In this paper, we have proposed an indirect way to constrain the amount of atomic nitrogen in the cold gas of star-forming clouds, via deuteration in ammonia ice. Using a simple analytical model and gas-ice astrochemical simulations, which trace the evolution from the formation of molecular clouds to protostellar cores, we showed the evolution of the N i abundance in the cold ( K) ice formation stages is reflected in the icy []/[] ratio. If N i remains as the primary reservoir of nitrogen during cold ice formation stages, the ratio is close to the statistical value of 1/3 and lower than unity, whereas if N i is largely converted into N-bearing molecules, the ratio should be larger than unity. The []/[] ratio in ice mantles in star-forming clouds can be quantified with VLA and ALMA observations of the inner warm regions around protostars, where ammonia ice has completely sublimated, with reasonable integration times (Section 6).
We also found that partitioning of nitrogen between \ceNH3 ice and \ceN2 is sensitive to the photodesorption yield of \ceNH3 ice. The fraction of elemental nitrogen locked in \ceNH3 ice decreases with increasing the photodesorption yield of \ceNH3 ice, while that in \ceN2 increases. The increased efficiency of \ceNH3 photodesorption slows down the accumulation of \ceNH3 ice, while it assists the conversion of N i into \ceN2; photodesorbed \ceNH3 is further photodissociated in the gas phase and the photofragment, \ceNH2 or \ceNH, reacts with N i to form \ceN2 (Section 4.2).
Finally, as demonstrated in this paper for nitrogen and in Furuya et al. (2016) for oxygen, multiple deuteration can be a strong tool to constrain the evolution of atomic reservoirs in the cold gas. The method could be applied to other elements, such as sulfur, by observing e.g., H2S, H2CS and their deuterated forms, if they are mainly formed by surface reactions. However, to do that, laboratory and theoretical studies of their formation and deuteration pathways on surfaces are necessary.
Acknowledgements
We thank Satoshi Yamamoto and Yuri Aikawa for fruitful discussions on \ceN2 chemistry. We also thank the referee for the valuable comments that helped to improve the manuscript. K.F. acknowledges the support by JSPS KAKENHI Grant Number 17K14245. M.V.P. postdoctoral position is funded by the ERC consolidator grant 614264.
References
- Aikawa (2013) Aikawa Y., 2013, Chem. Rev., 113, 8961
- Aikawa & Herbst (1999) Aikawa, Y., & Herbst, E. 1999, ApJ, 526, 314
- Aikawa et al. (2012) Aikawa, Y., Wakelam, V., Hersant, F., Garrod, R., & Herbst, E. 2012, ApJ, 760, 40
- Arasa et al. (2015) Arasa, C, Koning, J., Kroes, G.-J.,Walsh, C., & van Dishoeck, E. F. 2015, A&A, 575, 121
- Bergin et al. (2004) Bergin, E. A., Hartmann, L.W., Raymond, J. C., & Ballesteros-Paredes, J. 2004, ApJ, 612, 921
- Bergin & Tafalla (2007) Bergin, E. A. & Tafalla, M. 2007, ARA&A, 45, 339
- Bertin et al. (2012) Bertin, M., Fayolle, E. C., Romanzin, C., et al. 2012, Phys. Chem. Chem. Phys., 14, 9929
- Bertin et al. (2013) Bertin, M., Fayolle, E. C., Romanzin, C., et al. 2013, ApJ, 779, 120
- Bisschop et al. (2008) Bisschop, S. E., Jørgensen, J. K., Bourke, T. L., Bottinelli, S., & van Dishoeck, E. F. 2008, A&A, 488, 959
- Boogert & Ehrenfreund (2004) Boogert A. C. A., & Ehrenfreund P., 2004, in Witt A. N., Clayton G. C., Draine B. T., eds, ASP Conf. Ser. Vol. 309, Astrophysics of Dust. Astron. Soc. Pac., San Francisco, p. 547
- Boogert et al. (2002) Boogert A. C. A, Blake G. A., Tielens A. G. G. M., 2002, ApJ, 577, 271
- Boogert et al. (2015) Boogert, A. C. A., Gerakines, P. A., & Whittet, D. C. B. 2015, ARA&A, 53, 541
- Bottinelli et al. (2004) Bottinelli, S., Ceccarelli, C., Neri, R., et al. 2004, ApJ, 617, L69
- Cazaux et al. (2011) Cazaux, S., Caselli, P., & Spaans, M. 2011, ApJ, 741, L34
- Chang et al. (2007) Chang, Q., Cuppen, H. M., & Herbst, E. 2007, A&A, 469, 973
- Chang & Herbst (2014) Chang, Q., & Herbst, E. 2014, ApJ, 787, 135
- Charnley & Rodgers (2002) Charnley, S. B., & Rodgers, S. D. 2002, ApJ, 569, L133
- Charnley et al. (1997) Charnley, S. B., Tielens, A. G. G. M., & Rodgers, S. D. 1997, ApJ, 482, L203
- Choi et al. (2010) Choi, M., Tatematsu, K., & Kang, M. 2010, ApJ, 723, L34
- Choi et al. (2007) Choi, M., Tatematsu, K., Park, G., & Kang, M. 2007, ApJ, 667, L183
- Collings et al. (2004) Collings, M. P., Anderson, M. A., Chen, R., et al. 2004, MNRAS, 354, 1133
- Coutens et al. (2014) Coutens, A., Jørgensen, J. K., Persson, M., et al. 2014, ApJ, 792, L5
- Coutens et al. (2016) Coutens, A., Jørgensen, J., van der Wiel, M.H.D., et al. 2016, A&A, 590, L6
- Coutens et al. (2012) Coutens, A., Vastel, C., & Caux, E., et al. 2012, A&A, 539, 132
- Cuppen & Herbst (2007) Cuppen, H. M., & Herbst, E. 2007, ApJ, 668, 294
- Daranlot et al. (2012) Daranlot, J., Hincelin, U., Bergeat, A., et al. 2012, PNAS, 109, 10233
- Draine (1978) Draine, B. T. 1978, ApJS, 36, 595
- Elsila et al. (1997) Elsila J, Allamandola L. J., Sandford S. A., 1997, ApJ, 479, 818
- Espinosa-Garcia & Corchado (2010) Espinosa-Garcia, J., & Corchado, J. C. 2010, J. Phys. Chem. A, 114, 4455
- Fayolle et al. (2016) Fayolle, E. C., Balfe, J., Loomis, R., et al. 2016, ApJ, 816, L28
- Fayolle et al. (2011) Fayolle, E. C., Bertin, M., Romanzin, C., et al. 2011, ApJ, 739, L36
- Fedoseev et al. (2015a) Fedoseev G., Ioppolo S., Zhao D., Lamberts T., Linnartz H., 2015, MNRAS, 446, 439
- Fedoseev et al. (2015b) Fedoseev, G., Ioppolo, S., & Linnartz, H. 2015, MNRAS, 446, 449
- Fedoseev et al. (2016) Fedoseev, G., Chuang, K.-J., van Dishoeck, E. F., Ioppolo, S., & Linnartz, H. 2016, MNRAS, 460, 4297
- Furuya et al. (2015) Furuya, K., Aikawa, Y., Hincelin, U., Hassel, G. E., Bergin, E. A., Vasyunin, A. I., & Herbst, E. 2015, A&A, 584, 124
- Furuya et al. (2016) Furuya, K., van Dishoeck, E. F., Aikawa, Y. 2016, A&A, 586, 127
- Garrod & Herbst (2006) Garrod, R. T., & Herbst, E. 2006, A&A, 457, 927
- Garrod & Pauly (2011) Garrod, R. T., & Pauly, T. 2011, ApJ, 735, 15
- Ginsburg et al. (2017) Ginsburg, A., Parikh, M., Woillez, J., et al. 2017, Astrophysics Source Code Library, ascl:1708.004
- Gibb et al. (2004) Gibb, E. L., Whittet, D. C. B., Boogert, A. C. A., & Tielens, A. G. G. M. 2004, ApJS, 151, 35
- Goldsmith & Langer (1999) Goldsmith, P. F., & Langer, W. D. 1999, ApJ, 517, 209
- Harju et al. (2017) Harju, J., Daniel, F., Sipilä, O., et al. 2017, A&A, 600, 61
- Hassel et al. (2010) Hassel, G. E., Herbst, E., & Bergin, E. A. 2010, A&A, 515, 66
- Hasegawa & Herbst (1993) Hasegawa, T. I., & Herbst, E. 1993, MNRAS, 263, 589
- He et al. (2016) He, J., Acharyya, K., & Vidali, G. 2016, ApJ, 823, 56
- Heays et al. (2017) Heays, A. N., Bosman, A. D., & van Dishoeck, E. F. 2017, A&A, 602, 105
- Herbst & Klemperer (1973) Herbst, E., & Klemperer, W. 1973, ApJ, 185, 505
- Hidaka et al. (2009) Hidaka, H., Watanabe, M., Kouchi, A., & Watanabe, N. 2009, ApJ, 702, 291
- Hidaka et al. (2011) Hidaka H., Watanabe M., Kouchi A., & Watanabe N. 2011, Phys. Chem. Chem. Phys., 13, 15798
- Hily-Blant et al. (2010) Hily-Blant, P., Walmsley, M., Pineau des Forêts, G., & Flower, D. 2010, A&A, 513, 41
- Hirota et al. (2008) Hirota, T., Bushimata, T., Choi, Y. K., et al. 2008, PASJ, 60, 37
- Hugo et al. (2009) Hugo, E., Asvany, O., & Schlemmer, S. 2009, J. Chem. Phys., 130, 164302
- Jenkins (2009) Jenkins, E. B. 2009, ApJ, 700, 1299
- Jørgensen et al. (2011) Jørgensen, J. K., Bourke, T. L., Nguyen Luong, Q., & Takakuwa, S. 2011, A&A, 534, A100
- Jørgensen et al. (2016) Jørgensen, J. K., van der Wiel, M. H. D., Coutens, A., et al. 2016, A&A, 595, A117
- Kalvāns et al. (2017) Kalvāns, J., Shmeld, I., Kalnin, J. R., & Hocuk, S. 2017, MNRAS, 467, 1763
- Knauth et al. (2004) Knauth, D. C., Andersson, B.-G., McCandliss, S. R., & Warren Moos, H. 2004, Nature, 429, 636
- Kristensen et al. (2012) Kristensen, L. E., van Dishoeck, E. F., Bergin, E. A., et al. 2012, A&A, 542, A8
- Lamberts et al. (2014) Lamberts, T., Cuppen, H. M., Fedoseev, G., et al. 2014, ApJ, 570, 57
- Le Gal et al. (2014) Le Gal, R., Hily-Blant, P., Faure, A., et al. 2014, A&A, 562, 83
- Li et al. (2013) Li, X., Heays, A. N., Visser, R., et al. 2013, A&A, 555, A14
- Lis et al. (2002) Lis, D. C., Roueff, E., Gerin, M., et al. 2002, ApJ, 571, L55
- Linsky (2003) Linsky, J. L. 2003, Space Sci. Rev., 106, 49
- Loinard et al. (2001) Loinard, L., et al. 2001, ApJ, 552, L163
- Loinard et al. (2008) Loinard, L., Torres, R. M., Mioduszewski, A. J., & Rodríguez, L. F. 2008, ApJ, 675, L29
- Loison et al. (2014) Loison, J.-C., Wakelam, V., & Hickson, K. M. 2014, MNRAS, 443, 398
- Maret et al. (2006) Maret, S., Bergin, E. A., & Lada, C. J. 2006, Nature, 442, 425
- Maret et al. (2009) Maret, S., Faure, A., Scifoni, E., & Wiesenfeld, L. 2009, MNRAS, 399, 425
- Martin-Domenech et al. (2017) Martin-Domenech, R. and Cruz-Diaz, G. A. & Munoz Caro, G. M. 2017, arXiv:1710.06467
- Masunaga & Inutsuka (2000) Masunaga, H., & Inutsuka, S. 2000, ApJ, 531, 350
- McGonagle et al. (1990) McGonagle, D., Irvine, W. M., Minh, Y. C., & Ziurys, L. M. 1990, ApJ, 359, 121
- Minissale et al. (2016) Minissale, M., Congiu, E., & Dulieu, F. 2016, A&A, 585, 146
- Müller et al. (2005) Müller, H. S. P., Schlöder, F., Stutzki, J., & Winnewisser, G. 2005, Journal of Molecular Structure, 742, 215
- Murakawa et al. (2000) Murakawa, K., Tamura, M., Nagata, T. 2000, ApJS, 128, 603
- Noble et al. (2012) Noble, J. A., Congiu, E., Dulieu, F., & Fraser, H. J. 2012, MNRAS, 421, 768
- Oba et al. (2012) Oba, Y., Watanabe, N., Hama, T., et al. 2012, ApJ, 749, 67
- Öberg et al. (2011) Öberg, K. I., Boogert, A. C. A., Pontoppidan, K. M., et al. 2011, ApJ, 740, 109
- Öberg et al. (2005) Öberg, K. I., van Broekhuizen, F., Fraser, H. J., et al. 2005, ApJ, 621, L33
- Pagani et al. (2012) Pagani, L., Bourgoin, A., & Lique, F. 2012, A&A, 548, L4
- Parise et al. (2006) Parise, B., Ceccarelli, C., Tielens, A. G. G. M., et al. 2006, A&A, 453, 949
- Pauly & Garrod (2016) Pauly T., Garrod R. T., 2016, ApJ, 817, 146
- Persson et al. (2016) Persson, M. V., Harsono, D., Tobin, J. J., et al. 2016, A&A, 590, A33
- Persson et al. (2012) Persson, M. V., Jørgensen, J. K., & van Dishoeck, E. F. 2012, A&A, 541, A39
- Persson et al. (2013) Persson, M. V., Jørgensen, J. K., & van Dishoeck, E. F. 2013, A&A. 549, L3
- Persson et al. (2014) Persson, M. V., Jørgensen, J. K., van Dishoeck, E. & Harsono, D. 2014, ApJ, 563, 74
- Pontoppidan (2006) Pontoppidan, K. M. 2006, A&A, 453, L47
- Pontoppidan et al. (2004) Pontoppidan, K. M., van Dishoeck, E. F., & Dartois, E. 2004, A&A, 426, 925
- Przybilla et al. (2008) Przybilla, N., Nieva, M.-F., & Butler, K. 2008, ApJ, 688, L103
- Remijan et al. (2007) Remijan, A. J., Markwick-Kemper, A., & ALMA Working Group on Spectral Line Frequencies 2007, Bulletin of the American Astronomical Society, 39, 132.11
- Rodgers & Charnley (2002) Rodgers, S. D., & Charnley, S. B. 2002, Planet. Space Sci., 50, 1125
- Rodgers & Charnley (2008) Rodgers, S. D., & Charnley, S. B. 2008, MNRAS, 385, L48
- Rodgers & Millar (1996) Rodgers, S. D., & Millar, T. J. 1996, MNRAS, 280, 1046
- Roueff et al. (2005) Roueff, E., Lis, D. C., van der Tak, F. F. S., Gerin, M., & Goldsmith, P. F. 2005, A&A, 438, 585
- Roueff et al. (2015) Roueff, E., Loison, J. C., & Hickson, K. M. 2015, A&A, 576, A99
- Sewilo et al. (2017) Sewilo, M., Wiseman, J., Indebetouw, R., et al. 2017, arXiv:1709.04856
- Sipilä et al. (2013) Sipilä, O., Caselli, P., & Harju, J. 2013, A&A, 554, A92
- Shah & Wootten (2001) Shah, R. Y. & Wootten, A. 2001, ApJ, 554, 933
- Schöier et al. (2005) Schöier, F. L., van der Tak, F. F. S., van Dishoeck, E. F., & Black, J. H. 2005, A&A, 432, 369
- Schwarz & Bergin (2014) Schwarz, K. R., & Bergin, E. A. 2014, 797, 113
- Taquet et al. (2012) Taquet, V., Ceccarelli, C., & Kahane, C. 2012, ApJ, 748, L3
- Taquet et al. (2014) Taquet, V., Charnley, S. B., Sipilä, O. 2014, ApJ, 791, 1
- Tielens & Hagen (1982) Tielens, A. G. G. M., & Hagen, W. 1982, A&A, 114, 245
- van der Tak et al. (2007) van der Tak, F. F. S., Black, J. H., Sch’́oier, F. L., Jansen, D. J., & van Dishoeck, E. F. 2007, A&A, 468, 627
- Vasyunin & Herbst (2013) Vasyunin, A. I., & Herbst, E. 2013, ApJ, 762, 86
- Viala (1986) Viala, Y. P. 1986, A&AS, 64, 391
- Villanueva et al. (2009) Villanueva, G. L., Mumma, M. J., Bonev, B. P., et al. 2009, ApJ, 690, L5
- Visser et al. (2009) Visser, R., van Dishoeck, E. F., & Black, J. H. 2009, A&A, 503, 323
- Wakelam et al. (2017) Wakelam, V., Loison, J. C., Mereau, R., Ruaud, M. 2017, arXiv:1701.06492
- Wakelam et al. (2013) Wakelam, V., Smith, I. W. M., Loison, J.-C., et al. 2013, arXiv:1310.4350
- Watanabe et al. (2007) Watanabe, N., Mouri, O., Nagaoka, A., Kouchi, A., & Pirronello, V. 2007, ApJ, 668, 1001
- Watanabe & Kouchi (2008) Watanabe, N., & Kouchi, A. 2008, Prog. Surf. Sci., 83, 439
- Whittet (1993) Whittet, D. C. B. 1993, Dust and Chemistry in Astronomy (Bristol and Philadelphia: Institute of Physics Publishing), 9
- Wilson & Rood (1994) Wilson, T. L., & Rood, R. 1994, ARA&A, 32, 191
- Wilson (1999) Wilson, T. L. 1999, Reports on Progress in Physics, 62, 143
- Womack et al. (1992) Womack, M., Ziurys, L. M., & Wyckoff, S. 1992, ApJ, 393, 188