Explainable Prediction of Medical Codes from Clinical Text
Abstract
Clinical notes are text documents that are created by clinicians for each patient encounter. They are typically accompanied by medical codes, which describe the diagnosis and treatment. Annotating these codes is labor intensive and error prone; furthermore, the connection between the codes and the text is not annotated, obscuring the reasons and details behind specific diagnoses and treatments. We present an attentional convolutional network that predicts medical codes from clinical text. Our method aggregates information across the document using a convolutional neural network, and uses an attention mechanism to select the most relevant segments for each of the thousands of possible codes. The method is accurate, achieving precision of 0.71 and a Micro-F1 of 0.54, which are both better than the prior state of the art. Furthermore, through an interpretability evaluation by a physician, we show that the attention mechanism identifies meaningful explanations for each code assignment.
1 Introduction
Clinical notes are free text narratives generated by clinicians during patient encounters. They are typically accompanied by a set of metadata codes from the International Classification of Diseases (ICD), which present a standardized way of indicating diagnoses and procedures that were performed during the encounter. ICD codes have a variety of uses, ranging from billing to predictive modeling of patient state Choi et al. (2016); Ranganath et al. (2015); Denny et al. (2010); Avati et al. (2017). Because manual coding is time-consuming and error-prone, automatic coding has been studied since at least the 1990s de Lima et al. (1998). The task is difficult for two main reasons. First, the label space is very high-dimensional, with over 15,000 codes in the ICD-9 taxonomy, and over 140,000 codes combined in the newer ICD-10-CM and ICD-10-PCS taxonomies World Health Organization (2016). Second, clinical text includes irrelevant information, misspellings and non-standard abbreviations, and a large medical vocabulary. These features combine to make the prediction of ICD codes from clinical notes an especially difficult task, for computers and human coders alike Birman-Deych et al. (2005).
| 934.1: “Foreign body in main bronchus” | |
| CAML (HI) | …line placed bronchoscopy performed showing large mucus plug on the left on transfer to… |
| Cosine Sim | …also needed medication to help your body maintain your blood pressure after receiving iv… |
| CNN | …found to have a large lll lingular pneumonia on chest x ray he was… |
| Logistic Regression | …impression confluent consolidation involving nearly the entire left lung with either bronchocentric or vascular… |
| 442.84: “Aneurysm of other visceral artery” | |
| CAML (I) | …and gelfoam embolization of right hepatic artery branch pseudoaneurysm coil embolization of the gastroduodenal… |
| Cosine Sim | …coil embolization of the gastroduodenal artery history of present illness the pt is a… |
| CNN | …foley for hemodynamic monitoring and serial hematocrits angio was performed and his gda was… |
| Logistic Regression (I) | …and gelfoam embolization of right hepatic artery branch pseudoaneurysm coil embolization of the gastroduodenal… |
| 428.20: “Systolic heart failure, unspecified” | |
| CAML | …no mitral valve prolapse moderate to severe mitral regurgitation is seen the tricuspid valve… |
| Cosine Sim | …is seen the estimated pulmonary artery systolic pressure is normal there is no pericardial… |
| CNN | …and suggested starting hydralazine imdur continue aspirin arg admitted at baseline cr appears patient… |
| Logistic Regression (HI) | …anticoagulation monitored on tele pump systolic dysfunction with ef of seen on recent echo… |
In this application paper, we develop convolutional neural network (CNN)-based methods for automatic ICD code assignment based on text discharge summaries from intensive care unit (ICU) stays. To better adapt to the multi-label setting, we employ a per-label attention mechanism, which allows our model to learn distinct document representations for each label. We call our method Convolutional Attention for Multi-Label classification (CAML). Our model design is motivated by the conjecture that important information correlated with a code’s presence may be contained in short snippets of text which could be anywhere in the document, and that these snippets likely differ for different labels. To cope with the large label space, we exploit the textual descriptions of each code to guide our model towards appropriate parameters: in the absence of many labeled examples for a given code, its parameters should be similar to those of codes with similar textual descriptions.
We evaluate our approach on two versions of MIMIC Johnson et al. (2016), an open dataset of ICU medical records. Each record includes a variety of narrative notes describing a patient’s stay, including diagnoses and procedures. Our approach substantially outperforms previous results on medical code prediction on both MIMIC-II and MIMIC-III datasets.
We consider applications of this work in a decision support setting. Interpretability is important for any decision support system, especially in the medical domain. The system should be able to explain why it predicted each code; even if the codes are manually annotated, it is desirable to explain what parts of the text are most relevant to each code. These considerations further motivate our per-label attention mechanism, which assigns importance values to -grams in the input document, and which can therefore provide explanations for each code, in the form of extracted snippets of text from the input document. We perform a human evaluation of the quality of the explanations provided by the attention mechanism, asking a physician to rate the informativeness of a set of automatically generated explanations.111Our code, data splits, and pre-trained models are available at github.com/jamesmullenbach/caml-mimic.
2 Method
We treat ICD-9 code prediction as a multilabel text classification problem McCallum (1999).222We focus on codes from the ICD-9 taxonomy, rather than the more recent ICD-10, for the simple reason that this is the version of ICD used in the MIMIC datasets. Let represent the set of ICD-9 codes; the labeling problem for instance is to determine for all . We train a neural network which passes text through a convolutional layer to compute a base representation of the text of each document Kim (2014), and makes binary classification decisions. Rather than aggregating across this representation with a pooling operation, we apply an attention mechanism to select the parts of the document that are most relevant for each possible code. These attention weights are then applied to the base representation, and the result is passed through an output layer, using a sigmoid transformation to compute the likelihood of each code. We employ a regularizer to encourage each code’s parameters to be similar to those of codes with similar textual descriptions. We now describe each of these elements in more detail.
2.1 Convolutional architecture
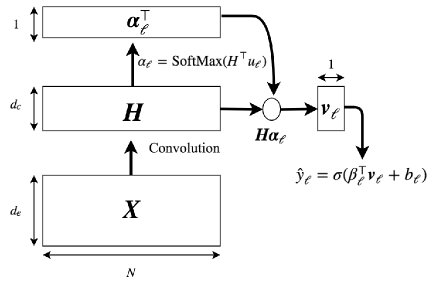
At the base layer of the model, we have -dimensional pre-trained embeddings for each word in the document, which are horizontally concatenated into the matrix , where is the length of the document. Adjacent word embeddings are combined using a convolutional filter , where is the filter width, the size of the input embedding, and the size of the filter output. At each step , we compute
| (1) |
where denotes the convolution operator, is an element-wise nonlinear transformation, and is the bias. We additionally pad each side of the input with zeros so that the resulting matrix has dimension .
2.2 Attention
After convolution, the document is represented by the matrix . It is typical to reduce this matrix to a vector by applying pooling across the length of document, by selecting the maximum or average value at each row (Kim, 2014). However, our goal is to assign multiple labels (i.e., medical codes) for each document, and different parts of the base representation may be relevant for different labels. For this reason, we apply a per-label attention mechanism. An additional benefit is that it selects the -grams from the text that are most relevant to each predicted label.
Formally, for each label , we compute the matrix-vector product, , where is a vector parameter for label . We then pass the resulting vector through a softmax operator, obtaining a distribution over locations in the document,
| (2) |
where , and is the element-wise exponentiation of the vector . The attention vector is then used to compute vector representations for each label,
| (3) |
As a baseline model, we instead use max-pooling to compute a single vector for all labels,
| (4) |
2.3 Classification
Given the vector document representation , we compute a probability for label using another linear layer and a sigmoid transformation:
| (5) |
where is a vector of prediction weights, and is a scalar offset. The overall model is illustrated in Figure 1.
2.4 Training
The training procedure minimizes the binary cross-entropy loss,
| (6) | ||||
plus the L2 norm of the model weights, using the Adam optimizer Kingma and Ba (2015).
2.5 Embedding label descriptions
Due to the dimensionality of the label space, many codes are rarely observed in the labeled data. To improve performance on these codes, we use text descriptions of each code from the World Health Organization (2016). Examples can be found in Table 1, next to the code numbers. We use these descriptions to build a secondary module in our network that learns to embed them as vectors. These vectors are then used as the target of regularization on the model parameters . If code is rarely observed in the training data, this regularizer will encourage its parameters to be similar to those of other codes with similar descriptions.
The code embedding module consists of a max-pooling CNN architecture. Let be a max-pooled vector, obtained by passing the description for code into the module. Let be the number of true labels in a training example. We add the following regularizing objective to our loss ,
| (7) |
where is a tradeoff hyperparameter that calibrates the performance of the two objectives. We call this model variant Description Regularized-CAML (DR-CAML).
3 Evaluation of code prediction
This section evaluates the accuracy of code prediction, comparing our models against several competitive baselines.
3.1 Datasets
| MIMIC-III full | MIMIC-III 50 | MIMIC-II full | |
| # training documents | 47,724 | 8,067 | 20,533 |
| Vocabulary size | 51,917 | 51,917 | 30,688 |
| Mean # tokens per document | 1,485 | 1,530 | 1,138 |
| Mean # labels per document | 15.9 | 5.7 | 9.2 |
| Total # labels | 8,922 | 50 | 5,031 |
MIMIC-III Johnson et al. (2016) is an open-access dataset of text and structured records from a hospital ICU. Following previous work, we focus on discharge summaries, which condense information about a stay into a single document. In MIMIC-III, some admissions have addenda to their summary, which we concatenate to form one document.
Each admission is tagged by human coders with a set of ICD-9 codes, describing both diagnoses and procedures which occurred during the patient’s stay. There are 8,921 unique ICD-9 codes present in our datasets, including 6,918 diagnosis codes and 2,003 procedure codes. Some patients have multiple admissions and therefore multiple discharge summaries; we split the data by patient ID, so that no patient appears in both the training and test sets.
In this full-label setting, we use a set of 47,724 discharge summaries from 36,998 patients for training, with 1,632 summaries and 3,372 summaries for validation and testing, respectively.
Secondary evaluations
For comparison with prior work, we also follow Shi et al. (2017) and train and evaluate on a label set consisting of the 50 most frequent labels. In this setting, we filter each dataset down to the instances that have at least one of the top 50 most frequent codes, and subset the training data to equal the size of the training set of Shi et al. (2017), resulting in 8,067 summaries for training, 1,574 for validation, and 1,730 for testing.
We also run experiments with the MIMIC-II dataset, to compare with prior work by Baumel et al. (2018) and Perotte et al. (2013). We use the train/test split of Perotte et al. (2013), which consists of 20,533 training examples and 2,282 testing examples. Detailed statistics for the three settings are summarized in Table 2.
Preprocessing
We remove tokens that contain no alphabetic characters (e.g., removing “500” but keeping “250mg”), lowercase all tokens, and replace tokens that appear in fewer than three training documents with an ‘UNK’ token. We pretrain word embeddings of size using the word2vec CBOW method Mikolov et al. (2013) on the preprocessed text from all discharge summaries. All documents are truncated to a maximum length of 2500 tokens.
3.2 Systems
We compare against the following baselines:
-
•
a single-layer one-dimensional convolutional neural network Kim (2014);
-
•
a bag-of-words logistic regression model;
-
•
a bidirectional gated recurrent unit (Bi-GRU).333Our pilot experiments found that GRU was stronger than long short-term memory (LSTM) for this task.
For the CNN and Bi-GRU, we initialize the embedding weights using the same pretrained word2vec vectors that we use for the CAML models. All neural models are implemented using PyTorch444https://github.com/pytorch/pytorch. The logistic regression model consists of binary one-vs-rest classifiers acting on unigram bag-of-words features for all labels present in the training data. If a label is not present in the training data, the model will never predict it in the held-out data.
Parameter tuning
We tune the hyperparameters of the CAML model and the neural baselines using the Spearmint Bayesian optimization package (Snoek et al., 2012; Swersky et al., 2013).555https://github.com/HIPS/Spearmint We allow Spearmint to sample parameter values for the L2 penalty on the model weights and learning rate , as well as filter size , number of filters , and dropout probability for the convolutional models, and number of hidden layers of dimension for the Bi-GRU, using precision on the MIMIC-III full-label validation set as the performance measure. We use these parameters for DR-CAML as well, and port the optimized parameters to the MIMIC-II full-label and MIMIC-III 50-label models, and manually fine-tune the learning rate in these settings. We select for DR-CAML based on pilot experiments on the validation sets. Hyperparameter tuning is summarized in Table 3. Convolutional models are trained with dropout after the embedding layer. We use a fixed batch size of 16 for all models and datasets. Models are trained with early stopping on the validation set; training terminates after the precision@8 does not improve for 10 epochs, and the model at the time of the highest precision@8 is used on the test set.
| Range | CAML | CNN | Bi-GRU | |
| 50-500 | 50 | 500 | – | |
| 2-10 | 10 | 4 | – | |
| 0.2-0.8 | 0.2 | 0.2 | – | |
| 0, 0.001, 0.01, 0.1 | 0 | 0 | 0 | |
| 0.0001, 0.0003, 0.001, 0.003 | 0.0001 | 0.003 | 0.003 | |
| 1-4 | – | – | 1 | |
| 32-512 | – | – | 512 |
3.3 Evaluation Metrics
To facilitate comparison with both future and prior work, we report a variety of metrics, focusing on the micro-averaged and macro-averaged F1 and area under the ROC curve (AUC). Micro-averaged values are calculated by treating each (text, code) pair as a separate prediction. Macro-averaged values, while less frequently reported in the multi-label classification literature, are calculated by averaging metrics computed per-label. For recall, the metrics are distinguished as follows:
| (8) | ||||
| (9) |
where TP denotes true positive examples and FN denotes false negative examples. Precision is computed analogously. The macro-averaged metrics place much more emphasis on rare label prediction.
We also report precision at (denoted as ‘P@n’), which is the fraction of the highest-scored labels that are present in the ground truth. This is motivated by the potential use case as a decision support application, in which a user is presented with a fixed number of predicted codes to review. In such a case, it is more suitable to select a model with high precision than high recall. We choose and to compare with prior work Vani et al. (2017); Prakash et al. (2017). For the MIMIC-III full label setting, we also compute precision@15, which roughly corresponds to the average number of codes in MIMIC-III discharge summaries (Table 2).
| AUC | F1 | P@n | ||||||
| Model | Macro | Micro | Macro | Micro | Diag | Proc | 8 | 15 |
| Scheurwegs et. al Scheurwegs et al. (2017) | – | – | – | – | 0.428 | 0.555 | – | – |
| Logistic Regression | 0.561 | 0.937 | 0.011 | 0.272 | 0.242 | 0.398 | 0.542 | 0.411 |
| CNN | 0.806 | 0.969 | 0.042 | 0.419 | 0.402 | 0.491 | 0.581 | 0.443 |
| Bi-GRU | 0.822 | 0.971 | 0.038 | 0.417 | 0.393 | 0.514 | 0.585 | 0.445 |
| CAML | 0.895 | 0.986* | 0.088 | 0.539* | 0.524* | 0.609* | 0.709* | 0.561* |
| DR-CAML | 0.897 | 0.985 | 0.086 | 0.529 | 0.515 | 0.595 | 0.690 | 0.548 |
3.4 Results
Our main quantitative evaluation involves predicting the full set of ICD-9 codes based on the text of the MIMIC-III discharge summaries. These results are shown in Table 4. The CAML model gives the strongest results on all metrics. Attention yields substantial improvements over the “vanilla” convolutional neural network (CNN). The recurrent Bi-GRU architecture is comparable to the vanilla CNN, and the logistic regression baseline is substantially worse than all neural architectures. The best-performing CNN model has 9.86M tunable parameters, compared with 6.14M tunable parameters for CAML. This is due to the hyperparameter search preferring a larger number of filters for the CNN. Finally, we observe that the DR-CAML performs worse on most metrics than CAML, with a tuned regularization coefficient of .
Among prior work, only Scheurwegs et al. (2017) evaluate on the full ICD-9 code set for MIMIC-III. Their reported results distinguished between diagnosis codes and procedure codes. The CAML models are stronger on both sets. Additionally, our method does not make use of any external information or structured data, while Scheurwegs et al. use structured data and various medical ontologies in their text representation.
We feel that precision@8 is the most informative of the metrics, as it measures the ability of the system to return a small high-confidence subset of codes. Even with a space of thousands of labels, our models achieve relatively high precision: of the eight most confident predictions, on average 5.5 are correct. It is also apparent how difficult it is to achieve high Macro-F1 scores, due to the metric’s emphasis on rare-label performance. To put these results in context, a hypothetical system that performs perfectly on the 500 most common labels, and ignores all others, would achieve a Macro-F1 of 0.052 and a Micro-F1 of 0.842.
Secondary evaluations
To compare with prior published work, we also evaluate on the 50 most common codes in MIMIC-III (Table 5), and on MIMIC-II (Table 6). We report DR-CAML results on the 50-label setting of MIMIC-III with , and on MIMIC-II with , which were determined by grid search on a validation set. The other hyperparameters were left at the settings for the main MIMIC-III evaluation, as described in Table 3. In the 50-label setting of MIMIC-III, we see strong improvement over prior work in all reported metrics, as well as against the baselines, with the exception of precision@5, on which the CNN baseline performs best. We hypothesize that this is because the relatively large value of for CAML leads to a larger network that is more suited to larger datasets; tuning CAML’s hyperparameters on this dataset would be expected to improve performance on all metrics. Baumel et al. (2018) additionally report a micro-F1 score of 0.407 by training on MIMIC-III, and evaluating on MIMIC-II. Our model achieves better performance using only the (smaller) MIMIC-II training set, leaving this alternative training protocol for future work.
| AUC | F1 | ||||
| Model | Macro | Micro | Macro | Micro | P@5 |
| C-MemNN Prakash et al. (2017) | 0.833 | – | – | – | 0.42 |
| Shi et al. (2017) | – | 0.900 | – | 0.532 | – |
| Logistic Regression | 0.829 | 0.864 | 0.477 | 0.533 | 0.546 |
| CNN | 0.876 | 0.907 | 0.576* | 0.625 | 0.620 |
| Bi-GRU | 0.828 | 0.868 | 0.484 | 0.549 | 0.591 |
| CAML | 0.875 | 0.909 | 0.532 | 0.614 | 0.609 |
| DR-CAML | 0.884* | 0.916 | 0.576* | 0.633 | 0.618 |
4 Evaluation of Interpretability
We now evaluate the explanations generated by CAML’s attention mechanism, in comparison with three alternative heuristics. A physician was presented with explanations from four methods, using a random sample of 100 predicted codes from the MIMIC-III full-label test set. The most important -gram from each method was extracted, along with a window of five words on either side for context. We select in this setting to emulate a span of attention over words likely to be given by a human reader. Examples can be found in Table 1. Observe that the snippets may overlap in multiple words. We prompted the evaluator to select all text snippets which he felt adequately explained the presence of a given code, provided the code and its description, with the option to distinguish snippets as “highly informative” should they be found particularly informative over others.
4.1 Extracting informative text snippets
CAML
The attention mechanism allows us to extract -grams from the text that are most influential in the prediction of each label, by taking the argmax of the SoftMax output .
Max-pooling CNN
We select the -grams that provide the maximum value selected by max-pooling at least once and weighting by the final layer weights. Defining an argmax vector which results from the max-pooling step as
| (10) |
we can compute the importance of position for label ,
| (11) |
We then select the most important -gram for a given label as .
Logistic regression
The informativeness of each -gram with respect to label is scored by the sum of the coefficients of the weight matrix for , over the words in the -gram. The top-scoring -gram is then returned as the explanation.
Code descriptions
Finally, we calculate a word similarity metric between each stemmed -gram and the stemmed ICD-9 code description. We compute the idf-weighted cosine similarity, with idf weights calculated on the corpus consisting of all notes and relevant code descriptions. We then select the argmax over -grams in the document, breaking ties by selecting the first occurrence. We remove those note-label pairs for which no -gram has a score greater than 0, which gives an “unfair” advantage to this baseline.
4.2 Results
The results of the interpretability evaluation are presented in Table 7. Our model selects the greatest number of “highly informative” explanations, and selects more “informative” explanations than both the CNN baseline and the logistic regression model. While the cosine similarity metric also performs well, the examples in Table 1 demonstrate the strengths of CAML in extracting text snippets in line with more intuitive explanations for the presence of a code. As noted above, there exist some cases, which we exclude, where the cosine similarity method is unable to provide any explanation, because no -grams in a note have a non-zero similarity for a given label description. This occurs for about 12 of all note-label pairs in the test set.
| AUC | F1 | ||||
| Model | Macro | Micro | Macro | Micro | P@8 |
| Flat SVM Perotte et al. (2013) | – | – | – | 0.293 | – |
| HA-GRU Baumel et al. (2018) | – | – | – | 0.366 | – |
| Logistic Regression | 0.690 | 0.934 | 0.025 | 0.314 | 0.425 |
| CNN | 0.742 | 0.941 | 0.030 | 0.332 | 0.388 |
| Bi-GRU | 0.780 | 0.954 | 0.024 | 0.359 | 0.420 |
| CAML | 0.820 | 0.966* | 0.048 | 0.442 | 0.523* |
| DR-CAML | 0.826 | 0.966* | 0.049 | 0.457* | 0.515 |
| Highly | ||
| Method | Informative | informative |
| CAML | 46 | 22 |
| Code Descriptions | 48 | 20 |
| Logistic Regression | 41 | 18 |
| CNN | 36 | 13 |
5 Related Work
Attentional Convolution for NLP
CNNs have been successfully applied to tasks such as sentiment classification Kim (2014) and language modeling Dauphin et al. (2017). Our work combines convolution with attention Bahdanau et al. (2015); Yang et al. (2016) to select the most relevant parts of the discharge summary. Other recent work has combined convolution and attention (e.g., Allamanis et al., 2016; Yin et al., 2016; dos Santos et al., 2016; Yin and Schütze, 2017). Our attention mechanism is most similar to those of Yang et al. (2016) and Allamanis et al. (2016), in that we use context vectors to compute attention over specific locations in the text. Our work differs in that we compute separate attention weights for each label in our label space, which is better tuned to our goal of selecting locations in a document which are most important for predicting specific labels.
Automatic ICD coding
ICD coding is a long-standing task in the medical informatics community, which has been approached with machine learning and handcrafted methods Scheurwegs et al. (2015). Many recent approaches, like ours, use unstructured text data as the only source of information (e.g., Kavuluru et al., 2015; Subotin and Davis, 2014), though some incorporates structured data as well (e.g., Scheurwegs et al., 2017; Wang et al., 2016). Most previous methods have either evaluated only on a strict subset of the full ICD label space Wang et al. (2016), relied on datasets that focus on a subset of medical scenarios Zhang et al. (2017), or evaluated on data that are not publicly available, making direct comparison difficult Subotin and Davis (2016). A recent shared task for ICD-10 coding focused on coding of death certificates in English and French Névéol et al. (2017). This dataset also contains shorter documents than those we consider, with an average of 18 tokens per certificate in the French corpus. We use the open-access MIMIC datasets containing de-identified, general-purpose records of intensive care unit stays at a single hospital.
Perotte et al. (2013) use “flat” and “hierarchical” SVMs; the former treats each code as an individual prediction, while the latter trains on child codes only if the parent code is present, and predicts on child codes only if the parent code was positively predicted. Scheurwegs et al. (2017) use a feature selection approach to ICD-9 and ICD-10 classification, incorporating structured and unstructured text information from EHRs. They evaluate over various medical specialties and on the MIMIC-III dataset. We compare directly to their results on the full label set of MIMIC-III.
Other recent approaches have employed neural network architectures. Baumel et al. (2018) apply recurrent networks with hierarchical sentence and word attention (the HA-GRU) to classify ICD9 diagnosis codes while providing insights into the model decision process. Similarly, Shi et al. (2017) applied character-aware LSTMs to generate sentence representations from specific subsections of discharge summaries, and apply attention to form a soft matching between the representations and the top 50 codes. Prakash et al. (2017) use memory networks that draw from discharge summaries as well as Wikipedia, to predict top-50 and top-100 codes. Another recent neural architecture is the Grounded Recurrent Neural Network Vani et al. (2017), which employs a modified GRU with dimensions dedicated to predicting the presence of individual labels. We compare directly with published results from all of these papers, except Vani et al. (2017), who evaluate on only a 5000 code subset of ICD-9. Empirically, the CAML architecture proposed in this paper yields stronger results across all experimental conditions. We attribute these improvements to the attention mechanism, which focuses on the most critical features for each code, rather than applying a uniform pooling operation for all codes. We also observed that convolution-based models are at least as effective, and significantly more computationally efficient, than recurrent neural networks such as the Bi-GRU.
Explainable text classification
A goal of this work is that the code predictions be explainable from features of the text. Prior work has also emphasized explainability. Lei et al. (2016) model “rationales” through a latent variable, which tags each word as relevant to the document label. Li et al. (2016) compute the salience of individual words by the derivative of the label score with respect to the word embedding. Ribeiro et al. (2016) use submodular optimization to select a subset of features that closely approximate a specific classification decision (this work is also notable for extensive human evaluations). In comparison to these approaches, we employ a relatively simple attentional architecture; this simplicity is motivated by the challenge of scaling to multi-label classification with thousands of possible labels. Other prior work has emphasized the use of attention for highlighting salient features of the text (e.g., Rush et al., 2015; Rocktäschel et al., 2016), although these papers did not perform human evaluations of the interpretability of the features selected by the attention mechanism.
6 Conclusions and Future Work
We present CAML, a convolutional neural network for multi-label document classification, which employs an attention mechanism to adaptively pool the convolution output for each label, learning to identify highly-predictive locations for each label. CAML yields strong improvements over previous metrics on several formulations of the ICD-9 code prediction task, while providing satisfactory explanations for its predictions. Although we focus on a clinical setting, CAML is extensible without modification to other multi-label document tagging tasks, including ICD-10 coding. We see a number of directions for future work. From the linguistic side, we plan to integrate the document structure of discharge summaries in MIMIC-III, and to better handle non-standard writing and other sources of out-of-vocabulary tokens. From the application perspective, we plan to build models that leverage hierarchy of ICD codes Choi et al. (2016), and to attempt the more difficult task of predicting diagnosis and treatment codes for future visits from discharge summaries.
Acknowledgments
Helpful feedback was provided by the anonymous reviewers, and by the members of the Georgia Tech Computational Linguistics lab. The project was partially supported by project HDTRA1-15-1-0019 from the Defense Threat Reduction Agency, by the National Science Foundation under awards IIS-1418511 and CCF-1533768, by the National Institutes of Health under awards 1R01MD011682-01 and R56HL138415, by Children’s Healthcare of Atlanta, and by UCB.
References
- Allamanis et al. (2016) Miltiadis Allamanis, Hao Peng, and Charles Sutton. 2016. A convolutional attention network for extreme summarization of source code. In International Conference on Machine Learning. pages 2091–2100.
- Avati et al. (2017) Anand Avati, Kenneth Jung, Stephanie Harman, Lance Downing, Andrew Ng, and Nigam H. Shah. 2017. Improving palliative care with deep learning. arXiv preprint arXiv:1711.06402 .
- Bahdanau et al. (2015) Dzmitry Bahdanau, Kyunghyun Cho, and Yoshua Bengio. 2015. Neural machine translation by jointly learning to align and translate. In International Conference on Learning Representations.
- Baumel et al. (2018) Tal Baumel, Jumana Nassour-Kassis, Michael Elhadad, and Noémie Elhadad. 2018. Multi-label classification of patient notes a case study on ICD code assignment. In AAAI Workshop on Health Intelligence.
- Birman-Deych et al. (2005) Elena Birman-Deych, Amy D. Waterman, Yan Yan, David S. Nilasena, Martha J. Radford, and Brian F Gage. 2005. Accuracy of ICD-9-CM codes for identifying cardiovascular and stroke risk factors. Medical care 43(5):480–485.
- Choi et al. (2016) Edward Choi, Mohammad Taha Bahadori, Andy Schuetz, Walter F Stewart, and Jimeng Sun. 2016. Doctor AI: Predicting clinical events via recurrent neural networks. In Machine Learning for Healthcare Conference. pages 301–318.
- Dauphin et al. (2017) Yann N. Dauphin, Angela Fan, Michael Auli, and David Grangier. 2017. Language modeling with gated convolutional networks. In Proceedings of the 34th International Conference on Machine Learning. pages 933–941. http://proceedings.mlr.press/v70/dauphin17a.html.
- de Lima et al. (1998) Luciano R.S. de Lima, Alberto H.F. Laender, and Berthier A. Ribeiro-Neto. 1998. A hierarchical approach to the automatic categorization of medical documents. In Proceedings of the seventh international conference on Information and knowledge management. ACM, pages 132–139.
- Denny et al. (2010) Joshua C. Denny, Marylyn D. Ritchie, Melissa A. Basford, Jill M. Pulley, Lisa Bastarache, Kristin Brown-Gentry, Deede Wang, Dan R. Masys, Dan M. Roden, and Dana C. Crawford. 2010. PheWAS: demonstrating the feasibility of a phenome-wide scan to discover gene–disease associations. Bioinformatics 26(9):1205–1210.
- dos Santos et al. (2016) Cıcero Nogueira dos Santos, Ming Tan, Bing Xiang, and Bowen Zhou. 2016. Attentive pooling networks. CoRR, abs/1602.03609 .
- Johnson et al. (2016) Alistair E.W. Johnson, Tom J. Pollard, Lu Shen, Li-wei H. Lehman, Mengling Feng, Mohammad Ghassemi, Benjamin Moody, Peter Szolovits, Leo Anthony Celi, and Roger G. Mark. 2016. MIMIC-III, a freely accessible critical care database. Scientific data 3.
- Kavuluru et al. (2015) Ramakanth Kavuluru, Anthony Rios, and Yuan Lu. 2015. An empirical evaluation of supervised learning approaches in assigning diagnosis codes to electronic medical records. Artificial intelligence in medicine 65(2):155–166.
- Kim (2014) Yoon Kim. 2014. Convolutional neural networks for sentence classification. In Proceedings of the 2017 Conference on Empirical Methods in Natural Language Processing. pages 1746–1751.
- Kingma and Ba (2015) Diederik Kingma and Jimmy Ba. 2015. Adam: A method for stochastic optimization. In International Conference on Learning Representations.
- Lei et al. (2016) Tao Lei, Regina Barzilay, and Tommi Jaakkola. 2016. Rationalizing neural predictions. In Proceedings of the 2016 Conference on Empirical Methods in Natural Language Processing. Association for Computational Linguistics, Austin, Texas, pages 107–117. https://aclweb.org/anthology/D16-1011.
- Li et al. (2016) Jiwei Li, Xinlei Chen, Eduard Hovy, and Dan Jurafsky. 2016. Visualizing and understanding neural models in NLP. In Proceedings of the 2016 Conference of the North American Chapter of the Association for Computational Linguistics: Human Language Technologies. Association for Computational Linguistics, San Diego, California, pages 681–691. http://www.aclweb.org/anthology/N16-1082.
- McCallum (1999) Andrew McCallum. 1999. Multi-label text classification with a mixture model trained by EM. In AAAI workshop on Text Learning. pages 1–7.
- Mikolov et al. (2013) Tomas Mikolov, Ilya Sutskever, Kai Chen, Greg S Corrado, and Jeff Dean. 2013. Distributed representations of words and phrases and their compositionality. In Advances in neural information processing systems. pages 3111–3119.
- Névéol et al. (2017) Aurélie Névéol, Robert N Anderson, K Bretonnel Cohen, Cyril Grouin, Thomas Lavergne, Grégoire Rey, Aude Robert, Claire Rondet, and Pierre Zweigenbaum. 2017. CLEF ehealth 2017 multilingual information extraction task overview: ICD10 coding of death certificates in english and french. In CLEF 2017 Evaluation Labs and Workshop: Online Working Notes, CEUR-WS. page 17.
- Perotte et al. (2013) Adler Perotte, Rimma Pivovarov, Karthik Natarajan, Nicole Weiskopf, Frank Wood, and Noémie Elhadad. 2013. Diagnosis code assignment: models and evaluation metrics. Journal of the American Medical Informatics Association 21(2):231–237.
- Prakash et al. (2017) Aaditya Prakash, Siyuan Zhao, Sadid A Hasan, Vivek V Datla, Kathy Lee, Ashequl Qadir, Joey Liu, and Oladimeji Farri. 2017. Condensed memory networks for clinical diagnostic inferencing. In Proceedings of the Thirty-First AAAI Conference on Artificial Intelligence. pages 3274–3280.
- Ranganath et al. (2015) Rajesh Ranganath, Adler J. Perotte, Noémie Elhadad, and David M. Blei. 2015. The survival filter: Joint survival analysis with a latent time series. In UAI. pages 742–751.
- Ribeiro et al. (2016) Marco Tulio Ribeiro, Sameer Singh, and Carlos Guestrin. 2016. Why should i trust you?: Explaining the predictions of any classifier. In Proceedings of the 22nd ACM SIGKDD International Conference on Knowledge Discovery and Data Mining. ACM, pages 1135–1144.
- Rocktäschel et al. (2016) Tim Rocktäschel, Edward Grefenstette, Karl Moritz Hermann, Tomáš Kočiskỳ, and Phil Blunsom. 2016. Reasoning about entailment with neural attention. In International Conference on Learning Representations.
- Rush et al. (2015) Alexander M. Rush, Sumit Chopra, and Jason Weston. 2015. A neural attention model for abstractive sentence summarization. In Proceedings of the 2015 Conference on Empirical Methods in Natural Language Processing. Association for Computational Linguistics, Lisbon, Portugal, pages 379–389. http://aclweb.org/anthology/D15-1044.
- Scheurwegs et al. (2017) Elyne Scheurwegs, Boris Cule, Kim Luyckx, Léon Luyten, and Walter Daelemans. 2017. Selecting relevant features from the electronic health record for clinical code prediction. Journal of Biomedical Informatics 74:92–103.
- Scheurwegs et al. (2015) Elyne Scheurwegs, Kim Luyckx, Léon Luyten, Walter Daelemans, and Tim Van den Bulcke. 2015. Data integration of structured and unstructured sources for assigning clinical codes to patient stays. Journal of the American Medical Informatics Association 23(e1):e11–e19.
- Shi et al. (2017) Haoran Shi, Pengtao Xie, Zhiting Hu, Ming Zhang, and Eric P Xing. 2017. Towards automated ICD coding using deep learning. arXiv preprint arXiv:1711.04075 .
- Snoek et al. (2012) Jasper Snoek, Hugo Larochelle, and Ryan P Adams. 2012. Practical bayesian optimization of machine learning algorithms. In F. Pereira, C. J. C. Burges, L. Bottou, and K. Q. Weinberger, editors, Advances in Neural Information Processing Systems 25, Curran Associates, Inc., pages 2951–2959.
- Subotin and Davis (2014) Michael Subotin and Anthony R. Davis. 2014. A system for predicting ICD-10-PCS codes from electronic health records. In Proceedings of the 2014 Workshop on Biomedical Natural Language Processing.
- Subotin and Davis (2016) Michael Subotin and Anthony R. Davis. 2016. A method for modeling co-occurrence propensity of clinical codes with application to ICD-10-PCS auto-coding. Journal of the American Medical Informatics Association 23(5):866–871.
- Swersky et al. (2013) Kevin Swersky, Jasper Snoek, and Ryan P Adams. 2013. Multi-task bayesian optimization. In C. J. C. Burges, L. Bottou, M. Welling, Z. Ghahramani, and K. Q. Weinberger, editors, Advances in Neural Information Processing Systems 26, Curran Associates, Inc., pages 2004–2012.
- Vani et al. (2017) Ankit Vani, Yacine Jernite, and David Sontag. 2017. Grounded recurrent neural networks. arXiv preprint arXiv:1705.08557 .
- Wang et al. (2016) Sen Wang, Xiaojun Chang, Xue Li, Guodong Long, Lina Yao, and Quan Z Sheng. 2016. Diagnosis code assignment using sparsity-based disease correlation embedding. IEEE Transactions on Knowledge and Data Engineering 28(12):3191–3202.
- World Health Organization (2016) World Health Organization. 2016. International statistical classification of diseases and related health problems 10th revision. http://apps.who.int/classifications/icd10/browse/2016/en.
- Yang et al. (2016) Zichao Yang, Diyi Yang, Chris Dyer, Xiaodong He, Alexander J. Smola, and Eduard H. Hovy. 2016. Hierarchical attention networks for document classification. In Proceedings of the 2016 Conference of the North American Chapter of the Association for Computational Linguistics: Human Language Technologies. Association for Computational Linguistics, San Diego, California, pages 1480–1489.
- Yin and Schütze (2017) Wenpeng Yin and Hinrich Schütze. 2017. Attentive convolution. arXiv preprint arXiv:1710.00519 .
- Yin et al. (2016) Wenpeng Yin, Hinrich Schütze, Bing Xiang, and Bowen Zhou. 2016. ABCNN: Attention-based convolutional neural network for modeling sentence pairs. Transactions of the Association for Computational Linguistics 4:259–272.
- Zhang et al. (2017) Danchen Zhang, Daqing He, Sanqiang Zhao, and Lei Li. 2017. Enhancing automatic ICD-9-CM code assignment for medical texts with pubmed. BioNLP 2017 pages 263–271.