Direct Measurement of Coating Thermal Noise in Optical Resonators
Abstract
The best measurements of space and time currently possible (e.g. gravitational wave detectors and optical reference cavities) rely on optical resonators, and are ultimately limited by thermally induced fluctuations in the reflective coatings which form the resonator. We present measurements of coating thermal noise in the audio band and show that for a standard ion beam sputtered coating, the power spectrum of the noise does not have the expected power-law behavior.
pacs:
04.80.Nn, 06.30.-k, 05.40.Jc, 07.60.-jI Introduction
High-reflectivity mirrors play an important role in precision optical experiments such as gravitational-wave detectors Harry et al. (2007); Evans et al. (2008), frequency references Ludlow et al. (2007); Kessler et al. (2012), and macroscopic quantum measurements Abbott et al. (2009); Poot and van der Zant (2012). These mirrors depend on multilayer coatings which are deposited with either physical methods (sputtering, pulse laser deposition, molecular beam epitaxy) or chemical methods (vapor deposition). While the coating is critical to the optical measurement, Brownian motion in coatings can present a limiting noise source due to nonzero mechanical dissipation in the deposited layers.
Ion beam sputtering (IBS) for amorphous coatings and molecular beam epitaxy for crystalline coatings currently produce the lowest mechanical loss Cole et al. (2016). Further reductions in coating thermal noise (CTN), while maintaining high optical quality (low absorption and scatter, high uniformity), are of great interest for many experiments (e.g., future gravitational-wave detectors The LIGO Scientific Collaboration and Harms (2017); Miller et al. (2015); Punturo et al. (2010)).
The CTN level of candidate coating materials is most frequently estimated using measurements of their mechanical properties: mechanical quality factors, Young’s modulus, and Poisson ratio. The techniques used to measure these parameters include, among others, suspended disks Crooks et al. (2002); Harry et al. (2002), clamped cantilevers Pierro and Pinto (2006), and the gentle nodal suspension Cesarini et al. (2009). The level of CTN is then calculated from the measured parameters, although uncertainties in their values can produce significant uncertainty in the CTN estimate. Moreover, this approach may not capture all the phenomena involved in a multilayer coating. A direct measurement of the thermal noise of a multilayer coating is thus an important complement to the above approach.
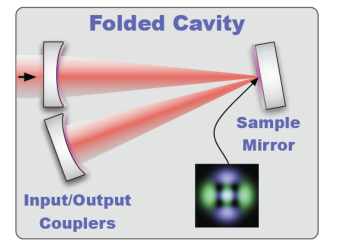
In reference Gras et al. (2017) we introduced a novel technique that directly measures the CTN of a high-reflectivity mirror. The technique uses a Fabry-Perot cavity in which three transverse electromagnetic (TEM), Hermite-Gaussian modes co-resonate: TEM00, TEM02 and TEM20. These modes probe different areas of the sample coating, and CTN appears as a fluctuation in the resonant frequency difference of the two higher-order modes (see Fig. 1). In this article we present an improved version of this experiment which can measure CTN with much higher signal-to-noise ratio and provide new information on the frequency dependence of CTN.
II Experimental Setup
At the core of the experiment is a 3-mirror folded cavity, with the sample to be measured as the folding mirror (see Fig. 1). The cavity is mounted on a vibrationally isolated platform in a vacuum chamber ( Torr). This folded configuration is ideal for rapid testing of high reflectivity coatings, and accepts the witness flats commonly included in coating runs.
| Parameter | Symbol | TEM02 | TEM20 |
|---|---|---|---|
| Intra-cavity power, W | 2 | 2 | |
| Finesse | 15.06 k | 15.30 k | |
| Mode frequency, MHz | 2762 | 2802 | |
| Beam size, m | 54 | 54 | |
| RoC (effective), mm | R | 50.7 | 50.8 |
| Laser wavelength, nm | 1064 | ||
| Cavity length, mm | L | ||
| Folding angle, deg | 17.23 | ||
The cavity is near-concentric, with a total length of and input and output couplers radii of curvature of . This produces a waist and transverse mode spacing of:
| (1) |
where , is the laser wavelength, and is the speed of light Siegman (1986).
The nominal frequency difference between the TEM00 and TEM02 or TEM20 modes is . In practice, the horizontal and vertical radii of curvature are slightly different, and the resonant frequencies of the TEM02 and TEM20 modes are separated by a few MHz.
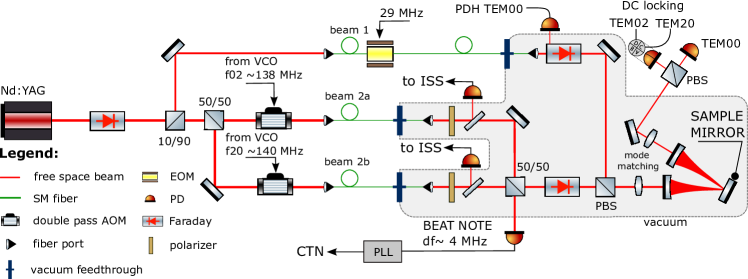
The readout and control scheme is shown in Fig. 2. The laser frequency is locked to the cavity TEM00 mode, with a 65 kHz bandwidth, using Pound-Drever-Hall reflection locking. This servo suppresses laser frequency and cavity length fluctuations that are common to the three modes. The two frequency shifted beams are then controlled to track the TEM02 and TEM20 mode resonances so that they probe the sample’s coating thermal noise, which is spatially independent between the three modes. In this improved version of the experiment, the higher-order mode probe beams are controlled using side-of-fringe locking on the cavity transmission. To maximize the signal-to-noise ration of these loops, the probe beams are locked at the point where the transmission of the TEM02 and TEM20 modes are 70% of their maximum values. Feedback is applied to the two voltage-controlled oscillators (VCO) that determine the frequency shift of the probe beams, with a control bandwidth of 40 kHz.
With the probe beam frequencies thus slaved to the TEM02 and TEM20 mode frequencies of the cavity, the spatially independent coating thermal noise of the sample appears in the frequency difference between the probe beams. This frequency difference is measured by interfering the two beams, and tracking the fluctuations in the 4 MHz beat signal using another VCO in a phase-locked loop configuration. The beat signal frequency fluctuations are converted to an equivalent cavity length change (for the TEM00mode) by multiplying by the factor . The ASD of this scaled signal, labelled , contains the coating thermal noise , as well as other readout noises which are relatively small in the frequency band of interest.
These dominant noise sources are described in the following paragraphs. The VCO used to measure the frequency difference between the higher order modes has a noise level of below 1 kHz. This will appear in the readout as an equivalent cavity length noise of:
| (2) |
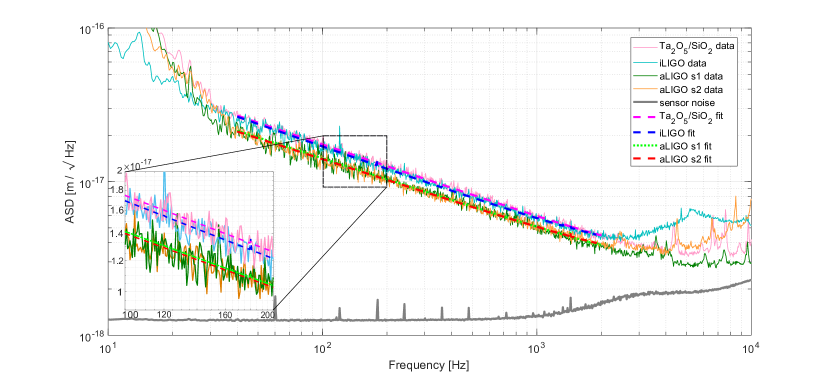
The VCO noise has some frequency dependence, increasing by about a factor of 2 above , as shown in Fig. 3.
The side-of-fringe locking used for the higher-order mode control can be contaminated by fluctuations in the transmission photocurrents due to both laser intensity noise and shot noise. The shot noise associated with the of transmitted power in each higher-order mode corresponds to a relative intensity noise of . This results in a readout noise of:
| (3) |
which is comparable to the VCO noise described above.
To address laser intensity noise, the power in each probe beam is actively stabilized before being injected into the cavity. Each probe beam is sampled and detected inside the vacuum chamber, and intensity servos stabilize the light by controlling the RF power driving the acousto-optic modulators (see Fig. 2). With a bandwidth of , these servos reduce the probe beam relative intensity noise to below at frequencies below ; higher frequency residual intensity noise is removed from the transmitted light signals with a simple feed-forward circuit.
A lower sensor noise would require modification of the VCO and the power increase in the cavity by increasing cavity finesse.
III Extrapolation to TEM00 beams
Our experiment measures the thermal noise sensed by TEM02 and TEM20 modes in a folded cavity (see Fig. 1), but we are more typically interested in the thermal noise for the fundamental mode of a linear cavity. Correction factors are thus required for the beam size, mode shape, and folded geometry. These correction factors are described in detail in Gras et al. (2017); to convert the measured CTN amplitude spectral density, , to CTN for a TEM00 beam of size , this correction is:
| (4) |
where is the beam size on the sample mirror (see Table 1).
IV Experimental Results
We measured four coating samples: two witness samples from Advanced LIGO end test mass coatings; a witness sample from an initial LIGO end test mass coating; a baseline, standard high-reflectivity coating. All four coatings where produced by ion-beam sputtering. The initial LIGO and baseline coatings are stacks of quarter-wave Ta2O5-SiO2 doublets. For the Advanced LIGO coatings, the Ta2O5 is doped with 25% TiO2 to reduce mechanical loss Harry et al. (2007). The layer thicknesses are also altered to further reduce thermal noise: the SiO2 layers are a little thicker and the Ti-Ta2 layers are a little thinner than a quarter-wavelength. All sample mirrors have a transmissivity less than at .
The baseline coating was deposited at C, with a deposition rate of for both materials. The sample was then annealed at C for 3 hours. The LIGO coating samples were also annealed, but other coating process parameters for these samples are unknown.
The measured noise, , for all 4 samples are shown in Fig. 3. In our previous paper we assumed the coating mechanical loss was constant in frequency, and thus a coating thermal noise ASD. With the increased sensitivity of the current experiment, we are able to measure CTN over a much broader frequency range ( - ), which allows us to measure this slope. We find that the best fit slope for all samples is near , which appears to match the frequency dependence of the loss angles found in Amato et al. .
The fit to the noise spectra for the Advanced LIGO coating samples is:
Our fit is limited to the band , to avoid the variable environmental noise at low frequencies, to remain well above the readout noise floor, and to avoid small noise peaks at higher frequencies due down-converted radio frequency (RF) interference.
As expected, the other coating samples we measured have higher CTN, since they are simple SiO2 and Ta2O5 quarter-wave stacks. The initial LIGO coating sample has 19% higher CTN than the the Advanced LIGO coating:
while the standard Ta2O5-SiO2 coating has 25% higher CTN than the Advanced LIGO coating:
These are consistent with a larger mechanical loss angle for Ta2O5 without the TiO2 doping.
The individual measurements of the two Advanced LIGO coating samples give the same slope, but slightly different levels of CTN. At , one sample shows and the other shows , both in units of . Each sample was measured multiple times at several locations on the coating and the results where within the statistical error bars. The CTN difference between the two samples is only 2%, but it is statistically significant (about 3 ). The origin of this difference is not known, so we extend the uncertainty on our reported value of to include both measurements.
This value differs from our previous estimate Gras et al. (2017) by less than . The difference may be due in part to small systematic effect resulting from the new experimental set-up, or it may simply be due to statistics. Our previous measurement had an SNR of only 2 at (and smaller at other frequencies), and the fitting process assumed a white readout noise, so differences at the few percent level are not surprising.
IV.1 Implications for Advanced LIGO
Extrapolating our measured CTN to the CTN of a beam on an Advanced LIGO end test mass using Eqn. 4 gives
| (5) |
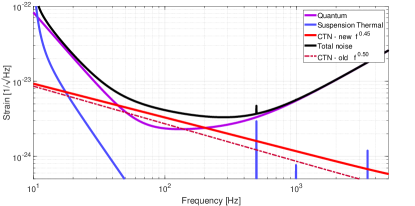
This is slightly higher than our previously reported value, and higher than the value used in Advanced LIGO design documents ( at Aasi et al. (2015)). Using the CTN value and slope measured here, we find an overall decrease in the expected Advanced LIGO binary neutron star range of 7% (from to Chen et al. (2017)) compared to Aasi et al. (2015); Martynov et al. (2016), see Fig. 4.
IV.2 Loss angle of :
To estimate the loss angle for the titania-tantala alloy used as the high refractive index material in the Advanced LIGO coatings, we use the equations given in Hong et al. (2013) and assume a loss angle for silicon-dioxide (the low index material) of Principe et al. (2015). We further assume that the loss angles associated with shear and bulk deformation are equal in both coating materials. We have moved away from the simplified CTN equations from Yam et al. (2015) used in our previous publication because that calculation neglects field penetration into the coating and thus underestimates the loss angle of the high index material by 4%. The current experiment’s precision is sufficient to make this a non-negligible effect.
V Conclusions
Precision measurements of coating thermal noise are critical to both high-precision laboratory-scale R&D, and large scale efforts such as gravitational-wave detectors. Our finding that the CTN spectrum deviates from the assumed slope will allow for more reliable computations of CTN from measurements of the mechanical properties, and more accurate extrapolations of direct CTN measurements to other frequency bands.
For Advanced LIGO in particular, the measurements presented allow us to update our understanding of the sensitivity achievable by current detectors. The CTN estimated for Advanced LIGO from our measurements is higher than that originally computed for Advanced LIGO, and it results in a 7% reduction in the detectors’ expected range. Similar impacts are expected for other gravitational-wave detectors, and both the amplitude and slope of CTN measured here will need to be incorporated into future detector designs.
Acknowledgements.
The authors would like to acknowledge the unfailing support and recognition of the LIGO Scientific Collaboration’s optics working group without which this work would not have been possible. The authors also acknowledge the support of the National Science Foundation under Grant 6936650. We are also very grateful for the computing support provided by The MathWorks, Inc. LIGO was constructed by the California Institute of Technology and Massachusetts Institute of Technology with funding from the National Science Foundation, and operates under cooperative agreement PHY-0757058. Advanced LIGO was built under award PHY-0823459. This paper carries LIGO Document Number LIGO-P1700448.References
- Harry et al. (2007) G. M. Harry et al., Classical and Quantum Gravity 24, 405 (2007).
- Evans et al. (2008) M. Evans, S. Ballmer, M. Fejer, P. Fritschel, G. Harry, and G. Ogin, Phys. Rev. D 78, 102003 (2008).
- Ludlow et al. (2007) A. D. Ludlow, X. Huang, M. Notcutt, T. Zanon-Willette, S. M. Foreman, M. M. Boyd, S. Blatt, and J. Ye, Opt. Lett. 32, 641 (2007).
- Kessler et al. (2012) T. Kessler, C. Hagemann, C. Grebing, L. Legero, U. Sterr, F. Riehle, M. J. Martin, L. Chen, and Y. J., Nature Photonics 6, 687 (2012).
- Abbott et al. (2009) B. Abbott et al., New Journal of Physics 11, 073032 (2009).
- Poot and van der Zant (2012) M. Poot and H. S. van der Zant, Physics Reports 511, 273 (2012), mechanical systems in the quantum regime.
- Cole et al. (2016) G. D. Cole, W. Zhang, B. J. Bjork, D. Follman, P. Heu, C. Deutsch, L. Sonderhouse, J. Robinson, C. Franz, A. Alexandrovski, M. Notcutt, O. H. Heckl, J. Ye, and M. Aspelmeyer, Optica 3, 647 (2016).
- The LIGO Scientific Collaboration and Harms (2017) The LIGO Scientific Collaboration and J. Harms, Classical and Quantum Gravity 34, 044001 (2017).
- Miller et al. (2015) J. Miller, L. Barsotti, S. Vitale, P. Fritschel, M. Evans, and D. Sigg, Phys. Rev. D 91, 062005 (2015).
- Punturo et al. (2010) M. Punturo et al., Classical and Quantum Gravity 27, 194002 (2010).
- Crooks et al. (2002) D. R. M. Crooks, P. Sneddon, G. Cagnoli, J. Hough, S. Rowan, M. M. Fejer, E. Gustafson, R. Route, N. Nakagawa, D. Coyne, G. M. Harry, and A. M. Gretarsson, Classical and Quantum Gravity 19, 883 (2002).
- Harry et al. (2002) G. M. Harry, A. M. Gretarsson, P. R. Saulson, S. E. Kittelberger, S. D. Penn, W. J. Startin, S. Rowan, M. M. Fejer, D. R. M. Crooks, G. Cagnoli, J. Hough, and N. Nakagawa, Classical and Quantum Gravity 19, 897 (2002).
- Pierro and Pinto (2006) V. Pierro and I. M. Pinto, Measuring Coating Mechanical Quality Factors in a Layered Cantilever Geometry: a Fully Analytic Model, Tech. Rep. (TWG, University of Sannio at Benevento, 2006).
- Cesarini et al. (2009) E. Cesarini, M. Lorenzini, E. Campagna, F. Martelli, F. Piergiovanni, F. Vetrano, G. Losurdo, and G. Cagnoli, Review of Scientific Instruments 80, 053904 (2009).
- Gras et al. (2017) S. Gras, H. Yu, W. Yam, D. Martynov, and M. Evans, Phys. Rev. D 95, 022001 (2017).
- The LIGO Scientific Collaboration (2015) The LIGO Scientific Collaboration, Classical and Quantum Gravity 32, 074001 (2015).
- Kubo (1966) R. Kubo, Reports on Progress in Physics 29, 255 (1966).
- Levin (1998) Y. Levin, Phys. Rev. D 57, 659 (1998).
- Braginsky et al. (1999) V. Braginsky, M. Gorodetsky, and S. Vyatchanin, Physics Letters A 264, 1 (1999).
- Yam et al. (2015) W. Yam, S. Gras, and M. Evans, Phys. Rev. D 91, 042002 (2015).
- Siegman (1986) A. Siegman, Lasers (University Science Books, 1986).
- Martynov et al. (2016) D. V. Martynov et al., Phys. Rev. D 93, 112004 (2016).
- (23) A. Amato, G. Cagnoli, M. Canepa, E. Coillet, J. Degallaix, V. Dolique, D. Forest, M. Granata, V. Martinez, C. Michel, L. Pinard, B. Sassolas, and J. Teillon, arXiv:1712.05701 [physics.ins-det] .
- Aasi et al. (2015) J. Aasi et al., Classical and Quantum Gravity 32, 074001 (2015).
- Chen et al. (2017) H.-Y. Chen, D. E. Holz, J. Miller, M. Evans, S. Vitale, and J. Creighton, (2017), arXiv:1709.08079 .
- Hong et al. (2013) T. Hong, H. Yang, E. K. Gustafson, R. X. Adhikari, and Y. Chen, Phys. Rev. D 87, 082001 (2013).
- Principe et al. (2015) M. Principe, I. M. Pinto, V. Pierro, R. DeSalvo, I. Taurasi, A. E. Villar, E. D. Black, K. G. Libbrecht, C. Michel, N. Morgado, and L. Pinard, Phys. Rev. D 91, 022005 (2015).
- Flaminio et al. (2010) R. Flaminio, J. Franc, C. Michel, N. Morgado, L. Pinard, and B. Sassolas, Classical and Quantum Gravity 27, 084030 (2010).
- Penn et al. (2003) S. D. Penn, P. H. Sneddon, H. Armandula, J. C. Betzwieser, G. Cagnoli, J. Camp, D. R. M. Crooks, M. M. Fejer, A. M. Gretarsson, G. M. Harry, J. Hough, S. E. Kittelberger, M. J. Mortonson, R. Route, S. Rowan, and C. C. Vassiliou, Classical and Quantum Gravity 20, 2917 (2003).
- Crooks et al. (2006) D. R. M. Crooks, G. Cagnoli, M. M. Fejer, G. Harry, J. Hough, B. T. Khuri-Yakub, S. Penn, R. Route, S. Rowan, P. H. Sneddon, I. O. Wygant, and G. G. Yaralioglu, Classical and Quantum Gravity 23, 4953 (2006).