Orbital Origin of Extremely Anisotropic Superconducting Gap in Nematic Phase of FeSe Superconductor
The iron-based superconductors are characterized by multiple-orbital physics where all the five Fe orbitals get involved. The multiple-orbital nature gives rise to various novel phenomena like orbital-selective Mott transition, nematicity and orbital fluctuation that provide a new route for realizing superconductivity. The complexity of multiple-orbital also asks to disentangle the relationship between orbital, spin and nematicity, and to identify dominant orbital ingredients that dictate superconductivity. The bulk FeSe superconductor provides an ideal platform to address these issues because of its simple crystal structure and unique coexistence of superconductivity and nematicity. However, the orbital nature of the low energy electronic excitations and its relation to the superconducting gap remain controversial. Here we report direct observation of highly anisotropic Fermi surface and extremely anisotropic superconducting gap in the nematic state of FeSe superconductor by high resolution laser-based angle-resolved photoemission measurements. We find that the low energy excitations of the entire hole pocket at the Brillouin zone center are dominated by the single orbital. The superconducting gap exhibits an anti-correlation relation with the spectral weight near the Fermi level, i.e., the gap size minimum (maximum) corresponds to the maximum (minimum) of the spectral weight along the Fermi surface. These observations provide new insights in understanding the orbital origin of the extremely anisotropic superconducting gap in FeSe superconductor and the relation between nematicity and superconductivity in the iron-based superconductors.
In the iron-based superconductors, all the five Fe orbitals (, , , and ) are involved in the low energy electronic excitationsLebegue_PRB ; Paglione_NP . The multiple-orbital character provides a new degree of freedom which, when combined with charge and spin, brings new phenomena like orbital-selective Mott transitionMYi_PRL ; Rong_PRL , orbital orderingFrank_PRB ; CCLee_PRL and nematicityFernandes_NP . Orbital fluctuation may provide a new channel for realizing superconductivitySaito_PRB ; Kontani_PRL . On the other hand, such multiple-orbital nature also brings complexity in finding the key ingredients of superconductivity in the iron-based superconductors. FeSe is unique in the iron-based superconductors because it has the simplest crystal structureHsu_PNAS . It shows a nematic transition at 90 K without being accompanied by a magnetic transitionMcQueen_PRB . In particular, FeSe superconductor provides an ideal case for studying the relationship between nematicity and superconductivityGlasbrenner_NP2015 ; FWang_NP2015 ; RYu_PRL ; XXWu_arxiv because superconductivity occurs in the nematic state. However the experimental results are controversial regarding the superconducting gap of FeSe on whether it is nodelessDong_PRB ; Hope_PRL ; Lin_PRB ; Jiao_arxiv ; Hafiez_PRB ; Khasanov_PRL ; Sprau_arxiv or nodalSong_Science ; Kasahara_PNAS ; THashimoto_NC . It is also under debate on the orbital nature of the low energy excitations that dictates superconductivitySprau_arxiv ; Suzuki_PRB ; Kreisel_PRB . Direct determination of the correspondence between the orbital nature of the low energy electronic states and the superconducting gap is crucial to understand the superconductivity mechanism of the iron-based superconductors.
In this paper, we performed high resolution laser-based angle-resolved photoemission (ARPES) measurements on the electronic structure and superconducting gap of bulk FeSe superconductor (Tc=8.0 K) in the nematic state. Highly anisotropic Fermi surface around the Brillouin zone (BZ) center is observed with the aspect ratio of 3 between the long axis (along ) and short axis (along ). The superconducting gap along the Fermi pocket is extremely anisotropic, varying between 3 meV along the short axis of Fermi surface to zero along the long axis within our experimental precision (0.2 meV). Detailed band structure analysis, combined with band structure calculations, indicates that the Fermi surface is dominated by a single orbital. Moreover, we find that the superconducting gap size shows an anti-correlation with the spectral weight near the Fermi level; the gap minimum (maximum) corresponds to the spectral intensity maximum (minimum) along the Fermi surface. These observations provide key insights on the orbital origin of the anisotropic electronic structure and superconducting gap in FeSe and the interplay between nematicity and superconductivity in the iron-based superconductors.
The electronic structure and superconducting gap of FeSe superconductor (Tc=8.0 K) (see Methods and Fig. S1 for sample details) were measured by high resolution laser-based angle-resolved photoemission system based on the time-of-flight electron energy analyzer (see Methods and Fig. S2 for experimental details). This new ARPES system has an advantage of covering two-dimensional momentum space at the same time with high energy resolution (1 meV) and momentum resolution. It is also equipped with an ultra-low temperature cryostat which can cool down the sample to 1.6 K. The laser polarization can be tuned to identify the orbital character of the observed band structure by taking the advantage of the photoemission matrix element effectsDamascelli_RMP . This system is particularly suitable for bulk FeSe because of its low Tc, tiny Fermi pockets and very small superconducting gap.
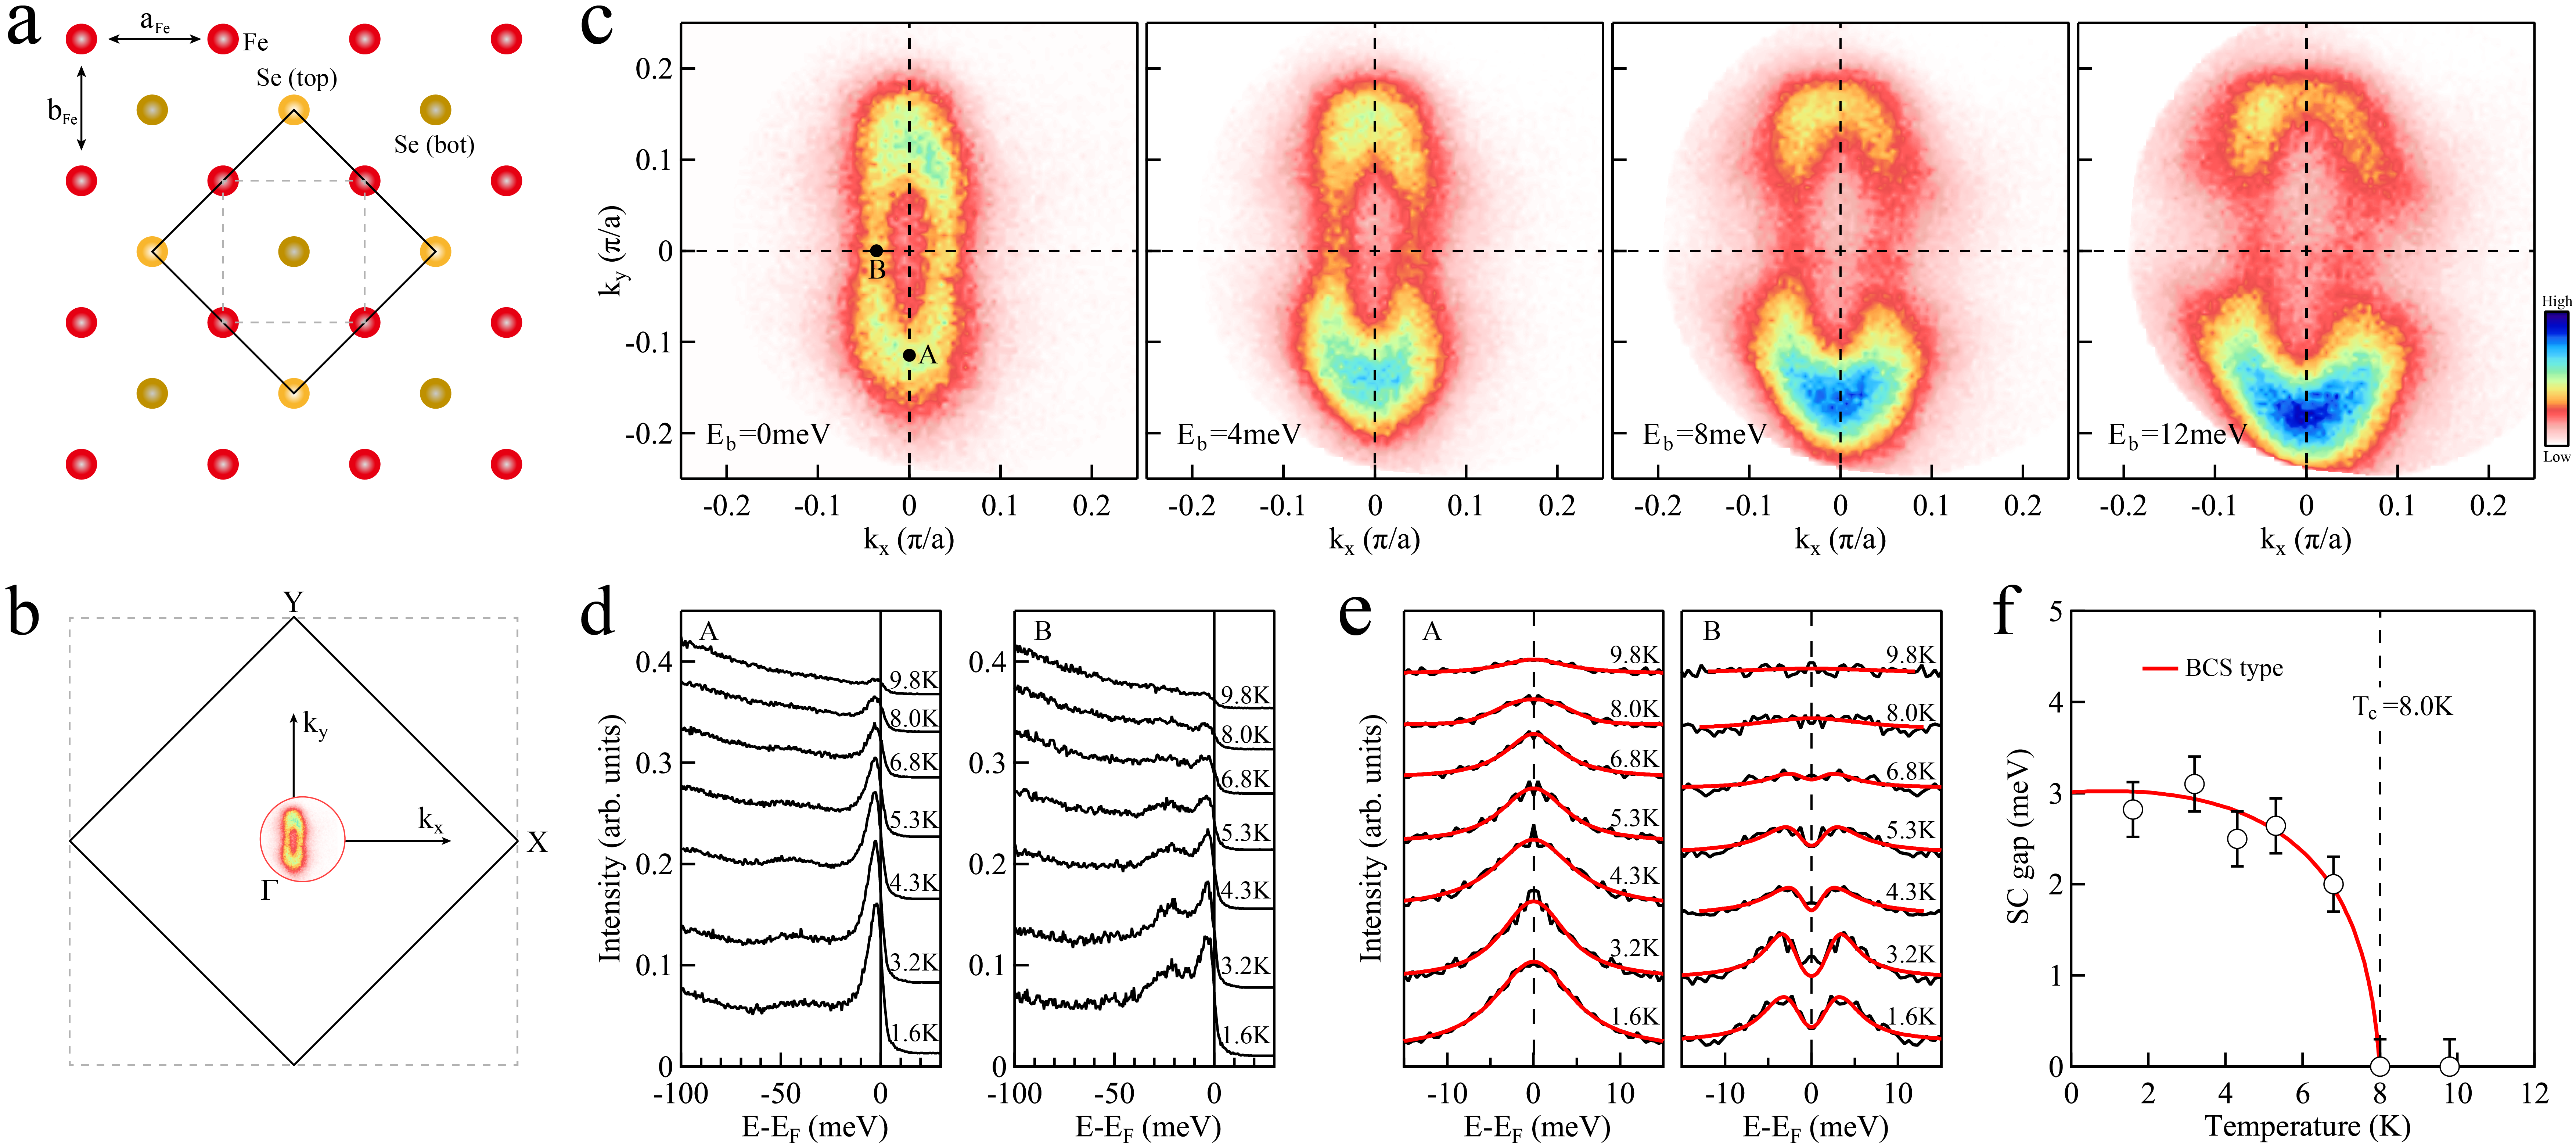
The FeSe sample we measured has a structural phase transition Ts around 90 K (Fig. S1b). It assumes a tetragonal crystal structure above Ts and becomes orthorhombic below Ts where the distance between adjacent Fe is slightly different (Fig. 1a, where is defined as the long (short ) axis). Dramatic anisotropy of physical properties between and axes occurs below the nematic transition temperatureTanatar_PRL ; AEBohmer_PRL ; Baek_NM ; Boehmer although the lattice constant difference between and is only 0.5Margadonna_CC . Fig. 1b shows the measured Fermi surface of FeSe around the BZ center which occupies a small portion of the entire BZ. Our laser-based ARPES system made it possible to cover the whole Fermi pocket around the point simultaneously under the same condition with very dense momentum points. Fig. 1c shows constant energy contours of FeSe at different binding energies measured at 1.6 K. The measured Fermi surface (leftmost panel of Fig. 1c) is highly anisotropic: the Fermi momentum along the direction is 0.036 while it is 0.11 along the direction resulting in an elongated ellipse with a high aspect ratio of 3. This is the Fermi surface that exhibits the strongest anisotropy observed among all the iron-based superconductorsDFLiu_CPL . For the photon energy we used (6.994 eV), the measured Fermi surface corresponds to a close to zeroWatson_PRB . With increasing binding energy, the constant energy contours increase in area (Fig. 1c), consistent with the Fermi pocket being hole-like. In the meantime, the spectral weight is gradually concentrated onto the two vertex areas along the long axis while it gets strongly suppressed in the central region. We note that for the FeSe single crystal sample we measured here it has nearly pure single domain even though we did not detwin the sample in advance. This may be due to accidental internal stress exerted in the sample during the preparation process because in most cases we can see signals from coexisting two domains (Fig. S2). In the FeSe sample we measured (Fig. 1), the signal from another domain is negligible even under different light polarizations. The single domain FeSe sample provided us an ideal opportunity to study its intrinsic electronic structure and superconducting gap as we will present below.
Figure 1d shows photoemission spectra (energy distribution curves, EDCs) of FeSe measured at two typical momentum points along the Fermi surface (A and B points as marked in Fig. 1c) at different temperatures. The corresponding symmetrized EDCs are shown in Fig. 1e. When the sample cools down from the normal state to the superconducting state, for both momentum points A and B, sharp superconducting coherence peaks develop which get stronger with decreasing temperature (Fig. 1d). The sharp coherence peak with a width of 6 meV is observed at 1.6 K. The EDC symmetrization is a standard procedure to remove the Fermi-Dirac function in order to extract the superconducting gapNorman_PRB . The gap size can be determined by the distance between the two peaks in the symmetrized EDCs which can be fitted by a phenomenological gap formulaNorman_PRB . For point A, the symmetrized EDCs always show a peak at the Fermi level (left panel in Fig. 1e), indicating no detectable gap opening in the superconducting state within our experimental resolution. On the other hand, for point B, the symmetrized EDCs show clear two peaks in the superconducting state (right panel in Fig. 1e) indicative of superconducting gap opening. The extracted superconducting gap at different temperatures (Fig. 1f) follows a BCS gap form; it becomes zero at and above the superconducting transition temperature of 8.0 K.
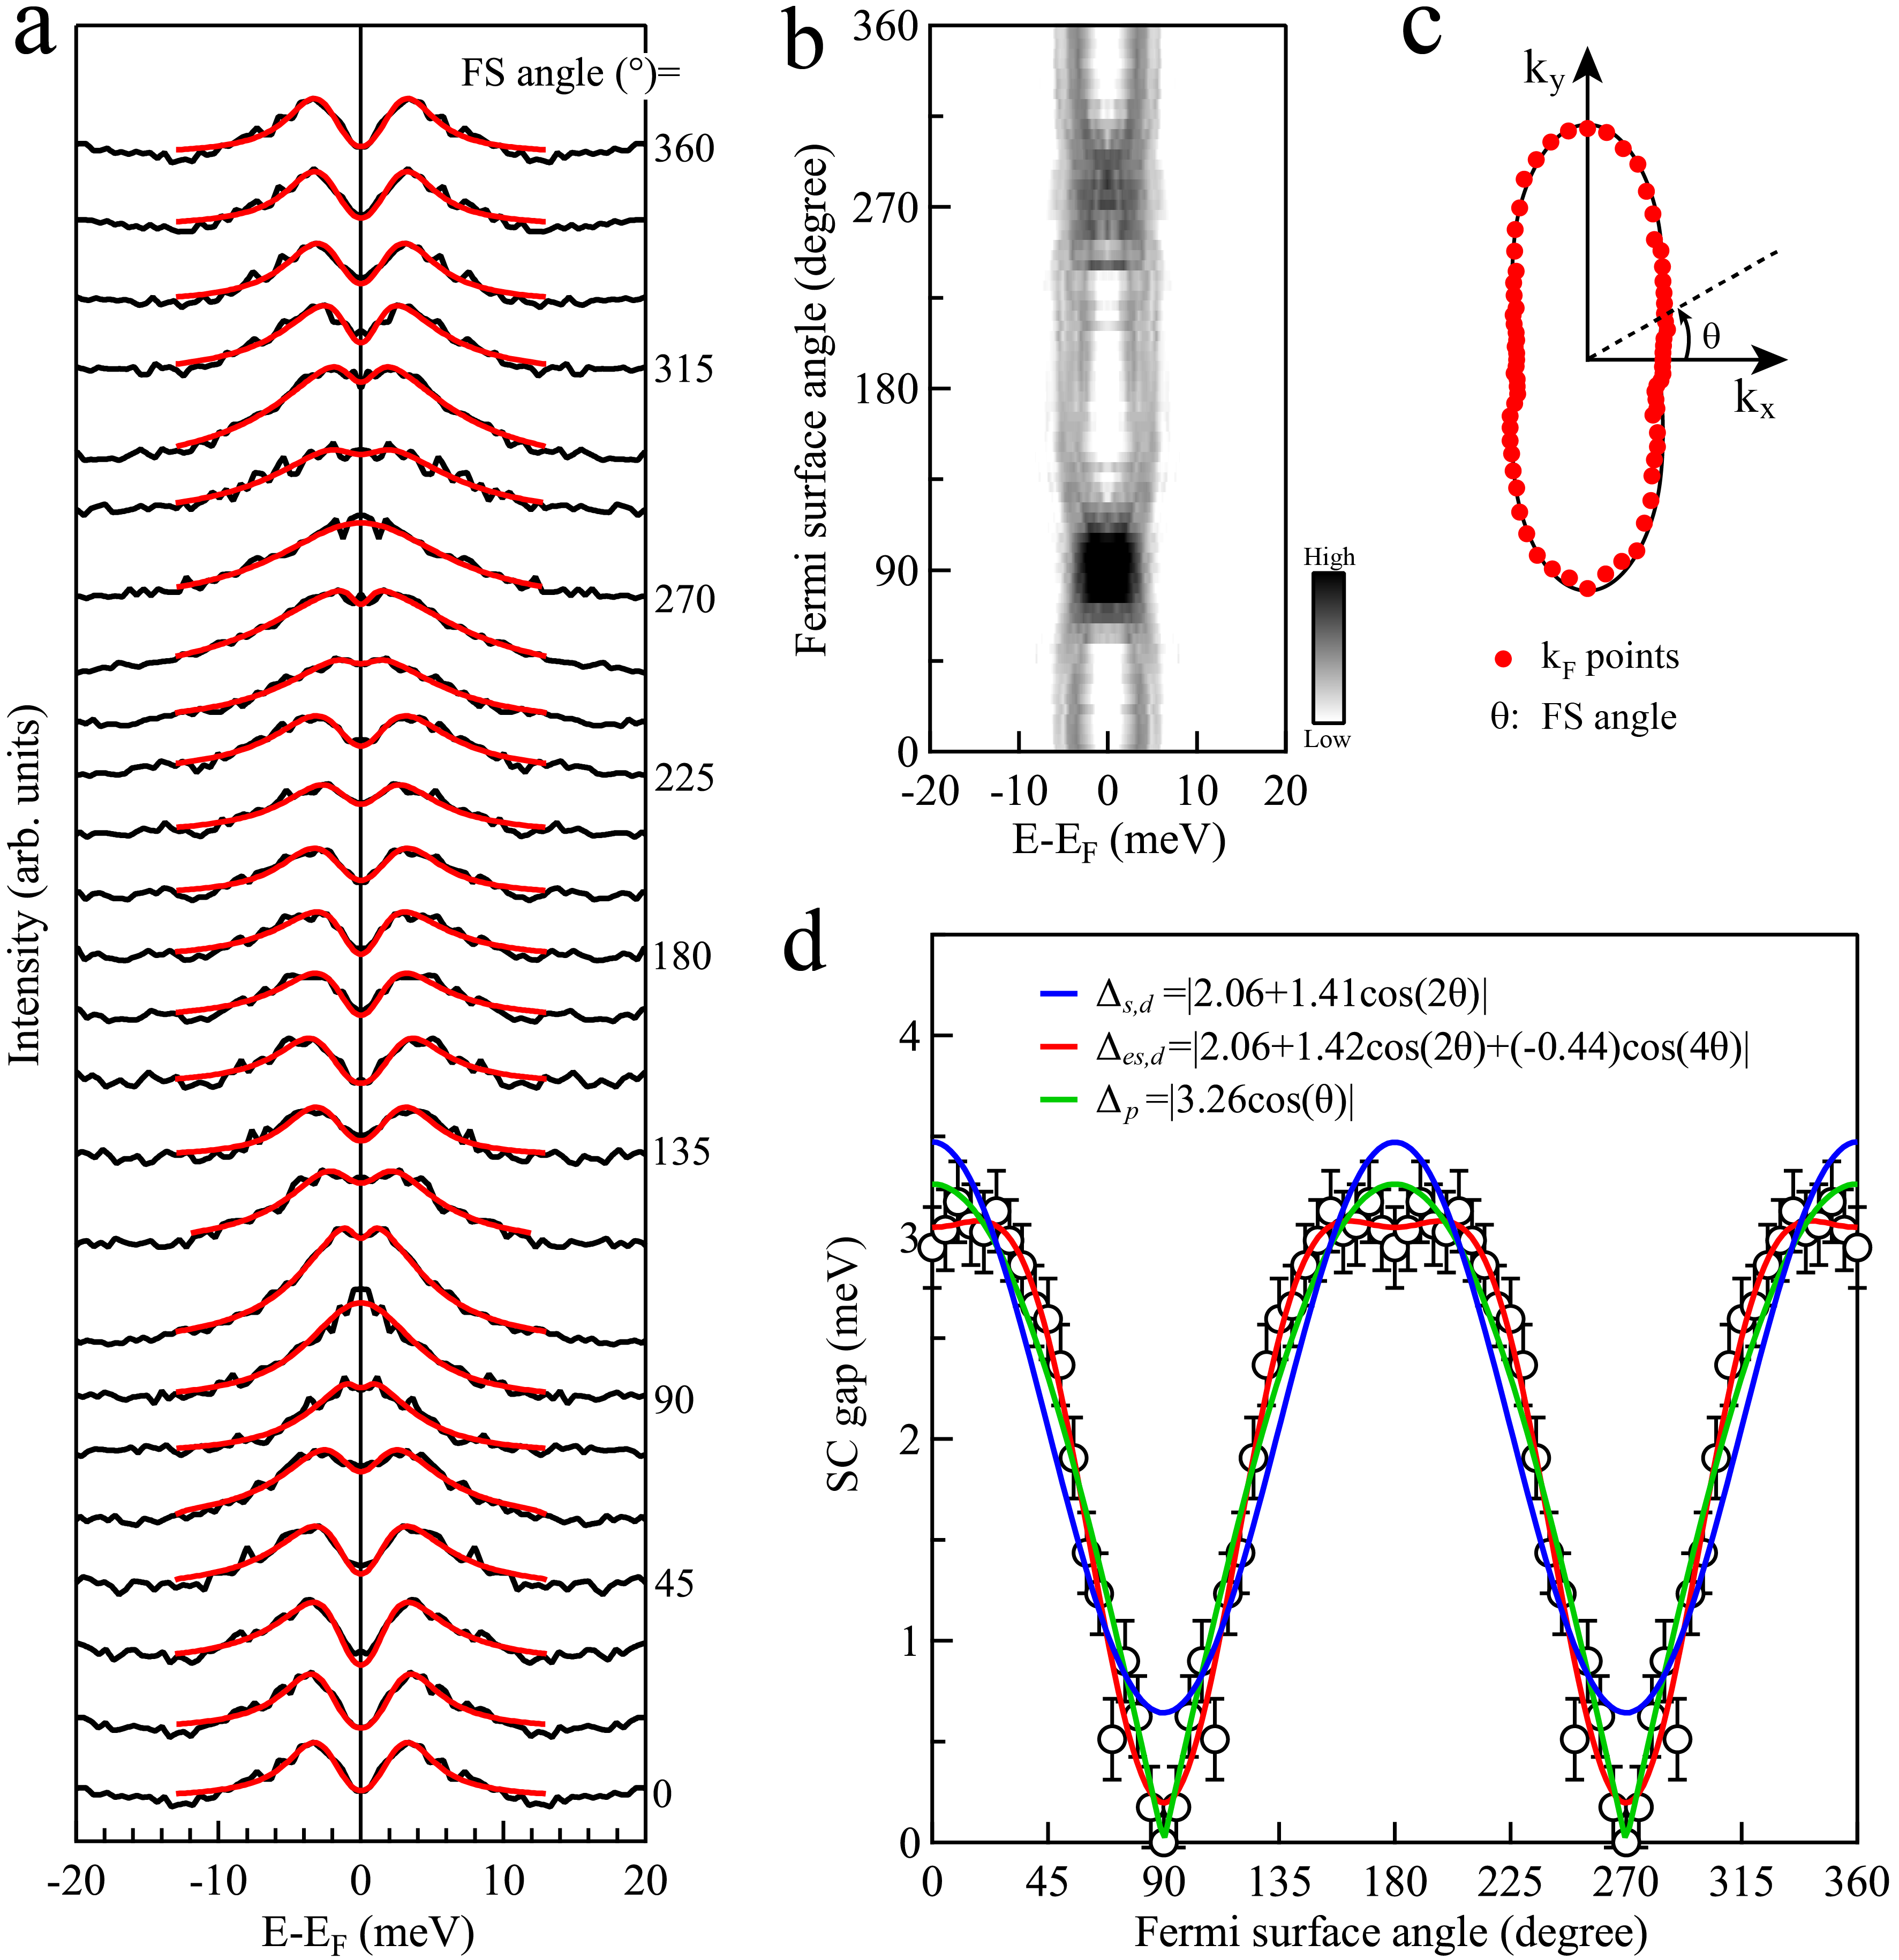
Figure 2 shows detailed momentum dependence of the superconducting gap for FeSe measured at 1.6 K. The symmetrized EDCs at some representative Fermi momenta are shown in Fig. 2a. Fig. 2b is a false color image which represents the same data as in Fig. 2a. The location of the Fermi momenta is defined by the Fermi surface angle as indicated in Fig. 2c. As seen directly from Fig. 2a and 2b, the superconducting gap shows a maximum near =0∘ and 180∘ and becomes rather small, basically zero within our experimental precision (0.2 meV) near =90∘ and 270∘. This is consistent with the recent result that the superconducting gap approaches zero near =90∘ region although their gap measurement covers a small portion of the Fermi surface in detwinned FeSeTHashimoto_NC . The symmetrized EDCs are fitted by the phenomenological gap formula, as shown in Fig. 2a, and the extracted superconducting gap is plotted in Fig. 2d as function of the Fermi surface angle. The simultaneous two-dimensional momentum coverage of our laser ARPES system makes it possible to have very dense data points of superconducting gap along the entire Fermi surface measured with super-high resolution. This allows us to quantitatively examine on various possible gap functions. The two-fold symmetry of the superconducting gap has excluded the possibility of pure -wave which would have four-fold symmetry. The two-fold symmetry, together with two near-zero points, is rather reminiscent of a -wave gap form. The measured gap is fitted by the -wave form = and the fitted curve is shown as a green line in Fig. 2d. An alternative gap form is + type which can also assume two-fold symmetryJKang_PRL ; Xu_PRL . In Fig. 2d, we also fitted the measured data with two types of + form. We first tried =+ which contains a simple -wave form and a -wave form . The fitted curve (blue line in Fig. 2d) exhibits an obvious deviation from the measured data, particularly near the minimal and maximal gap regions. Then we tried =++ which contains an anisotropic -wave + and a -wave form . The fitted curve is marked as a red line in Fig. 2d. We note that within our experimental precision (0.2 meV), we can not differentiate between the cases of zero node, two nodes and four nodes along the Fermi surface for the + gap form (Fig. S6). The observation of two nodes on the Fermi surface in terms of + gap form is quite accidental because three fitting parameters are needed and a constraint has to be imposed between these parameters, i.e., (+)-=0 (Fig. S6e). Our precise measurement on the momentum dependence of the superconducting gap puts a strong constraint on the possible gap form in FeSe superconductor.
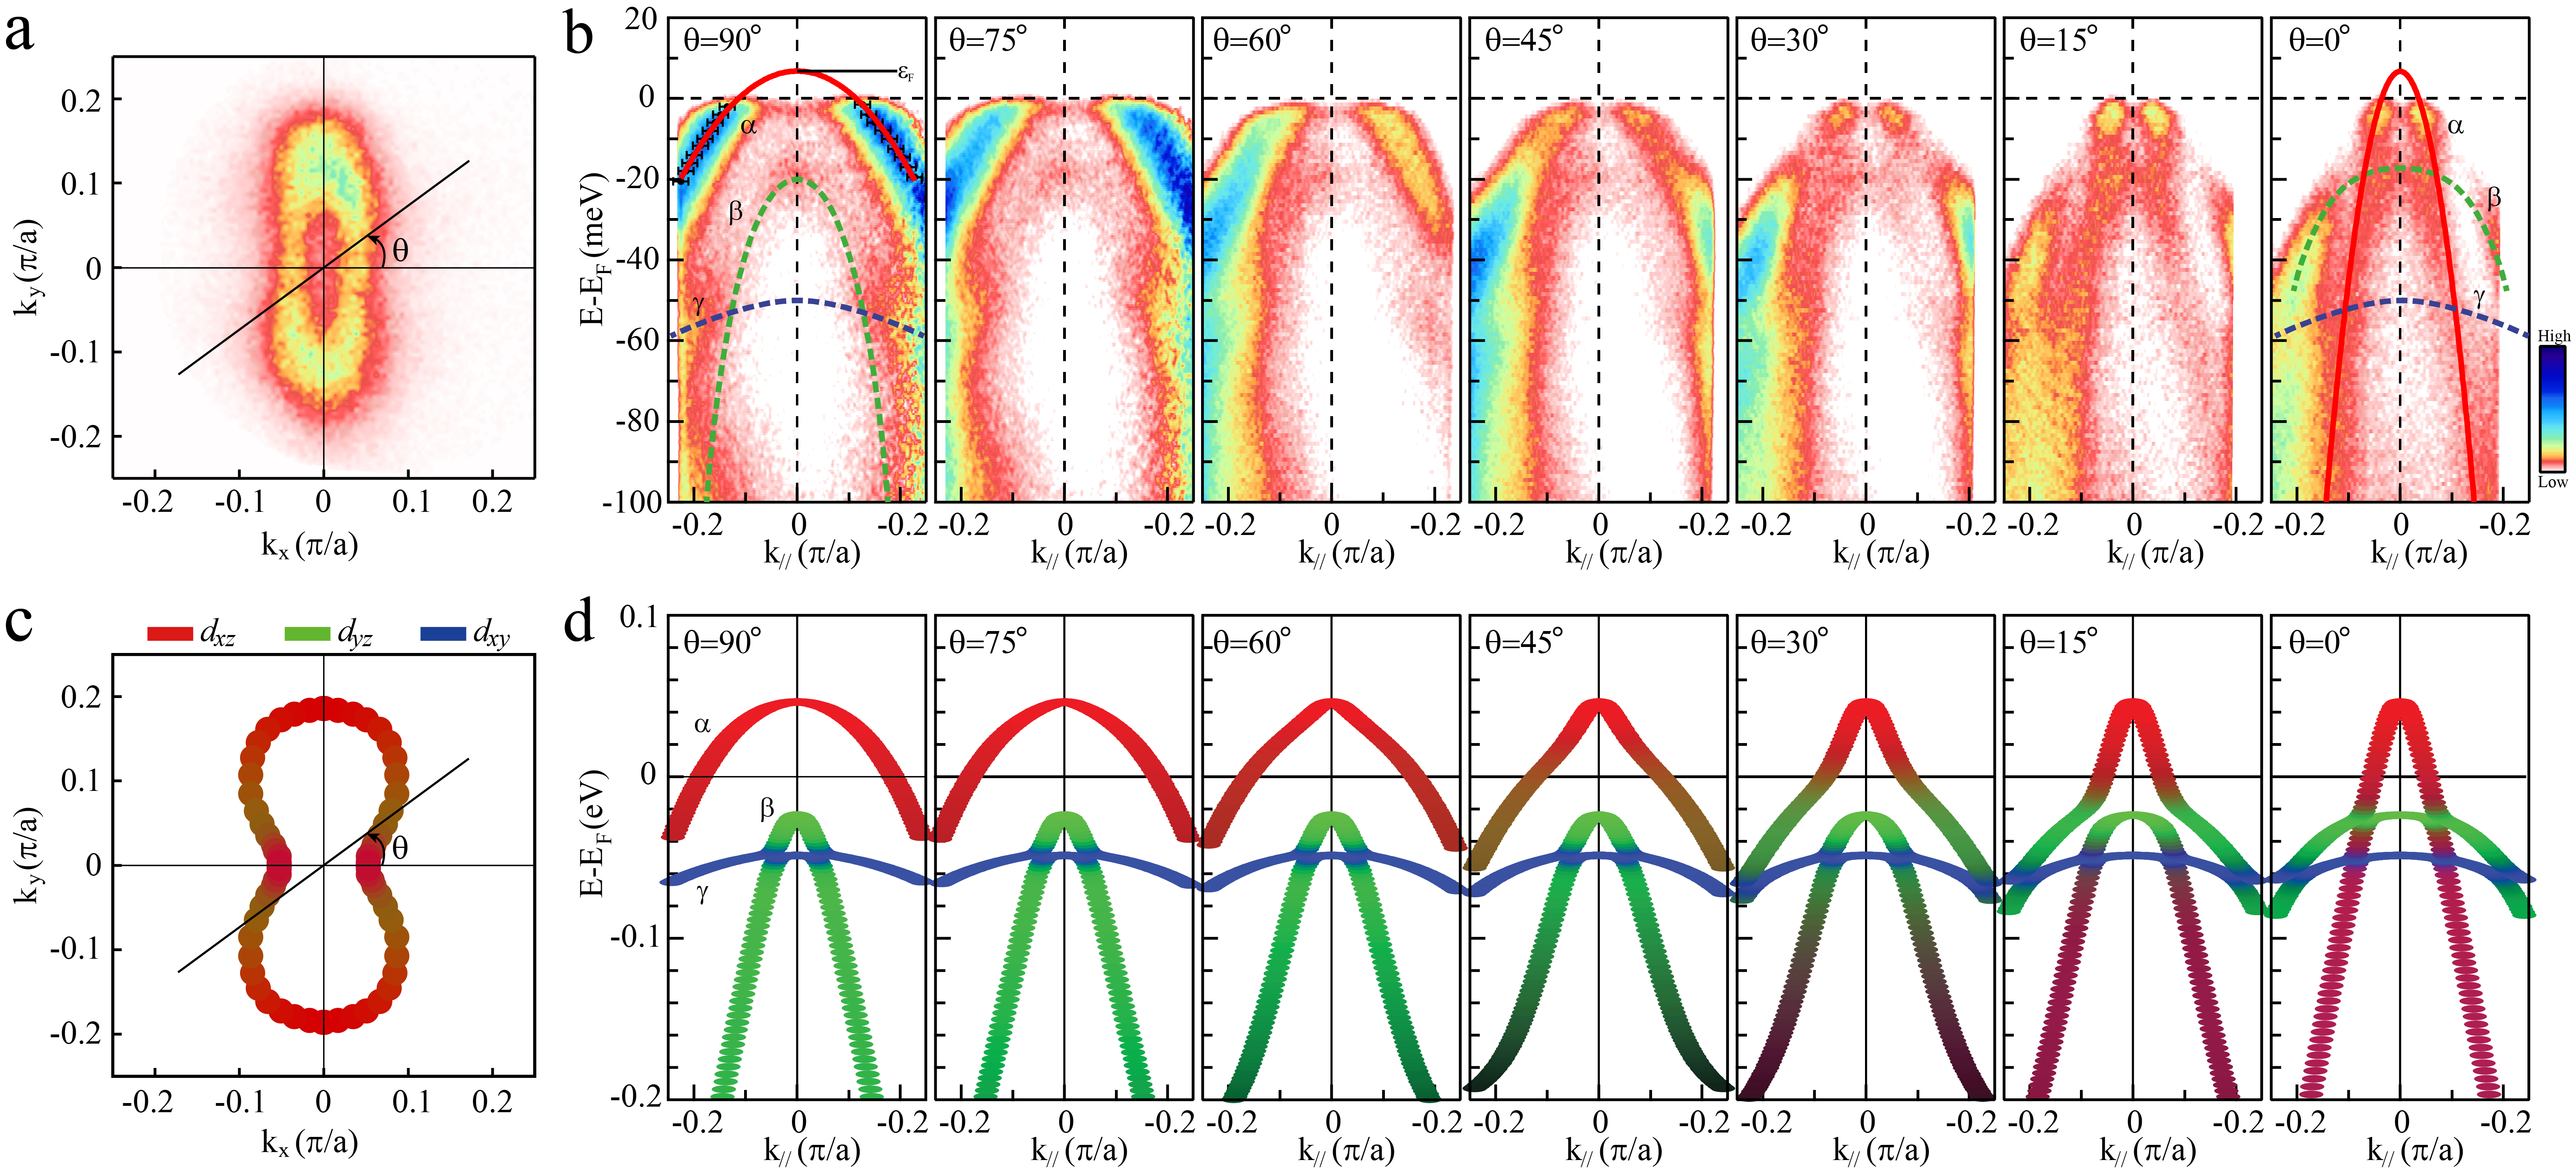
Figure 3 shows detailed momentum dependence of the band structure for FeSe measured at 1.6 K, along the momentum cuts crossing the BZ center with different Fermi surface angles defined as in Fig. 3a. Two main bands are observed for all the momentum cuts varying from horizontal (=0∘) to vertical (=90∘) directions, labeled as and bands shown in the leftmost and rightmost panels of Fig. 3b. When the momentum cuts vary from vertical (=90∘) to horizontal (=0∘) directions, the Fermi momentum of the band significantly decreases and the band gets steeper. The top of this band lies at 6.7 meV above the Fermi level, as estimated by fitting the hole-like band with a parabola (red curve in the leftmost panel in Fig. 3b). The top of the band stays at 20 meV below the Fermi level (dashed green line in the leftmost panel in Fig. 3b). This band gets flatter when the momentum cuts change from vertical (=90∘) to horizontal (=0∘) directions. Based on the analysis of the photoemission matrix elements (see Fig. S2), the and bands can be attributed to the and orbitals, respectively. This assignment is further supported by our band structure calculations (Fig. 3c and 3d) which capture the momentum dependence of the two bands well (see Methods and Supplementary materials). Above the nematic transition, and bands are split because of the spin orbital coupling (Fig. S3a and S3b)Watson_PRB . In the nematic state, the band is pushed up while the band is pushed down below the Fermi level (Fig. S3c and S3d)Suzuki_PRB , resulting in only one hole-like Fermi pocket around which is dominated by the orbital. In particular, the electronic states at the Fermi level along the and axes are purely from the orbitals, as demonstrated by the matrix elements analysis (Fig. S2) and the band structure calculations (Fig. 3c and 3d). We note that there is a slight band hybridization of and orbitals on some portions of the Fermi surface with an Fermi surface angle between =15∘45∘ (Fig. 3c and 3d). But even in this case, the orbital still dominates the electronic states at the Fermi level. There have been a controversy regarding the orbital nature of the electronic states near the Fermi levelWatson_PRB ; watson2_PRB ; Suzuki_PRB ; Sprau_arxiv . Our results demonstrate unambiguously that it is the orbital that dominates the low energy electronic structure of FeSe around point in the nematic state.
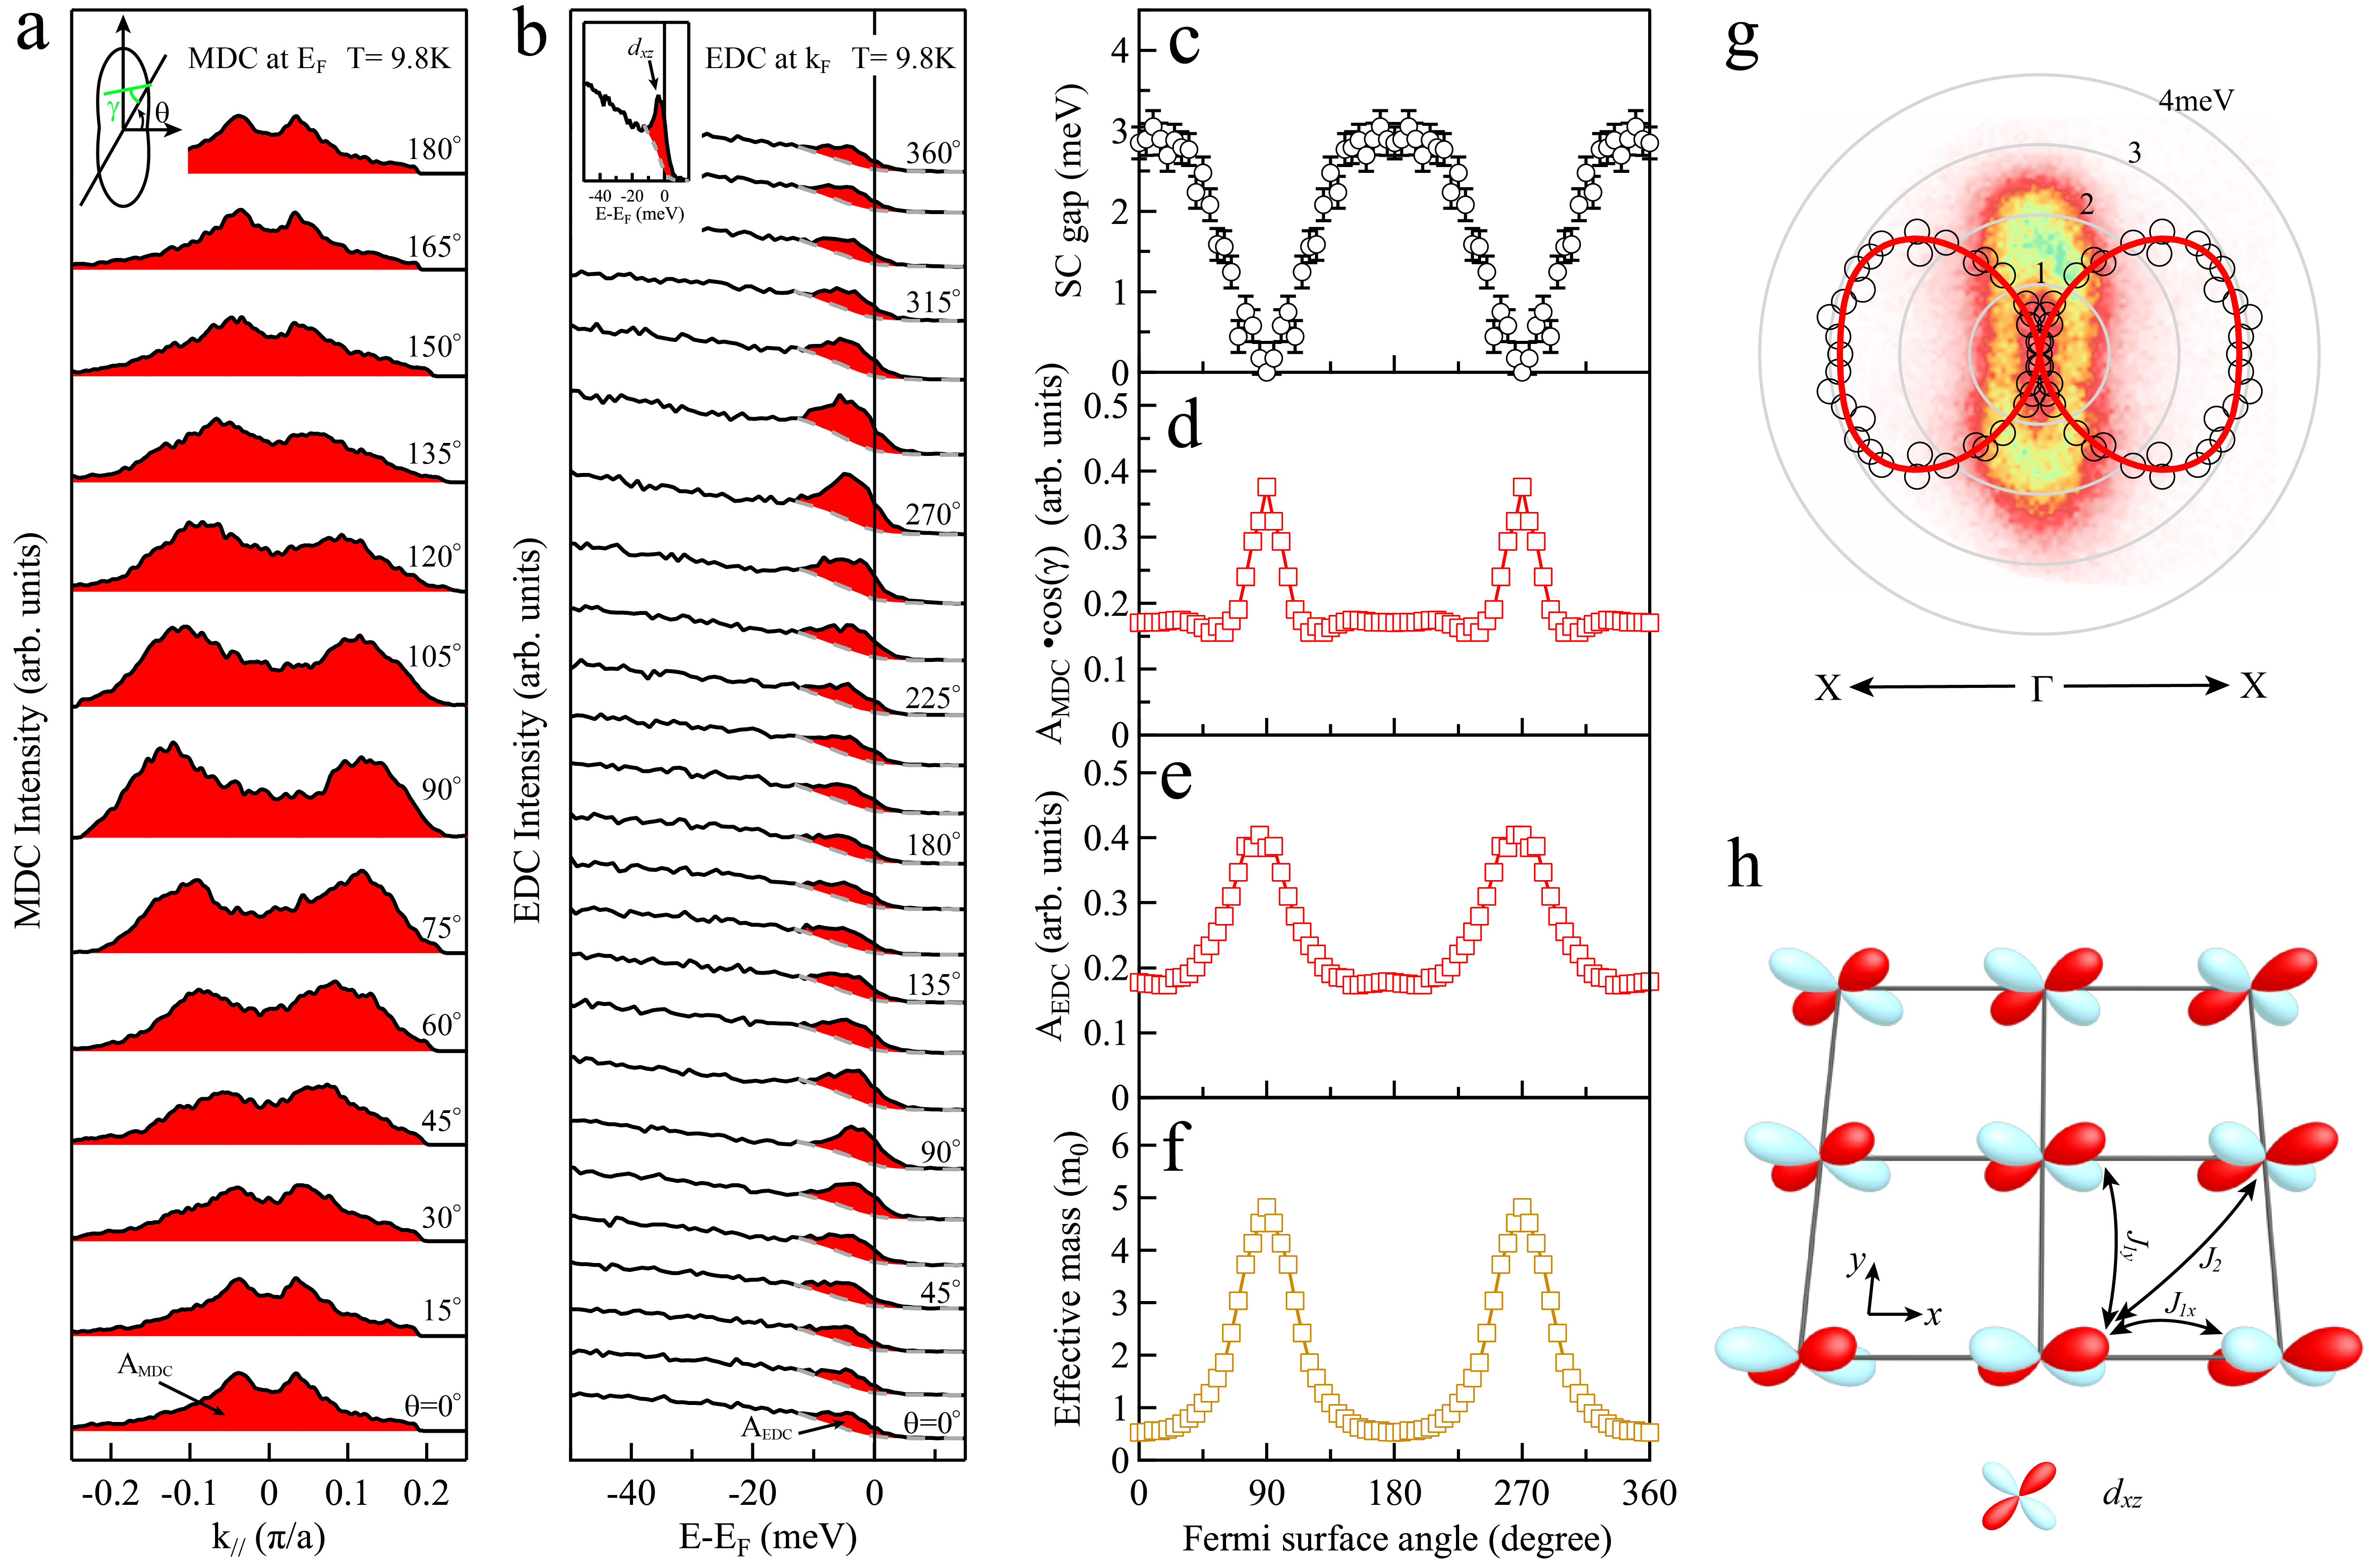
After resolving the dominant orbital nature that dictates the Fermi surface and superconducting gap of FeSe superconductor, now we come to investigate some key factors that are closely related to its superconductivity. Fig. 4a shows the momentum distribution curves (MDCs) at the Fermi level along various Fermi surface angles (schematically shown in top-left inset in Fig. 4a) measured in normal state at 9.8 K. The spectral weight (red region in Fig. 4a) is strongest near the =90∘ and gets weaker when moving to =0∘ and 180∘. Quantitative analysis of the spectral weight (MDC area) as a function of the Fermi surface angle is plotted in Fig. 4d; it is peaked near =90∘ and 270∘. Fig. 4b shows photoemission spectra (EDCs) along the Fermi surface measured at 9.8 K in normal state and the spectral weight of the orbital (red region in Fig. 4b) at different Fermi surface angles is plotted in Fig. 4e. It shows similar variation with the MDC weight. The analysis in the superconducting state gives similar results (Fig. S4). For comparison, the superconducting gap of FeSe as a function of the Fermi surface angle measured at 1.6 K is re-plotted in Fig. 4c. Overall the superconducting gap exhibits an anti-correlation relation with the spectral weight of the orbital, i.e., the gap minimum corresponds to the spectral weight maximum. We also analyzed the effective mass of the band as the function of the Fermi surface angle, as shown in Fig. 4f. The effective mass displays a dramatic variation along the Fermi surface; its value along the axis is nearly ten times that along the axis. It also shows a perfect anti-correlation with the superconducting gap: the gap maximum (minimum) corresponds to the minimum (maximum) of the effective mass.
The present observations provide key information on understanding the relationship between nematicity, electronic structure and superconductivity in FeSe. In the nematic state, the splitting of the and orbitals gives rise to an anisotropic Fermi surface around the and X/Y points (corresponding to BZ of 1-Fe unit cell)Watson_PRB ; watson2_PRB . In the extreme case when the low energy electronic states are dominated by a single orbital, the electron hopping along the direction is much more enhanced than that along the direction (Fig. 4h), resulting in highly anisotropic Fermi surface topology (Fig. 1c) and effective mass (Fig. 4f) in the nematic state of FeSe. Since nearly isotropic superconducting gap with four-fold symmetry is observed in tetragonal Fe(Se,Te) superconductorsOkazaki_PRL ; HMiao_PRB , the observed extremely anisotropic superconducting gap with two-fold symmetry in FeSe is expected to be associated with its nematicity. The question comes to how nematicity can generate such an anisotropic superconducting gap. One scenario proposed involves the splitting of the and orbitalsJKang_PRL ; Agatsuma_PRB . The orbital order in the nematic state introduces a -wave component on top of the existing -wave component, leading to a highly anisotropic superconducting gap with even accidental nodesJKang_PRL . Our measured superconducting gap (Fig. 2d) is consistent with the expected + type gap form in this pictureJKang_PRL . However, it is expected that the superconducting gap is positively correlated with the orbital occupationAgatsuma_PRB , which is opposite to our observation that the gap and the spectral weight exhibit an anti-correlation (Fig. 4c-4e). This picture involves two hole-pockets around the point, each of which is composed of both and orbitalsJKang_PRL ; Agatsuma_PRB . It needs to be modified in order to make a direct comparison with our results of FeSe where there is only one Fermi pocket around the point which is dominated by a single orbital.
To understand the anisotropic superconducting gap of FeSe, another scenario proposed considers orbital-selective Cooper pairing in a modified spin-fluctuation theory via suppression of pair scattering processes involving those less coherent statesSprau_arxiv . This picture can produce a superconducting gap structure that is consistent with our results (Fig. 2d) and previous experimental observationsSprau_arxiv ; Xu_PRL . It was proposed that the pairing is mainly based on electrons from the orbital of the iron atomsSprau_arxiv ; Kreisel_PRB . Our observations provide direct evidence that, in the nematic state of FeSe, the extremely anisotropic superconducting gap opens on the highly anisotropic Fermi surface (Fig. 4g) that is dominated by the orbital. In FeSe, it was also proposed that the superconducting gap shows a positive correlation with the spectral weight of the orbital that is considered to be responsible for superconductivitySprau_arxiv . From our direct ARPES results, although we find that the spectral weight of the orbital exhibits a good correspondence to the superconducting gap (Fig. S5), the band with orbital character lies 20 meV below the Fermi level, thus contributing little to superconductivity of FeSe. Our results indicate that superconductivity in FeSe is dictated by the orbital and its spectral weight shows an anti-correlation with the superconducting gap: the gap minimum corresponds to the spectral weight maximum of the orbital (Fig. 4c-4e). Our results ask for a reexamination on the picture of the orbital-selective superconductivity in FeSeSprau_arxiv .
The fact that the measured gap function can be fitted to a simple -wave gap function also leads us to ask whether the spin-triplet pairing is possible in FeSe. In the nematic state, because of the dominant single orbital feature of the Fermi surface around the and the strong Hund’s rule coupling, the interaction of the band with other bands near X/Y is expected to become rather weak. For the orbital, the dominant intra-orbital coupling is the nearest neighbor magnetic exchange couplings along the axis, namely the -interaction shown in Fig. 4h, which is ferromagnetic in iron-chalcogenides from neutron scattering measurementsJohnston2010 ; Hu2012 ; Wang2012 ; Dai2015 . If this is the strongest pairing interaction, the superconducting pairing on the Fermi surface is possible to have a triplet -wave symmetry with a gap function proportional to , which is consistent with our observations. No drop of the Knight shift across Tc is observed in NMR measurements of bulk FeSe, which is also compatible with a possible triplet pairingAEBohmer_PRL ; Baek_NM . In addition to the coexisting Néel and stripe spin fluctuations observed by neutron scatteringQWang_NM ; QWang_NC , recent observation of charge ordering in FeSe suggests a presence of an additional magnetic fluctuation with a rather small wavevectorWLi_NP that is related to intra-pocket scattering around pointYTTam . Our present work raises an interesting possibility of -wave pairing symmetry in FeSe. We note that ARPES can only measure the magnitude of the superconducting order parameter. Also because of the limitation of the laser photon energy (6.994 eV), it is not possible for us to measure the superconducting gap on the Fermi surface around the X/Y point (Fig. 1b). Considering that the measured superconducting gap can be fitted quite well by both a simple -wave form (green line in Fig. 2d) and a combined gap form of an anisotropic - and -waves (red line in Fig. 2d), it is clear that further experimental and theoretical studies are needed to establish the pairing symmetry of FeSe.
In summary, by carrying out high resolution laser-based ARPES on the bulk FeSe, we have observed an extremely anisotropic superconducting gap on the highly anisotropic Fermi surface in the nematic state of FeSe superconductor. The Fermi pocket around is dominated by orbital. The spectral weight of the orbital shows an anti-correlation with the superconducting gap along the Fermi surface. Our results directly demonstrate that the Cooper pairing on the Fermi pocket around originates from electrons of orbitals in the nematic state of FeSe. They provide key insights on the pairing symmetry and the interplay between nematicity and superconductivity in iron-based superconductors.
Methods
High quality FeSe bulk single crystals were grown by KCl/AlCl3 chemical vapor transport techniqueBLei_PRL ; Bohmer_PRB . The samples are characterized by x-ray diffraction (XRD) (Fig. S1a). Electrical resistance measurement and magnetic measurement (Fig. S1b, c) show a Tc of 8.0 K with a sharp transition width of 0.4 K.
High-resolution ARPES measurements were performed at our new laser-based system equipped with the 6.994 eV vacuum ultraviolet laser and the time-of-flight electron energy analyser (ARToF 10k by Scienta Omicron)YZhang_NC . This latest-generation ARPES system is capable of measuring photoelectrons covering two-dimensional momentum space (, ) simultaneously. The system is equipped with an ultra-low temperature cryostat which can cool the sample to a low temperature of 1.6 K. Measurements were performed using both and polarization geometries (see Fig. S2). The energy resolution is 1 meV and the angular resolution is 0.1 degree. All the samples were measured in ultrahigh vacuum with a base pressure better than 5.010-11 mbar. The samples were cleaved in situ and measured at different temperatures. The Fermi level is referenced by measuring polycrystalline gold which is in good electrical contact with the sample, as well as the normal state measurement of the sample above Tc.
To simulate the band structure of FeSe, we adopted 5-orbital tight-binding model including onsite spin-orbital coupling (). In the nematic state, we further consider -wave () and -wave () orbital order which break rotational symmetry. The Hamiltonian of these two orders are given by,
| (1) |
| (2) |
where is the density for orbital. To match the data in ARPES experiments in the nematic state, the adopted parameters in the calculations are =10 meV, =17.5 meV and =-10 meV. In normal state, we set =10 meV, =0 meV and =0 meV.
References
- (1) S. Lebegue et al., Electronic structure and properties of the Fermi surface of the superconductor LaOFeP. Phys. Rev. B 75, 035110 (2007).
- (2) J. Paglione et al., High-temperature superconductivity in iron-based materials. Nat. Phys. 6, 645 (2010).
- (3) M. Yi et al., Observation of temperature-induced crossover to an orbital selective Mott phase in AxFe2-ySe2 (A=K, Rb) superconductors. Phys. Rev. Lett. 110, 067003 (2013).
- (4) R. Yu et al., Orbital-selective Mott phase in multiorbital models for alkaline iron selenides K1-xFe2-ySe2. Phys. Rev. Lett. 110, 146402 (2013).
- (5) F. Kruger et al., Spin-orbital frustrations and anomalous metallic state in iron-pnictide superconductors. Phys. Rev. B 79, 054504 (2009).
- (6) C. Lee et al., Ferro-orbital order and strong magnetic anisotropy in the parent compounds of iron-pnictide superconductors. Phys. Rev. Lett. 103, 267001 (2009).
- (7) R. Fernandes et al., What drives nematic order in iron-based superconductors. Nat. Phys. 10, 97 (2014).
- (8) T. Saito et al., Orbital fluctuation theory in iron pnictides: Effects of As-Fe-As bond angle, isotope substitution, and -orbital pocket on superconductivity. Phys. Rev. B 82, 144510 (2010).
- (9) H. Kontani et al., Orbital-fluctuation-mediated superconductivity in iron pnictides analysis of the five-orbital Hubbard-Holstein model. Phys. Rev. Lett. 104, 157001 (2010).
- (10) F. Hsu et al., Superconductivity in the PbO-type structure -FeSe. Proc. Natl. Acad. Sci. USA. 105, 14262 (2008).
- (11) T. McQueen et al., Extreme sensitivity of superconductivity to stoichiometry in Fe1+δSe. Phys. Rev. B 79, 014522 (2009).
- (12) F. Wang et al., Nematicity and quantum paramagnetism in FeSe. Nat. Phys. 11, 959 (2015).
- (13) J. K. Glasbrenner et al., Effect of magnetic frustration on nematicity and superconductivity in iron chalcogenides. Nat. Phys. 11, 953 (2015).
- (14) R. Yu et al., Antiferroquadrupolar and Ising-nematic orders of a frustrated bilinear-biquadratic Heisenberg model and implications for the magnetism of FeSe. Phys. Rev. Lett. 115, 116401 (2015).
- (15) X. Wu et al., Nematic orders and nematicity-driven topological phase transition in FeSe. arXiv:1603.02055.
- (16) J. Dong et al., Multigap nodeless superconductivity in FeSex: Evidence from quasiparticle heat transport. Phys. Rev. B 80, 024518 (2009).
- (17) P. Bourgeois-Hope et al., Thermal conductivity of the iron-based superconductor FeSe: Nodeless gap with a strong two-band character. Phys. Rev. Lett. 117, 097003 (2016).
- (18) J. Lin et al., Coexistence of isotropic and extended -wave order parameters in FeSe as revealed by low-temperature specific heat. Phys. Rev. B 84, 220507 (2011).
- (19) L. Jiao et al., Superconducting gap structure of FeSe. Sci. Rep. 7, 44024 (2017).
- (20) M. Abdel-Hafiez et al., Temperature dependence of lower critical field Hc1(T) shows nodeless superconductivity in FeSe. Phys. Rev. B 88, 174512 (2013).
- (21) R. Khasanov et al., Evolution of two-gap behavior of the superconductor FeSe1-x. Phys. Rev. Lett. 104, 087004 (2010).
- (22) P. Sprau et al., Discovery of orbital-selective Cooper pairing in FeSe. Science 357, 75 (2017).
- (23) C. Song et al., Direct observation of nodes and twofold symmetry in FeSe superconductor. Science 332, 1410 (2011).
- (24) S. Kasahara et al., Field-induced superconducting phase of FeSe in the BCS-BEC cross-over. Proc. Natl. Acad. Sci. USA. 111, 16309 (2014).
- (25) T. Hashimoto et al., Superconducting gap anisotropy sensitive to nematic domains in FeSe. Nat. Commun. 9, 282 (2018).
- (26) Y. Suzuki et al., Momentum-dependent sign inversion of orbital order in superconducting FeSe. Phys. Rev. B 92, 205117 (2015).
- (27) A. Kreisel et al., Orbital selective pairing and gap structures of iron-based superconductors. Phys. Rev. B 95, 174504 (2017).
- (28) A. Damascelli et al., Angle-resolved photoemission studies of the cuprate superconductors. Rev. Mod. Phys. 75, 473 (2003).
- (29) M. Tanatar et al., Origin of the resistivity anisotropy in the nematic phase of FeSe. Phys. Rev. Lett. 117, 127001 (2016).
- (30) A. Boehmer et al., Nematicity, magnetism and superconductivity in FeSe. J. Phys.: Condens. Matter 30, 023001 (2018).
- (31) S. Baek et al., Orbital-driven nematicity in FeSe. Nat. Mater. 14, 210 (2015).
- (32) A. Boehmer et al., Origin of the tetragonal-to-orthorhombic phase transition in FeSe: a combined thermodynamic and NMR study of nematicity. Phys. Rev. Lett. 114, 027001 (2015).
- (33) S. Margadonna et al., Crystal structure of the new FeSe1-x superconductor. Chem. Commun. 0, 5607 (2008).
- (34) D. Liu et al., Common electronic features and electronic nematicity in parent compounds of iron-based superconductors and FeSe/SrTiO3 films revealed by angle-resolved photoemission spectroscopy. Chin. Phys. Lett. 33, 077402 (2016).
- (35) M. Watson et al., Emergence of the nematic electronic state in FeSe. Phys. Rev. B 91, 155106 (2015).
- (36) M. Norman et al., Phenomenology of the low-energy spectral function in high-Tc superconductors. Phys. Rev. B 57, 11093(R) (1998).
- (37) M. Watson et al., Evidence for unidirectional nematic bond ordering in FeSe. Phys. Rev. B 94, 201107(R) (2016).
- (38) K. Okazaki et al., Evidence for a cos(4) modulation of the superconducting energy gap of optimally doped FeTe0.6Se0.4 single crystals using laser angle-resolved photoemission spectroscopy. Phys. Rev. Lett. 109, 237011 (2012).
- (39) H. Miao et al., Isotropic superconducting gaps with enhanced pairing on electron Fermi surfaces in FeTe0.55Se0.45. Phys. Rev. B 85, 094506 (2012).
- (40) J. Kang et al., Manipulation of gap nodes by uniaxial strain in iron based superconductors. Phys. Rev. Lett. 113, 217001 (2014).
- (41) T. Agatsuma et al., Structure of the pairing gap from orbital nematic fluctuations. Phys. Rev. B 94, 214505 (2016).
- (42) H. Xu et al., Highly anisotropic and twofold symmetric superconducting gap in nematically ordered FeSe0.93S0.07. Phys. Rev. Lett. 117, 157003 (2016).
- (43) D. Johnston, The puzzle of high temperature superconductivity in layered iron pnictides and chalcogenides. Adv. Phys. 59, 803 (2010).
- (44) J. Hu et al, Unified minimum effective model of magnetic properties of iron-based superconductors. Phys. Rev. B 85, 144403 (2012).
- (45) M. Wang et al., Spin waves and magnetic exchange interactions in insulating Rb0.89Fe1.58Se2. Nat. Commun. 2, 580 (2012).
- (46) P. Dai, Antiferromagnetic order and spin dynamics in iron-based superconductors. Rev. Mod. Phys. 87, 855 (2015).
- (47) Q. Wang et al., Strong interplay between stripe spin fluctuations, nematicity and superconductivity in FeSe. Nat. Mater. 15, 159 (2016).
- (48) Q. Wang et al., Magnetic ground state of FeSe. Nat. Mater. 7, 12182 (2016).
- (49) W. Li et al., Stripes developed at the strong limit of nematicity in FeSe film. Nat. Phys. 13, 957 (2017).
- (50) Y. Tam et al., Itinerancy-enhanced quantum fluctuation of magnetic moments in iron-based superconductors. Phys. Rev. Lett. 115, 117001 (2015).
- (51) B. Lei et al., Evolution of high-temperature superconductivity from low-Tc phase tuned by carrier concentration in FeSe thin flakes. Phys. Rev. Lett. 116, 077002 (2016).
- (52) A. Boehmer et al., Lack of coupling between superconductivity and orthorhombic distortion in stoichiometric single-crystalline FeSe. Phys. Rev. B 87, 180505(R) (2013).
- (53) Y. Zhang et al., Electronic evidence of temperature induced lifshitz transition and topological nature in ZrTe5. Nat. Commun. 8, 15512 (2017).
Acknowledgement
We thank Dunghai Lee, Rafael Fernandes, Chandra Varma, Qimiao Si, Guangming Zhang, J. C. Seamus Davis, Zhixun Shen and Guoqing Zheng for helpful discussions. This work is supported by the National Key Research and Development Program of China (Grant No. 2016YFA0300300 and 2017YFA0302900), the National Natural Science Foundation of China (Grant No. 11334010 and 11534007), the National Basic Research Program of China (Grant No. 2015CB921000 and 2015CB921300) and the Strategic Priority Research Program (B) of the Chinese Academy of Sciences (Grant No. XDB07020300 and XDPB01).
Author Contributions
D.F.L., C.L., J.W.H. contributed equally to this work. X.J.Z. and D.F.L. proposed and designed the research. B.L., L.W., Y.G.S. and X.H.C. contributed to FeSe crystal growth. X.L.D contributed to the magnetic measurement. X.X.W., J.P.H. and T.X. contributed to the band structure calculations and theoretical discussion. D.F.L., C.L., J.W.H., B.S., Q.G., Y.X.Z., X.L., Y.H., Y.X., A.J.L., J.L., P.A., L.Z., S.L.H., L.Y., G.D.L., F.F.Z., S.J.Z., F.Y., Z.M.W., Q.J.P., Z.Y.X., C.T.C. and X.J.Z. contributed to the development and maintenance of Laser-ARTOF system. X.W.J. contributed to software development for data analysis. D.F.L., C.L., J.W.H. and B.S. carried out the experiment with the assistance from Q.G., Y.X.Z., X.L., Y.H., Y.X., A.J.L., J.L. and P.A.. D.F.L., C.L., J.W.H. and X.J.Z. analyzed the data. D.F.L. and X.J.Z. wrote the paper with C.L., J.W.H., J.P.H. and T.X.. All authors participated in discussion and comment on the paper.