2017/12/28 \Accepted2018/2/6
ISM: clouds — ISM: individual objects (M33) — stars: formation — radio lines: ISM
Triggering the formation of the supergiant H\emissiontypeII region NGC 604 in M33
Abstract
Formation mechanism of a supergiant H\emissiontypeII region NGC 604 is discussed in terms of collision of H\emissiontypeI clouds in M33. An analysis of the archival H\emissiontypeI data obtained with the Very Large Array (VLA) reveals complex velocity distributions around NGC 604. The H\emissiontypeI clouds are composed of two velocity components separated by km s-1 for an extent of pc, beyond the size of the the H\emissiontypeII region. Although the H\emissiontypeI clouds are not easily separated in velocity with some mixed component represented by merged line profiles, the atomic gas mass amounts to and for each component. These characteristics of H\emissiontypeI gas and the distributions of dense molecular gas in the overlapping regions of the two velocity components suggest that the formation of giant molecular clouds and the following massive cluster formation have been induced by the collision of H\emissiontypeI clouds with different velocities. Referring to the existence of gas bridging feature connecting M33 with M31 reported by large-scale H\emissiontypeI surveys, the disturbed atomic gas possibly represent the result of past tidal interaction between the two galaxies, which is analogous to the formation of the R136 cluster in the LMC.
1 Introduction
Dynamical interactions of galaxies are believed to be a major driver of active star formation. Large scale galaxy collision or merger make active starbursts happen, and accelerate the galaxy evolution and metal enrichment (e.g., [Genzel et al. (1998)]). It is widely believed that galaxies evolve as they undergo collisions to merge with other galaxies. Physical processes of the massive cluster formation in detail has not been well understood yet since these are not spatially resolved due to their large distances. The Milky Way Galaxy should also have experienced such dynamical events in the past although the current star formation activity is not so high as those observed in starburst galaxies. The existence of globular clusters in the Galactic halo suggests past starburst activities, and hence, investigation of the formation of rich star cluster is a key to understand the evolution history of the Galaxy.
Close encounters of galaxies, on the other hand, as a small-scale interaction between galaxies is supposed to perturbs materials in galaxies and enhance the star formation activity (e.g., [Noguchi & Ishibashi (1986)]). The tidal force acting between two galaxies during the encounter strips off portion of the interstellar material, and the material may fall back down onto the galaxies after the encounter. The Magellanic system is suggested to be one example of such events as theoretically proposed by Fujimoto & Noguchi (1990), and represented with numerical simulations by Bekki & Chiba (2007a, b). These simulations show that the two Magellanic clouds had close encounters in about yr ago and streaming H \emissiontypeI gas is falling down onto the disk of the Large Magellanic Cloud (LMC) with a velocity of km s-1. Most recently, Fukui et al. (2017) suggested that the super star cluster RMC 136 (hereafter R136) has been formed by triggering of colliding H \emissiontypeI flow falling from the Small Magellanic Cloud (SMC) to the LMC.
M33 is a member of the local galaxy group associated with M31, and harbors NGC 604 that is a super star cluster similar system to R136. H \emissiontypeI high velocity clouds (HVCs) in the proximity of M33 have been discovered, and possible origins are discussed (Grossi et al., 2008). Among them, gas fueling from M31 seems to be reasonable since the bridge of H \emissiontypeI gas, called M31-M33 stream, is detected by the Westerbork Sythesis Radio Telescope (WSRT) (Braun & Thilker, 2004), the Arecibo radio telescope (Putman et al., 2009), and Green Bank Telescope (GBT) (Lockman et al., 2012). The M31-M33 stream is successfully reproduced by numerical simulations similar to the Magellanic stream (Bekki, 2008). These are thus compelling evidence that continuous gas accretion of 0.5 yr-1 provides necessary fueling for sustaining M33’s relatively active star formation rate (Grossi et al., 2008). This implies that formation of young super star cluster NGC 604 in M33, the largest and brightest H \emissiontypeII region next to R136 among the local group, could be triggered by the H \emissiontypeI cloud collision falling down from the stream to the disk, by analogy with R136.
The NGC 604 cluster with an age of 3-5 Myr contains more than 200 O-type stars associated with a bright H nebula extending to a radius of 200-400 pc (e.g., Relaño & Kennicutt (2009)) at a distance of 794 kpc from the Sun (McConnachie et al., 2004). The stellar mass of NGC 604 amounts to be (Eldridge & Relaño, 2011). The feedback of the expanding H \emissiontypeII region and sequential star formation have been discussed from the existence of arc-like H nebula, warm molecular gas and the spatial gradient of the star formation efficiency (Yang et al., 1996; Tenorio-Tagle et al., 2000; Tosaki et al., 2007; Miura et al., 2010). The latter two papers argue that the 2nd generation star clusters are triggered by the expansion of the H \emissiontypeII region excited by the central star cluster. From the evolutional stages of molecular clouds, star formation propagates from the central cluster where molecular and atomic gas has a cavity to pc south where massive Giant Molecular Clouds (GMCs) are distributed. The time scale of this propagation is estimated to be in the order of yr, comparable to the cluster age (Tosaki et al., 2007).
In this paper, we focus on the formation mechanism of NGC 604 by investigating the velocity structure of H \emissiontypeI gas around it, particularly in terms of triggering. Section 2 describes the archival H \emissiontypeI data and data analysis. Section 3 gives the result of multiple velocity decomposition of the H \emissiontypeI gas and their distributions. We then discuss the possibility of colliding H \emissiontypeI gas that may trigger molecular cloud formation and subsequent massive cluster (NGC 604) formation in Section 4, and summarize in Section 5.
2 Archival data and data analysis
Entire M33 has been surveyed in atomic gas with Very Large Array (VLA) and in molecular gas with the Nobeyama 45m and IRAM 30m telescopes with a spatial resolution better than 20 (corresponding to 77 pc). This enabled us to identify individual atomic and molecular clouds, and make statistical studies with their properties, such as star-formation activities represented by association of H \emissiontypeII regions.
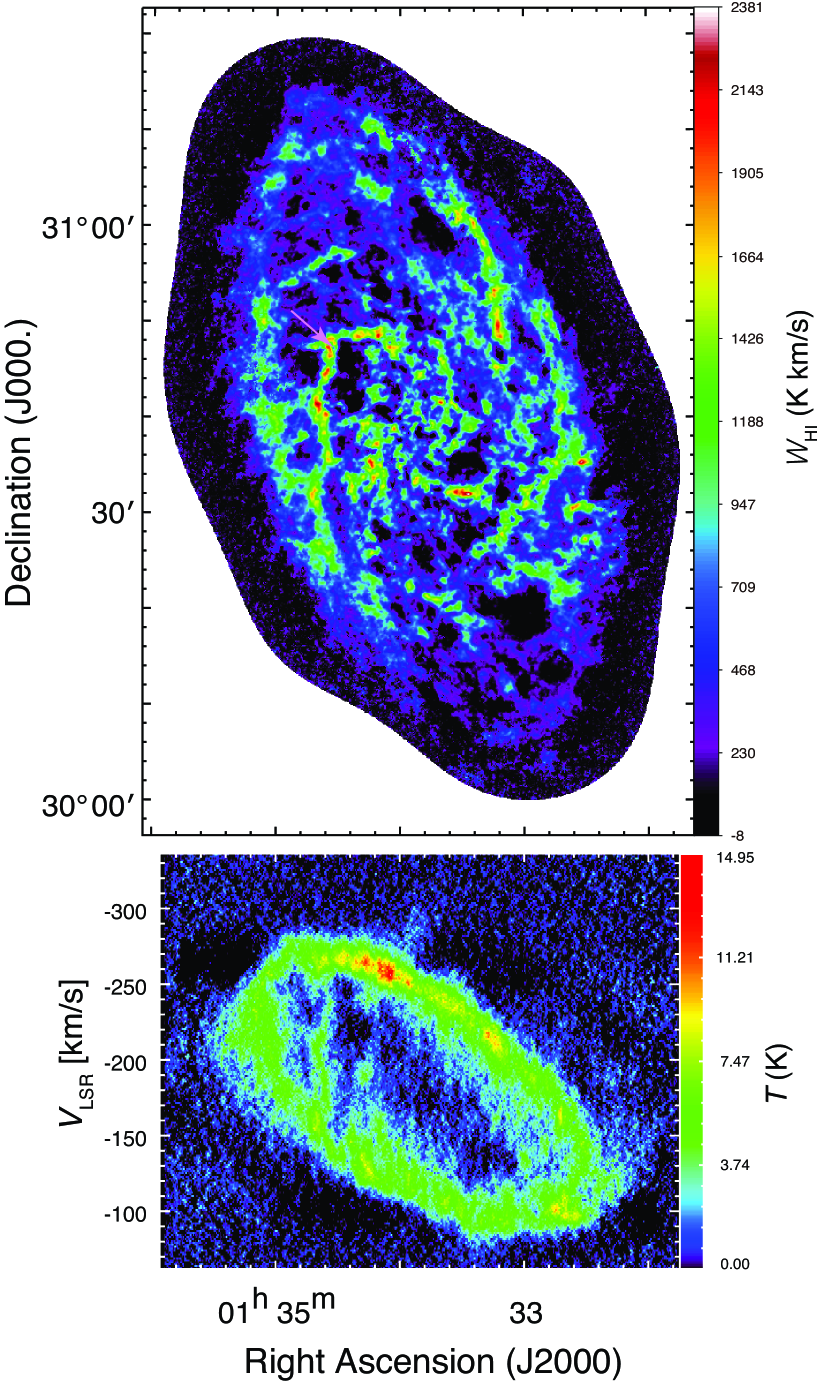
The H \emissiontypeI mosaic data were obtained from the archive of the VLA with the configurations of B, C, and D. They were reduced and imaged by Gratier et al. (2010) on the Common Astronomy Software Applications (CASA). The datasets were merged and in the plane with subsequent imaging and deconvolution on the merged dataset, 4 resolution of 5, 12, 17, and 25 arcsec where obtained by tapering in the UV plane, with 1.27 km s-1 channel width covering the area of 0.84 deg2 (see Gratier et al. (2010) for more detail). Those of 12 arcsec (46 pc) resolution oversampled with 4 arcsec pixel scale are used in this paper as the signal-to-noise ratio of the 5 arcsec map is not sufficient compared to the one at 12 arcsec. Fig. 1 top is the integrated intensity mosaic map of the H \emissiontypeI emission covering the entire star forming disk of M33, showing dense atomic gas clouds concentrated along the spiral arms. Fig. 1 bottom shows the position velocity (PV) diagram with the intensity averaged along the declination. Because of the inclination and rotation of the galaxy, the diagram demonstrates elliptical intensity distribution with the spectra blue-shifted in northeast and red-shifted in southwest.
In order to compensate the velocity gradient due to the inclination and galaxy rotation, the spectra at each pixel are shifted assuming that the galaxy has a flat rotation following the model expressed as a function as:
| (1) |
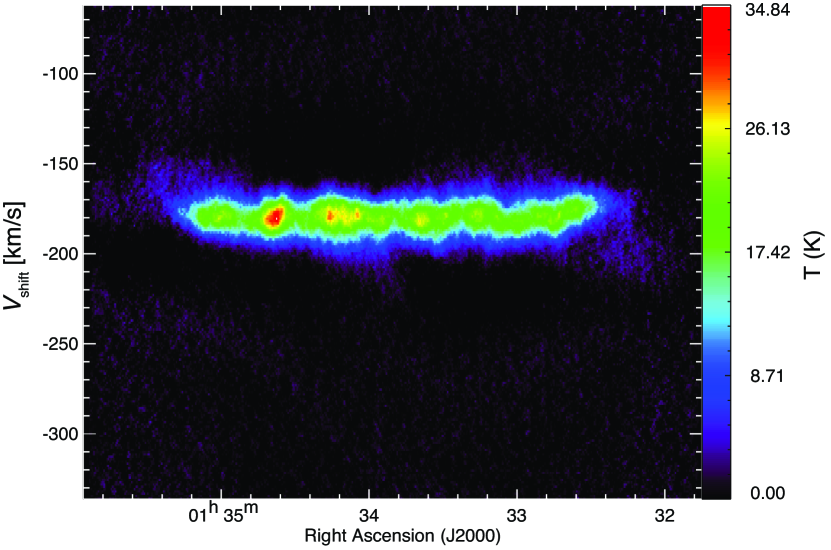
where is the circular velocity at , is the radius where the velocity field change from rigid to flat rotation, is the systemic velocity. This is basically the same analytical model by Corbelli & Schneider (1997) with slightly modified parameters to minimized the velocity dispersion of the averaged spectra. We first define the rotation center and position angle to have the constant velocity centroid along the inclination axis. Then we search for the best rotation model by changing these parameters and check the velocity dispersion of the averaged spectra after applying the velocity shifts. We find that km s-1, , and km s-1 give the best result, while Corbelli & Schneider (1997) estimated slightly larger value of . The inclination is compensated by the inclination angle , the rotation center at (R.A., Dec)J2000 = (\timeform1h33m51.0s, \timeform+30D39’35”), and the position angle . Our best fit results give slightly larger and smaller than previous values given by Regan & Vogel (1994) and Paturel et al. (2003) by a few degrees. After compensating the inclination and rotation, the velocity structure is “flattened” as shown in the position velocity diagram of Fig. 2. The full-width half maximum (FWHM) of the averaged spectra of thus shifted data is estimated to be 22.2 km s-1. In the following analysis, we use the H \emissiontypeI spectra in thus shifted velocity frame .
3 Results
3.1 H \emissiontypeI clouds around NGC 604
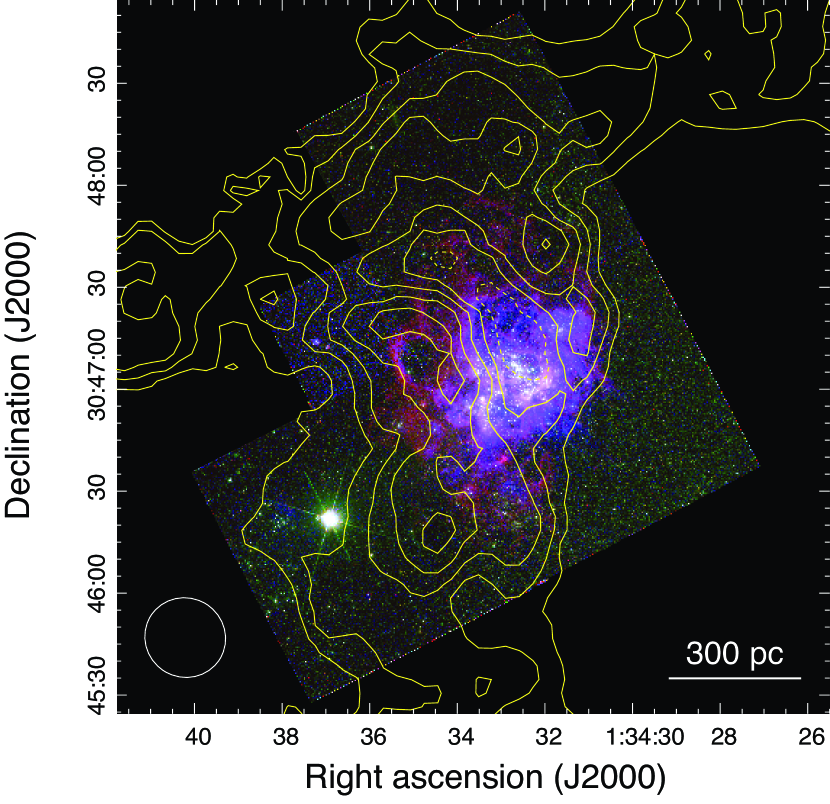
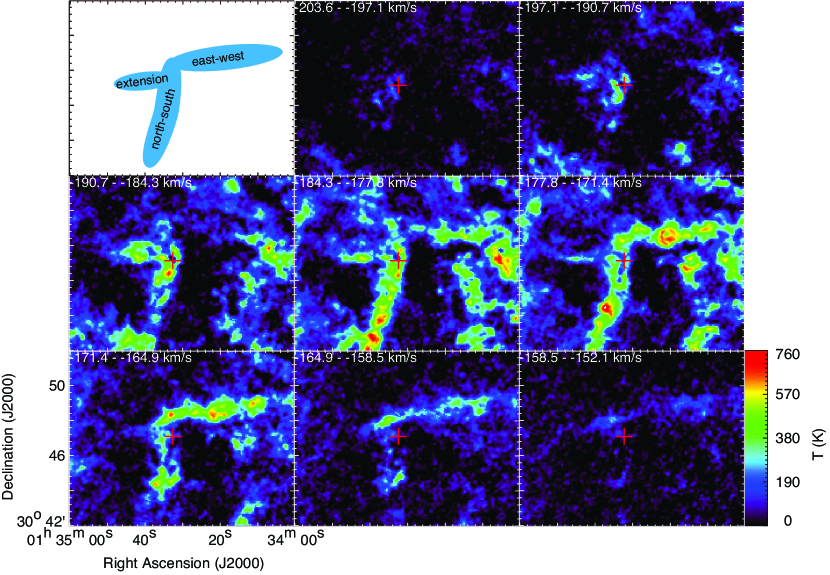
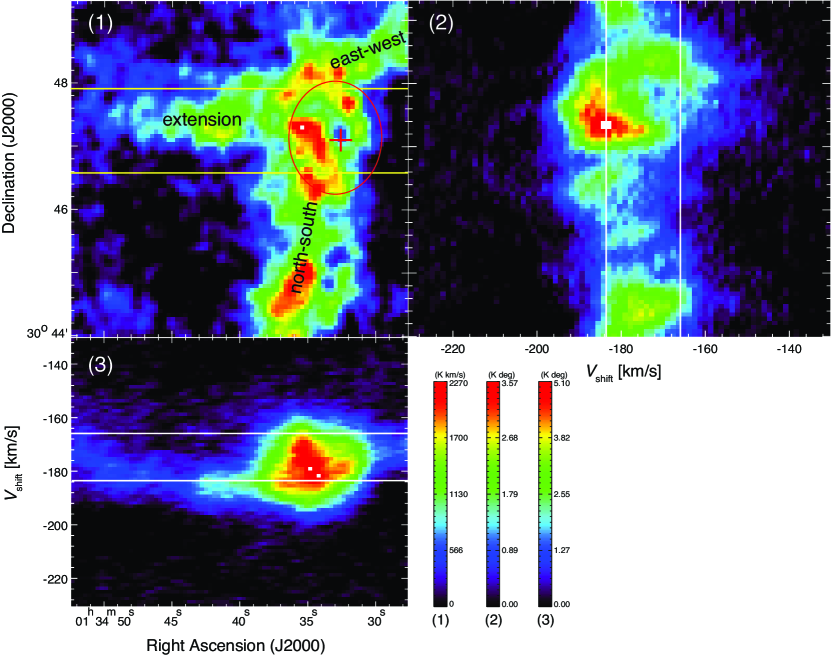
Here we focus on spatial and velocity distributions of the H \emissiontypeI clouds around the supergiant H \emissiontypeII region NGC 604. Fig. 3 shows the detailed cloud distributions superposed on the optically visible nebulosity of NGC 604 imaged by the Hubble Space Telescope (HST). The H \emissiontypeI intensity has a depression seen as a cavity where interstellar gas is ionized by the strong UV radiation, and the central cluster is visible through the cavity (see the schematic view of Tosaki et al. (2007)). The H \emissiontypeI clouds associated with the spiral arm in this part of M33 has a bent shape with an east-west elongated feature connected with a north-south feature toward NGC 604. It is also connected with a feature of short extension stretched to the east by pc away from the NGC 604 cluster. Fig. 4 is the velocity channel map of the H \emissiontypeI data around NGC 604. As seen in these maps and the position-velocity diagram of Fig. 5, the clouds of north-south and east-west features associated with the spiral arm are mainly distributed in the velocity range of , whereas the clouds in the extension feature are relatively blue-shifted as . They both have, however, complex spatial and velocity distributions and it is difficult to separate them simply by a threshold velocity.
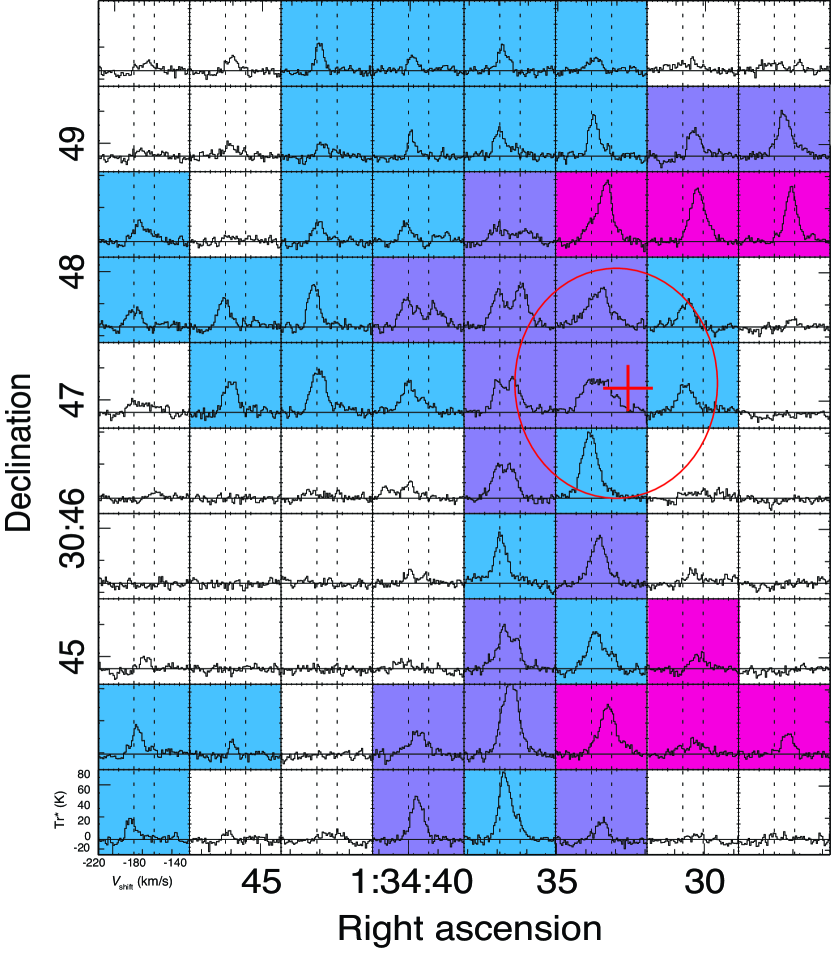
Fig. 6 is an H \emissiontypeI profile map with the spatial resolution of (after 25 pixel binning) and separation each around NGC 604. As clearly seen in the velocity distribution and the double-peaked spectral shapes, the H \emissiontypeI gas consists of at least two discrete velocity components. The blue-shifted component is dominated by the emission at the velocity of km s-1, while the red-shifted one is at km s-1 although the entire cloud has complex velocity distribution with spectra on intermediate velocity and merged spectra at some positions. The background color in cyan and magenta denote that the H\emissiontypeI spectra is dominated by blue- and red-shifted components, respectively, with single-peak velocity close to km s-1 and km s-1, respectively. The purple one, on the other hand, show that the spectra imply the existence of mixed H\emissiontypeI gas as represented by double-peaked profile or single-peaked one with the peak velocity of the intermediate values.
Note that the clouds in the extension part are dominated with the blue-shifted gas, whereas the red-shifted component is strong in the western parts of the clouds. The spectra within the NGC 604 H \emissiontypeII region delineated by the blue ellipse in Fig. 6 have relatively large velocity dispersion, where the double-peaked profiles are clearly detected outside the ellipse, implying that the complex velocity structure is not only due to the feedback effect of the central cluster, but rather large-scale gas merging of the two velocity components.
3.2 Two-component Gaussian decomposition
In order to characterize physical propertied of the H \emissiontypeI clouds around NGC 604, decomposition of the spectra by two-component Gaussian fittings are attempted. For the spectrum at each pixel, least-squares regression fittings are adapted with the two-component Gaussian functions. The initial values of the central velocity for the fittings are given as km s-1 and km s-1, and the peak intensities and velocity dispersions are set to be free parameters. After the iterations, the result of the fitting for each pixel is evaluated, and in case the fitting failed, fitting is repeated with the single component Gaussian function. Fig. 7 exhibits the distributions of the separated two velocity components with the km s-1 (red-shifted) component as the image and the km s-1 (blue-shifted) one as the contours. Note that when the spectrum is blended, the fitted single-component Gaussian is attributed to the red-shifted component, and the gray shaded area denotes the pixels where two-component Gaussian fittings failed. The median values of the resultant central velocity for the red- and blue-shifted components are km s-1 and km s-1, respectively. The red-shifted component distributes mainly along the arm, while the blue-shifted component spread from the extension to the region near NGC 604 and also further down to the south along the arm. Toward the central cluster of NGC 604 H \emissiontypeII region, both of the two velocity components exhibits depression. Along the arm between \timeform+30D43’30” Dec. \timeform+30D45’30”, the H \emissiontypeI cloud (hereafter the southern cloud) consist of the two velocity components, while they are mixed at the middle part (Dec. ) of the cloud.
The H \emissiontypeI column density and total mass of thus separated components are derived. The column density of H \emissiontypeI, , is calculated from the radiative transfer equation with the integrated intensity of H \emissiontypeI, for each pixel assuming the optically thin condition as:
| (2) |
where is the integrated intensity of the H \emissiontypeI emission line given as , with the observed H \emissiontypeI brightness temperature . The blue-shifted cloud has a peak column density of cm-2 at (R.A., Dec.)J2000 = (\timeform1h34m41.3s, \timeform+30D47’14”) for the extension, and cm-2 at (\timeform1h34m35.0s, \timeform+30D45’2”) for the southern cloud. The atomic total mass of the blue-shifted clouds is estimated by summing up the column density of each pixel to be . The red-shifted cloud has, on the other hand, peak column density of cm-2 near the border of the NGC 604 H \emissiontypeII region. The atomic total mass of the red-shifted clouds is .
3.3 Associated CO clouds and their star formation activities
Tosaki et al. (2011) surveyed entire disk of M33 for molecular clouds in CO 1–0 emission with the Nobeyama 45m telescope, and revealed molecular fraction distribution as a function of the radial distance from the galactic center. The azimuthally averaged distribution demonstrates a trend that higher for the inner 1.5 kpc region with a peak value of , while the outer part has typical of . They suggest higher metallicity for the inner part of the galaxy. This molecular fraction is given by a ratio of molecular and atomic surface densities as , and hence directly compared with a molecular to atomic mass fraction of if the molecular and atomic clouds are sampled from the same area. For the clouds in the present region around NGC 604 displayed in Fig.7, the total atomic gas mass is estimated by summing up the values of and multiplying with the area of the grid and the proton mass to be , while the molecular cloud mass in the same area is estimated similarly from molecular column density to be from the CO 1–0 data with an assumption of an factor of (Wilson & Scoville, 1990). This gives a ratio of for the NGC 604 region, significantly higher than the averaged values () estimated for the galactic radius of kpc in M33 by Tosaki et al. (2011).
On the other and, Gratier et al. (2012) entirely surveyed the galaxy in the CO (2–1) line with the IRAM 30m telescope and identified 337 GMCs using the CPROPS (Cloud PROPertieS) algorithm (Rosolowsky & Leroy, 2006), and compared them with the same dataset of H \emissiontypeI as the present work. In the region of our interest around NGC 604, there are GMC #209-#219 and #225. GMC #276 corresponds to the peak of the blue-shifted clouds in the extension feature, while GMC #225 corresponds to the blue-shifted peak of the southern cloud. In and around the area of the NGC 604 H \emissiontypeII region, several GMCs are distributed (Fig. 7).
Gratier et al. (2012) classified the GMCs into 3 types by the star formation activities, i.e., type A clouds are non-star-forming clouds without any indication of associated stars, type B clouds have embedded star formation with 8 and 24 m emission but not seen in H and FUV, and type C clouds have exposed star formation with detections in all these bands, similar manner to Fukui et al. (1999) and Kawamura et al. (2009) for those in the LMC. This classification is made by several testers independently, and the judgement is not necessarily unique but diverse for some GMCs. However, majority classification gives an idea of star formation activities of the clouds. The CO emission of GMC #276 has a peak velocity corresponding to the blue-shifted H \emissiontypeI component and is classified as type C. GMC #225 and #216 also belong to the blue-shifted clouds and the major classifications are type C, while another blue-shifted GMC #212 is classified as type A. On the other hand, GMC #209 is a red-shifted type A cloud, and GMC #211 a red-shifted type C cloud. GMC #210 and #218 have double peaked CO profiles and classified as type A or B. GMC #213 (type B/C), #214 (type A), #215 (type C), and #217 (type B) have H \emissiontypeI and CO lines of blended velocity components. Both the blue- or red-shifted clouds have a variety of properties in star formation. There is no clear difference in the star formation trend between the blue and red-shifted components. In the present region, about one quarter (27%) of the clouds are attributed to Type A. This is slightly large fraction compared to the statistics of the whole clouds sampled from the entire galaxy (15%).
4 Discussion
4.1 Kinematics of the H \emissiontypeI clouds
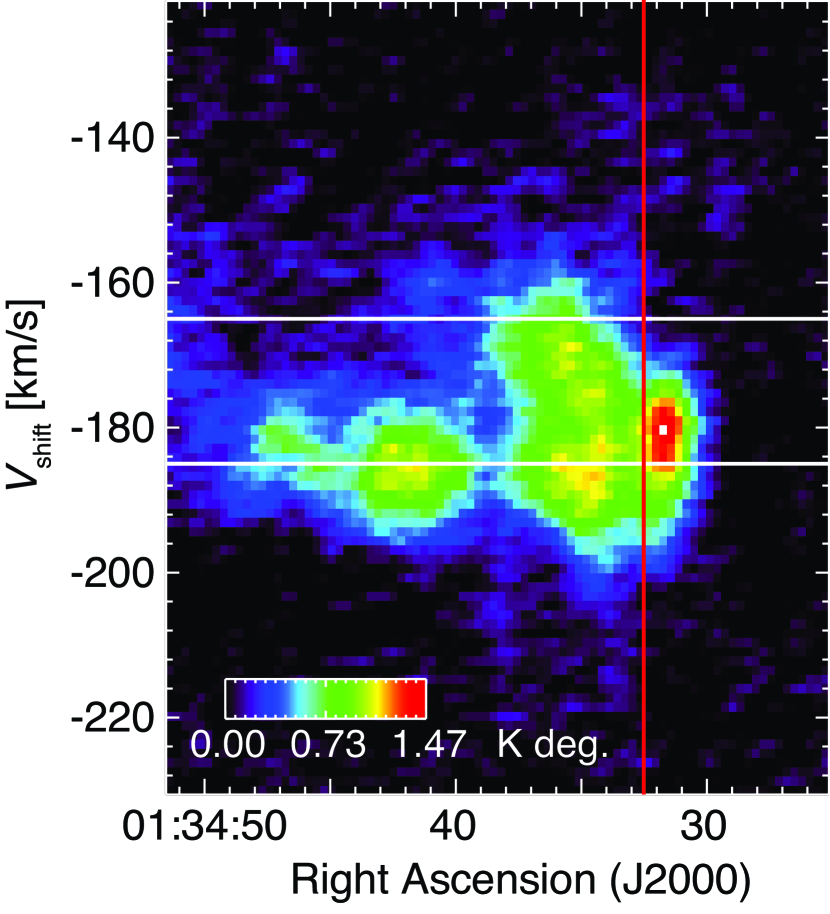
As shown above, the H \emissiontypeI clouds around NGC 604 have complex velocity distributions, and they consist of at least two discrete velocity components. Toward some positions, the spectra appear to be merged, having peak velocity between the two components. We consider the origin of the velocity structures. One possibility is the expanding motion energized by the feedback effect of the super star cluster NGC 604, which is surrounded by multiple shell-like structures of the H nebulosity. Tosaki et al. (2007) and Miura et al. (2010) discussed these phenomena from molecular data by single-dish and interferometric observations, respectively. The CO clouds exhibits indications of the interaction with the cluster as high 3–2/1–0 line ratio () along the H shell, implying the interaction of the molecular clouds with the expanding H \emissiontypeII region. The Star Formation Efficiency (SFE) shows decreasing trend with the distance from the NGC 604 cluster, implying the sequential star formation triggered by the feedback effects. The molecular clouds around NGC 604 have not been reported to exhibit expanding motion due to the feedback. Fig. 8 is the PV diagram focused on the cavity of the H \emissiontypeI cloud and the extension cloud to the east (see Fig. 5). Toward the H \emissiontypeI cavity, one can clearly recognize the depression of H \emissiontypeI intensity. This is a peace of evidence of feedback by NGC 604 affecting on the H \emissiontypeI cloud, likely as a photo-ionization. However, the velocity field does not appear to have a simple expanding motion in this PV diagram. To the west of the cavity (R.A. ), the H \emissiontypeI spectra appear to be single peaked, while those to the east (R.A. ) are multi-peaked (with blue- and red-shifted components) or having large velocity dispersions. The eastern extension cloud has blue-shifted velocity and connected to the blue-shifted component around the H \emissiontypeI cavity. In addition, the distributions of the 2 velocity components have much larger extent than the H nebulosity. If we make a simple assumption that the blue- and red-shifted H \emissiontypeI clouds are due to the expanding motion with the velocity of 10 km s-1, the kinetic energy of the clouds are estimated to be as much as erg. We thus conclude that the feedback effect of NGC 604 on the complex velocity structures of the H \emissiontypeI clouds is only limited for small surrounding area. If we consider kinetic energy injection by supernova (SN) explosions with efficiency (Kruijssen, 2012), it requires SNe within the age of NGC 604 cluster. The number is still much larger than that expected from the cluster scale. Remarkable energy of radiation is released from the massive stars. The radiation pressure is suggested to evacuate the interstellar medium from the galactic disk as the galactic winds if the cluster mass is more than , while the bubble radius is limited to be less than pc for the cluster mass of (Murray et al., 2011).
As an alternative possibility to explain the velocity fields, we propose a gas accretion scenario onto the spiral arm of the disk, that triggered active star formation of NGC 604. Similar to the case of the Magellanic bridge and the Magellanic stream, M31-M33 system is known to have diffuse gas bridge connecting the 2 galaxies (Braun & Thilker, 2004; Putman et al., 2009; Lockman et al., 2012). Grossi et al. (2008) detected H \emissiontypeI clouds in the proxy of M33, and suggest that they are HVCs accreting and fueling the M33 disk for star formation. If this is the case, the formation of NGC 604 is supposed to be triggered by the collision of infalling H \emissiontypeI clouds, similar to the case for R136 in the LMC. The velocity separation between the 2 components is km s-1 for R136, about a factor of 2-3 larger than the present case of NGC 604. Bekki (2008) demonstrated by numerical simulations that M31 and M33 had a close encounter at 4-8 Gyr ago, that resulted in forming gas streamer stretched by tidal force. van der Marel et al. (2012) predicted future encounters and possible mergers of M31, M33, and the Milky way in several Gyr. The orbital motion is, however, very complicated and also depend on the assumed initial conditions, particularly at the region close to the galactic disk. It is, therefore difficult to expect the relative velocity of the infalling gas with respect to the galactic disk. The blue-shifted H \emissiontypeI clouds dominating the extension feature is, however, candidate infalling gas from the morphological characteristics. The impact of the collisions between the H \emissiontypeI clouds seem to be significant, but the bulk energy of the collision is hard to be estimated.
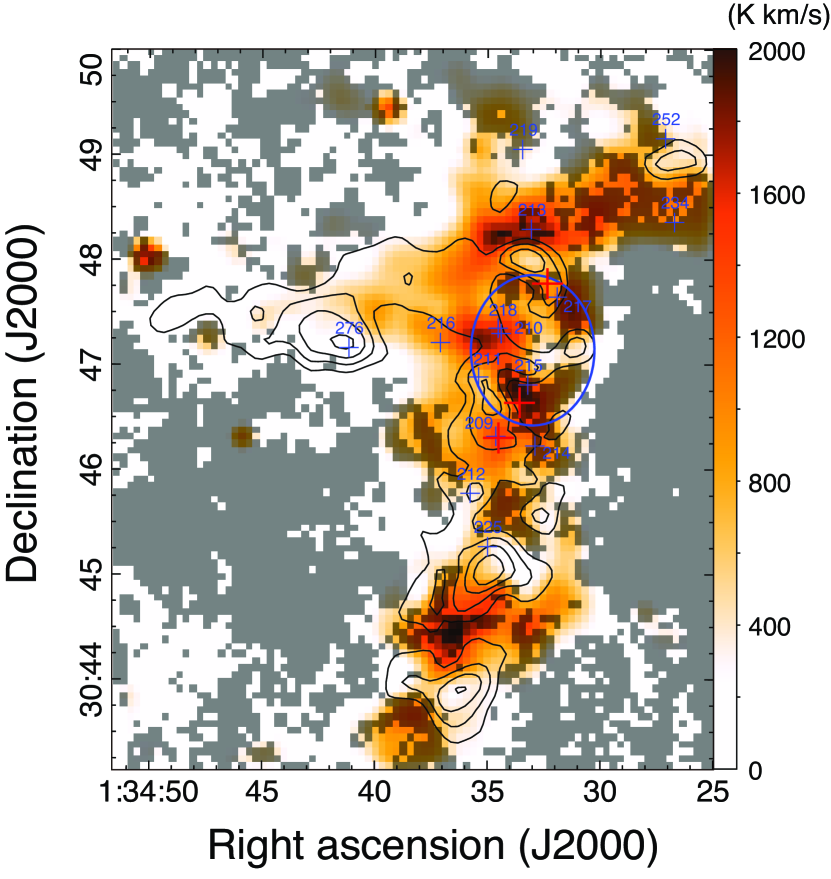
4.2 Formation of molecular gas by shock triggering
Massive molecular clouds are distributed around NGC 604 where active star formation is ongoing. Fig. 9 reveals the integrated intensity distribution of CO 1–0 by contours (Tosaki et al., 2011) overlaid on the H \emissiontypeI integrated intensity map. The CO clouds show concentrations in a region around the H \emissiontypeI cavity of NGC 604 with clumpy shapes peaked at 3 positions denoted by the red crosses. The distributions of the 2–1 line intensity, on the other hand, are slightly different, namely that GMC #215 and #217 have peak positions closer to the central cluster of NGC 604 than the 1–0 peak 2 and peak 3, while the position of peak 4 corresponds well to that of GMC #209 (see Fig. 7). There is another CO cloud with peak 1 on the east-west feature to the north of NGC 604 (hereafter the northern cloud), where H \emissiontypeI intensity is depressed as a complementary distribution with CO. Fig.10 illustrates the H \emissiontypeI and CO spectra sampled at the 3 peak positions of CO 1–0 together with those at the H \emissiontypeI cavity edge. At the peak 2 and 3, CO emission lines are detected at the intermediate velocity of the two H \emissiontypeI components, while at peak 4 the CO line is strong for the red-shifted component. The CO clouds are, on the other hand, detected also from the blue-shifted component at some positions around the H \emissiontypeI cavity such as position 5. Another CO cloud with peak 1, the CO emission has relatively blue-shifted velocity with respect to the H \emissiontypeI line. These imply that not only H \emissiontypeI, but the CO emission also has complex velocity fields.
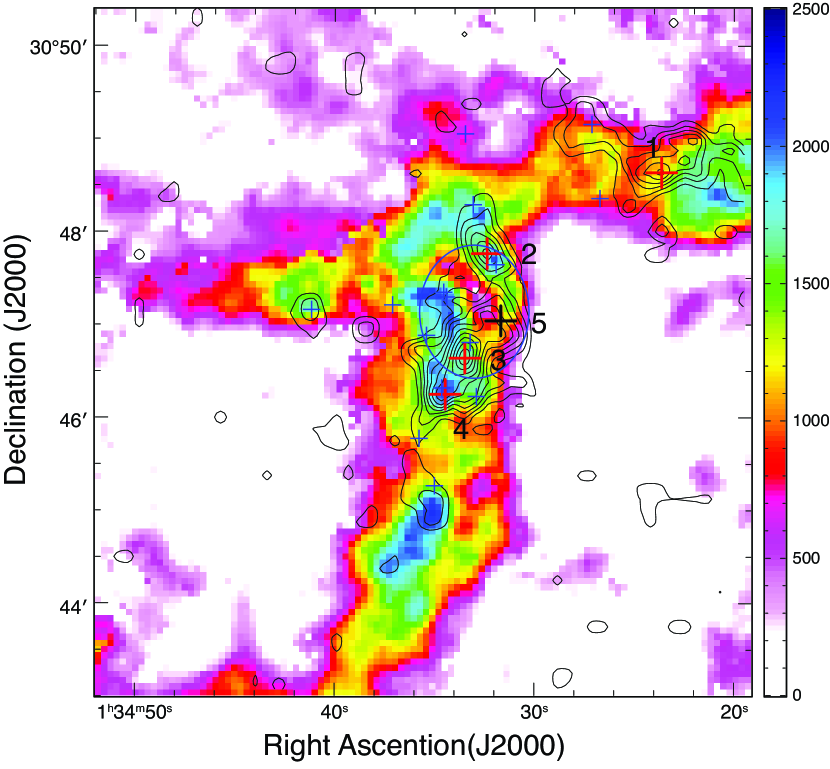
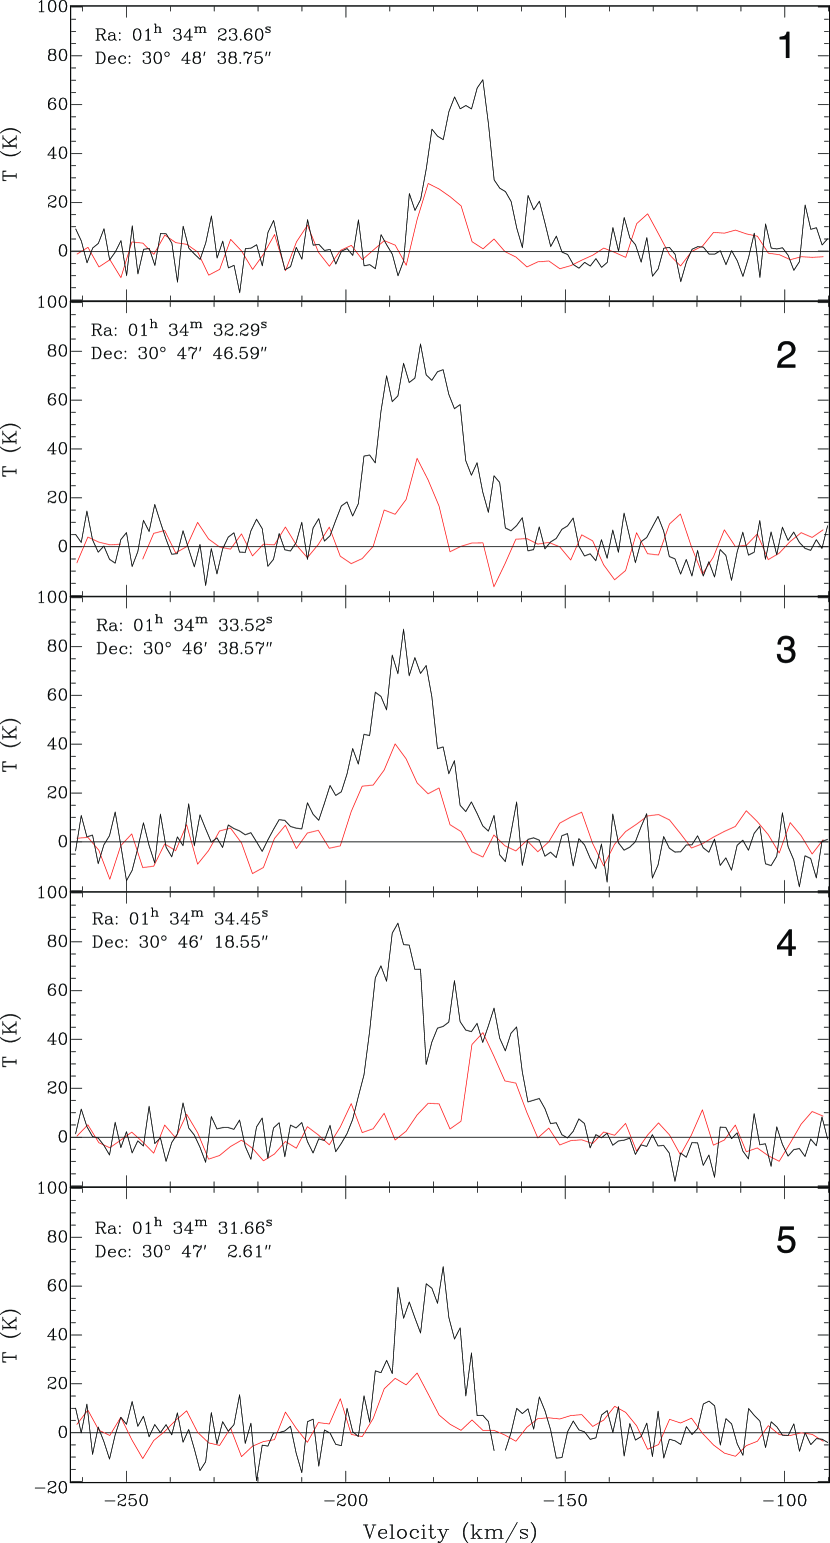
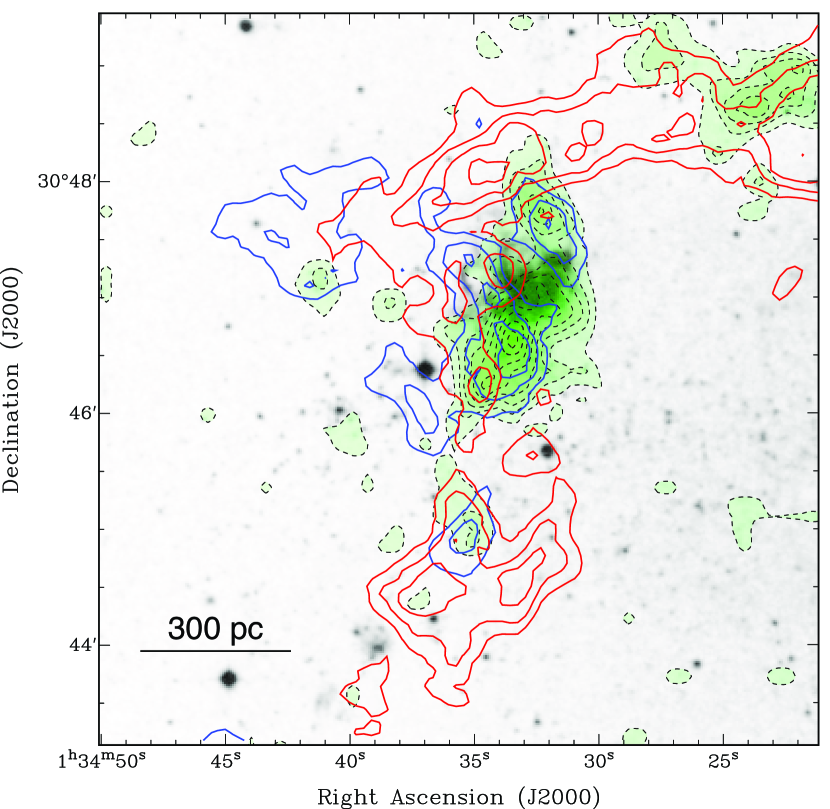
Fig. 11 demonstrates the CO cloud distributions compared with those of the red- and blue-shifted H \emissiontypeI clouds represented by the contours whose integrated velocity ranges are and , respectively. The CO emission is detected toward the region where the blue- and red-components are overlapping around NGC 604 and in the southern cloud. The northern cloud, on the other hand, does not have strong blue-shifted H \emissiontypeI emission in this velocity range, but the Gaussian decomposition succeeded to separate the blue-shifted component near GMC #252 (see Fig. 7).
As discussed above, it is suggested that the 2 velocity components of the H \emissiontypeI clouds seem to be due to the gas infall originated from the tidal interaction between M31 and M33, and the collision of the H \emissiontypeI clouds triggered the formation of NGC 604 super star cluster. If this is the case, the idea of molecular cloud formation by the cloud-cloud collision should be considerable. Numerical simulations of colliding gas flow and subsequent thermal instabilities have been investigated by many authors (Field et al., 1969; Wolfire et al., 1995; Koyama & Inutsuka, 2000, 2002; Hennebelle et al., 2007; Inoue & Inutsuka, 2012).
The dynamical crossing time of the two H \emissiontypeI clouds can be calculated from the size of the clouds divided by the relative collision velocity. If we assume the size of the colliding system as pc, the collision velocity of km s-1, it gives the crossing time of yrs. Within this period, molecular gas formation is feasible if the density is high enough (Goldsmith et al., 2007). Therefore it is suggested that collisions of H \emissiontypeI clouds could enhance the local molecular fraction of the interstellar gas, and accelerate the chemical evolution of the galaxy. The local enhancement of derived above could be affected by the gas ionization by the UV radiation from the massive star members of NGC 604, namely that the surrounding atomic gas is ionized by the cluster, while the inner molecular clouds are more shielded from the UV irradiation due to the higher column density. The molecular clouds have, however, much more extended beyond the extent of the optically visible H \emissiontypeII nebula. The effect of UV ionization seems to be limited, and we hence suggest molecular formation induced by the shock cloud compression triggered by the H \emissiontypeI cloud collisions.
4.3 Large-scale gas fueling by M31-M33 tidal interaction and triggering of supermassive clusters
As discussed above, the formations of molecular clouds and subsequently NGC 604 are likely to be triggered by collisions of H \emissiontypeI clouds. We suggest that these triggering is not an unique phenomenon for NGC 604, but works also for other giant H \emissiontypeII regions such as NGC 595, where we see similar double-peaked H \emissiontypeI profiles. As suggested by Grossi et al. (2008), continuous mass accretion fuel the galaxy with fresh gas, that keeps active star formation of M33. They identified H \emissiontypeI clouds with high relative velocity in the periphery of M33, and a blue-shifted cloud named AA16 in their catalog is located kpc away from NGC 604 to the east. This might be an indication of gas infall from galaxy halo or further outside. The origin of the infalling gas is unknown, but the H \emissiontypeI stream between M31 and M33 gives a hit of tidal interaction, similar to the formation scenario of the Magellanic stream. Such close encounters of galaxies, or mergers and collisions, are suggested to be common triggering phenomena for massive star cluster formation in the evolutional sequence of galaxies.
5 Summary
The H \emissiontypeI archival data obtained with VLA has been reanalysis, and their velocity structures have been investigated. Particularly for the region around the super star cluster NGC 604. The results are summarized below.
-
•
The velocity field of the H \emissiontypeI clouds around the super star cluster NGC 604 appear to have complex structures containing multiple velocity components indicated by double-peaked spectral profiles.
-
•
They are decomposed by fittings to the two component Gaussian functions, whose central velocities are typically separated by 20 km s-1.
-
•
Thus separated two velocity components are distributed far beyond the extent of the optically visible H \emissiontypeII region of NGC 604, and they do not show clear expanding velocity feature.
-
•
The atomic gas mass of each blue- and red-shifted component are estimated to be and , respectively.
-
•
Molecular clouds identified by CO observations are associated with H \emissiontypeI clouds of both velocity components, and the CO clouds are mainly distributed towards the overlapped regions of the 2 velocity H \emissiontypeI components.
-
•
It is suggested that the H \emissiontypeI clouds are infalling onto the galactic disk and collision of the clouds induced the molecular cloud formation in a few yrs.
-
•
As the mass accretion continues, the collisions of the H \emissiontypeI clouds trigger the formation of super-massive star cluster of NGC 604 in several Myr ago.
-
•
As suggested for the formation mechanism of R136 in the LMC, colliding H \emissiontypeI gas originated from the past close encounter and the tidal effect between galaxies can be a major trigger of super star cluster formation. This is consistent with the galaxy merger paradigm for the galaxy evolution scenario.
6 Funding
The work is supported by Japan Society for the Promotion of Science (JSPS) KAKENHI Grant Number JP15H05694.
Based on observations made with the NASA/ESA Hubble Space Telescope, and obtained from the Hubble Legacy Archive, which is a collaboration between the Space Telescope Science Institute (STScI/NASA), the Space Telescope European Coordinating Facility (ST-ECF/ESA) and the Canadian Astronomy Data Centre (CADC/NRC/CSA). The National Radio Astronomy Observatory is a facility of the National Science Foundation operated under cooperative agreement by Associated Universities, Inc. The Nobeyama 45-m radio telescope is operated by Nobeyama Radio Observatory, a branch of National Astronomical Observatory of Japan.
References
- Bekki & Chiba (2007a) Bekki, K., & Chiba, M. 2007, PASA, 24, 21
- Bekki & Chiba (2007b) Bekki, K., & Chiba, M. 2007, MNRAS, 381, L16
- Bekki (2008) Bekki, K. 2008, MNRAS, 390, L24
- Braun & Thilker (2004) Braun, R., & Thilker, D. A. 2004, A&A, 417, 421
- Corbelli & Schneider (1997) Corbelli, E., & Schneider, S. E. 1997, ApJ, 479, 244
- Eldridge & Relaño (2011) Eldridge, J. J., & Relaño, M. 2011, MNRAS, 411, 235
- Field et al. (1969) Field, G. B., Goldsmith, D. W., & Habing, H. J. 1969, ApJ, 155, L149
- Fujimoto & Sofue (1976) Fujimoto, M., & Sofue, Y. 1976, A&A, 47, 263
- Fujimoto & Noguchi (1990) Fujimoto, M., & Noguchi, M. 1990, PASJ, 42, 505
- Fukui et al. (1999) Fukui, Y., Mizuno, N., Yamaguchi, R., et al. 1999, PASJ, 51, 745
- Fukui et al. (2017) Fukui, Y., Tsuge, K., Sano, H., et al. 2017, PASJ, 69, L5
- Genzel et al. (1998) Genzel, R., Lutz, D., & Tacconi, L. 1998, Nature, 395, 859
- Goldsmith et al. (2007) Goldsmith, P. F., Li, D., & Krčo, M. 2007, ApJ, 654, 273
- Gratier et al. (2010) Gratier, P., Braine, J., Rodriguez-Fernandez, N. J., et al. 2010, A&A, 522, A3
- Gratier et al. (2012) Gratier, P., Braine, J., Rodriguez-Fernandez, N. J., et al. 2012, A&A, 542, A108
- Gratier et al. (2017) Gratier, P., Braine, J., Schuster, K., et al. 2017, A&A, 600, A27
- Grossi et al. (2008) Grossi, M., Giovanardi, C., Corbelli, E., et al. 2008, A&A, 487, 161
- Hennebelle et al. (2007) Hennebelle, P., Audit, E., & Miville-Deschênes, M.-A. 2007, A&A, 465, 445
- Inoue & Inutsuka (2012) Inoue, T., & Inutsuka, S.-i. 2012, ApJ, 759, 35
- Kawamura et al. (2009) Kawamura, A., Mizuno, Y., Minamidani, T., et al. 2009, ApJS, 184, 1
- Koyama & Inutsuka (2000) Koyama, H., & Inutsuka, S.-I. 2000, ApJ, 532, 980
- Koyama & Inutsuka (2002) Koyama, H., & Inutsuka, S.-i. 2002, ApJ, 564, L97
- Kruijssen (2012) Kruijssen, J. M. D. 2012, MNRAS, 426, 3008
- Lockman et al. (2012) Lockman, F. J., Free, N. L., & Shields, J. C. 2012, AJ, 144, 52
- McConnachie et al. (2004) McConnachie, A. W., Irwin, M. J., Ferguson, A. M. N., et al. 2004, MNRAS, 350, 243
- Miura et al. (2010) Miura, R., Okumura, S. K., Tosaki, T., et al. 2010, ApJ, 724, 1120
- Murai & Fujimoto (1980) Murai, T., & Fujimoto, M. 1980, PASJ, 32, 581
- Murray et al. (2011) Murray, N., Ménard, B., & Thompson, T. A. 2011, ApJ, 735, 66
- Paturel et al. (2003) Paturel, G., Theureau, G., Bottinelli, L., et al. 2003, A&A, 412, 57
- Putman et al. (2009) Putman, M. E., Peek, J. E. G., Muratov, A., et al. 2009, ApJ, 703, 1486
- Relaño & Kennicutt (2009) Relaño, M., & Kennicutt, R. C., Jr. 2009, ApJ, 699, 1125-1143
- Rosolowsky & Leroy (2006) Rosolowsky, E., & Leroy, A. 2006, PASP, 118, 590
- Noguchi & Ishibashi (1986) Noguchi, M., & Ishibashi, S. 1986, MNRAS, 219, 305
- Regan & Vogel (1994) Regan, M. W., & Vogel, S. N. 1994, ApJ, 434, 536
- Tenorio-Tagle et al. (2000) Tenorio-Tagle, G., Muñoz-Tuñón, C., Pérez, E., Maíz-Apellániz, J., & Medina-Tanco, G. 2000, ApJ, 541, 720
- Tosaki et al. (2007) Tosaki, T., Miura, R., Sawada, T., et al. 2007, ApJ, 664, L27
- Tosaki et al. (2011) Tosaki, T., Kuno, N., Onodera, S. M., Rie, et al. 2011, PASJ, 63, 1171
- van der Marel et al. (2012) van der Marel, R. P., Besla, G., Cox, T. J., Sohn, S. T., & Anderson, J. 2012, ApJ, 753, 9
- Wilson & Scoville (1990) Wilson, C. D., & Scoville, N. 1990, ApJ, 363, 435
- Wolfire et al. (1995) Wolfire, M. G., Hollenbach, D., McKee, C. F., Tielens, A. G. G. M., & Bakes, E. L. O. 1995, ApJ, 443, 152
- Yang et al. (1996) Yang, H., Chu, Y.-H., Skillman, E. D., & Terlevich, R. 1996, AJ, 112, 146