Surface reconstruction, premelting, and collapse of open-cell nanoporous Cu via thermal annealing
Abstract
We systematic investigate the collapse of a set of open-cell nanoporous Cu (np-Cu) with the same porosity and shapes, but different specific surface area, during thermal annealing, via performing large-scale molecular dynamics simulations. Surface premelting is dominated in their collapses, and surface premelting temperatures reduce linearly with the increase of specific surface area. The collapse mechanisms are different for np-Cu with different specific surface area. If the specific surface area less than a critical value ( 2.38 nm-1), direct surface premelting, giving rise to the transition of ligaments from solid to liquid states, is the cause to facilitate falling-down of np-Cu during thermal annealing. While surface premelting and following recrystallization, accelerating the sloughing of ligaments and annihilation of pores, is the other mechanism, as exceeding the critical specific surface area. The recrystallization occurs at the temperatures below supercooling, where liquid is instable and instantaneous. Thermal-induced surface reconstruction prompts surface premelting via facilitating local “disordering” and “chaotic” at the surface, which are the preferred sites for surface premelting.
I I. Introduction
Nanoporous metals, with open-cell network structures, are comprised of interconnected ligaments of nanometer-scale characteristic dimenstion, resulting in a large surface area. Their stabilities and morphological properties determine the promising applications as sensorsHu et al. (2008), actuators Biener et al. (2009), battery electrodes Snyder et al. (2010), catalysts Erlebacher et al. (2001), and in biomedicine Swan et al. (2005). During thermal annealing, microstructural changes, including heating-induced void collapse and the reduction in volume can be observed by implementing the atomic-scale simulations Crowson et al. (2007, 2009); Kolluri and Demkowicz (2011) and experiments using electron microscopy and X-ray diffractions Parida et al. (2006); Kucheyev et al. (2006); Seker et al. (2007); Jin et al. (2009); Chen-Wiegart et al. (2012); Frenkel et al. (2012). Surface melting, via accelerating the diffusion of atoms in nanoporous metals, is a dominant factor to prompt the occurrence of the pinch-off in ligament, the smooth-out for surface curvature, and the formation of enclosed voids in ligaments Hakamada and Mabuchi (2009); Chen et al. (2010). Consequently, significant insights of the phenomenology and underlying mechanisms of surface melting in metallic nanoporous, such as the relation between surface configuration and microstructure evolution, are key issues.
Surface melting was believed to be impossible to superheat a crystal above its equilibrium melting point, indicating a premelting Cahn (1986); Lipowsky et al. (1989); Curtin (1989), which has been disproved by the subsequent studies on melting of instable nanoparticles Lai et al. (1996); Guisbiers and Buchaillot (2009); Yang and Li (2008); Zhu et al. (2009); Qi and Wang (2004); Qi (2005, 2016) and other nanostructures Shin et al. (2007); Li et al. (2008) in experiments and theories. Surface premelting is also observed in nanoporous materials, and melting temperature was related to the size of pores. A roughly proportional function is shown between the melting temperature and reciprocal of averaged pore-size, as predicted by Gibbs-Thomson equation Evans and Marini Bettolo Marconi (1987), which is consistent with the experimental reports using nuclear magnetic resonance (NMR) STRANGE (1998) and X-ray diffraction techniques Morishige and Nobuoka (1997) and the atomistic simulation studies Miyahara and Gubbins (1997); Gubbins et al. (2014); Coasne et al. (2013); Coasne (2015). These studies enriched our knowledge of the melting in nanoporous materials. However, the thermal-induced variety of surface microstructure, its effect on the melting, and the collapse processes of nanoporous remain to be revealed.
In this work, we implement a systematic study on the melting behavior in open-cell nanoporous Cu (np-Cu), with the same porosity and shape approximately, and different specific surface areas by performing large-scale molecular dynamics (MDs) simulations. Cu is chosen owing to its accordance between experiments and simulations Japel et al. (2005); Trautt et al. (2012); Zheng et al. (2007), as well as its accurate embedded-atom method potential Mishin et al. (2001), which well describes the melting of Cu Zheng et al. (2007). Our simulations reveal that the collapse of np-Cu is prompted via surface melting, or melting and following recrystallization, which is dependent on the specific surface area. In particular, our results show that surface prefers to melt at the disordering sites as the result of surface reconstruction as the temperature elevation. The MD methodology are presented in Sec.II, and results and discussion in Sec. III, followed by summary and conclusions in Sec.IV.
| Group | Size ( 106) | () | ( 104 nm2) | ( 104 nm3) | (nm-1) | Dimension (nm3) | |||
|---|---|---|---|---|---|---|---|---|---|
| Group | 2.33 | 58.19 | 0.45 | 2.44 | 0.18 | 1.00 | 36.1536.15 | ||
| 2 | 2.33 | 58.22 | 0.91 | 2.45 | 0.37 | 0.96 | |||
| 4 | 2.32 | 58.11 | 1.89 | 2.42 | 0.78 | 0.93 | |||
| 6 | 2.33 | 58.22 | 2.92 | 2.43 | 1.20 | 0.89 | |||
| 8 | 2.32 | 58.07 | 4.08 | 2.45 | 1.67 | 0.81 | |||
| 10 | 2.35 | 58.70 | 5.11 | 2.40 | 2.13 | 0.70 | |||
| 11 | 2.33 | 58.19 | 5.77 | 2.40 | 2.38 | 0.67 | |||
| 12 | 2.33 | 58.18 | 6.36 | 2.42 | 2.63 | 0.59 | |||
| 13 | 2.33 | 58.19 | 6.99 | 2.40 | 2.94 | 0.52 | |||
| 14 | 2.33 | 58.22 | 7.58 | 2.42 | 3.13 | 0.48 | |||
| Group | 1 | 0.29 | 58.22 | 0.12 | 0.32 | 0.37 | 0.96 | 18.0818.0818.08 | |
| 2 | 0.29 | 58.68 | 0.25 | 0.32 | 0.77 | 0.93 | |||
| 3 | 0.29 | 58.22 | 0.38 | 0.31 | 1.20 | 0.81 | |||
| 4 | 0.29 | 58.07 | 0.51 | 0.31 | 1.67 | 0.78 | |||
| 5 | 0.29 | 58.70 | 0.64 | 0.30 | 2.13 | 0.67 | |||
| 6 | 0.29 | 58.11 | 0.80 | 0.30 | 2.67 | 0.59 | |||
| 7 | 0.29 | 58.22 | 0.95 | 0.30 | 3.14 | 0.52 |

II II. Methodology
We utilize the Large scale Atompic/Molecular Massively Parallel Simulator (LAMMPS) Plimpton (1995) and an accurate embedded atom method potential, proposed by Mishin Mishin et al. (2001), describing the atomic interaction in Cu, for our MD simulations. The potential has been fitted to reproduce physical properties such as stacking fault energy and elastic moduli, and widely used in lots of MD simulations, inculding melting Li et al. (2015); Wang et al. (2016), equation of state Bringa et al. (2004), and plastic deformation Bringa et al. (2005).
To construct the MD models, we first use LAMMPS to generate a single crystal cubic bulk oriented in the directions, and the dimensions are nm3. Then the diamond-liked open-cell np-Cu Cui and Chen (2017) is obtained by removing atoms from the bulk crystal, which obey
| (1) | ||||
where , , and are the fractional coordination of removed atoms, (-2.0 2.0) and are two key factors to control the shape of nanopores in bulk, relative mass density (, the density ratio of the np-Cu with respect to full density Cu), and specific surface area (), defined as surface area () to solid volume (). The specific surface area of the np-Cu structure is computed with surface analysis Stukowski (2010). Increasing and keeping constant, =-0.2,, the shape and almost keep invariant, 0.582, and increases as the ligaments narrow. We here construct 10 np-Cu with different specific surface area, and three representative configurations are shown in Fig. 1. The similar np-Cu with the smaller system size are also attempted to check possible size effects, which comprise about 0.29 million atoms with dimensions of 18.08 18.08 18.08 nm3. The details of all np-Cu samples are summarized in Table 1.
The configurations are first relaxed with the conjugate gradient method, and then melting simulations are performed under three-dimensional periodic boundary conditions with the constant-pressure-temperature ensemble. Temperature, , is controlled with a Hoover therostat, and the isotropic pressure, with isotropic volume scaling. The solids undergo incremental heating (300–1800 K) into the liquid regime at ambient pressure, and the temperature increment is 50 K per 100 ps at high temperatures. The time step for integrating the equation of motion is 1 fs. At each temperature, the run duration is 100 ps.
The local structure around an atom is characterized with the common neighbor analysis Faken and Jonsson (1994); Tsuzuki et al. (2007), based on which atoms are classified into face-centered cubic (FCC), hexagonal close-packed (HCP), or unknown types. Order parameter, , introduced by Morris and Song Morris and Song (2003) is utilized to identify atoms in liquid and solid structures, which has been successfully used to describe the micromorphological and dynamics properties of melting under both equilibrium Zheng et al. (2007); Li et al. (2015) and non-equilibrium conditions He et al. (2013). For each an atom, it is defined as
| (2) |
where is the coordination number and vector refers to the distance between the atom and its nearest neighbors. The set of direction vector satisfying =1 is chosen for any vector connecting nearest neighbors in perfect fcc solid. The average local order parameter, averaged among the atom and its nearest neighbors, is adopted to better describe local disordering. The global order parameter,
| (3) |
which is the average of over all atoms in the system, is also used in the following discussion.
To definitively distinguish a melt (liquid) from crystalline and amorphous solids, self-diffusion coefficient, , is calculated with Einstein expression Rapaport (1995),
| (4) |
from mean square displacement MSD,
| (5) |
Here denotes time, is the atomic position, and denotes averaging over ensemble only.
III III. Results and discussion
III.1 Collapse of np-Cu during thermal annealing
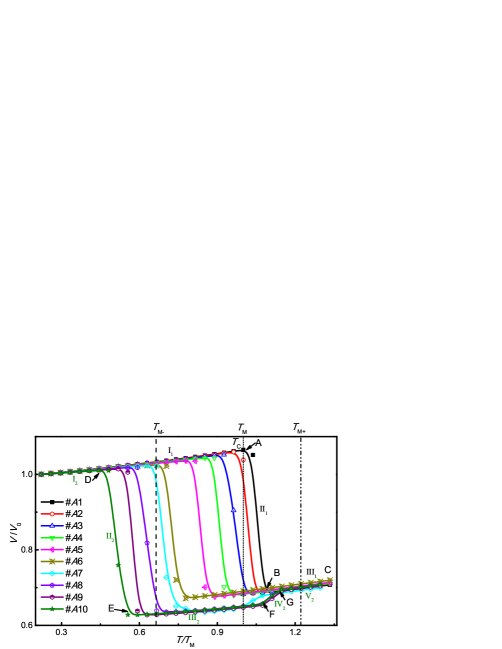
Our simulations present similar melting phenomena for the np-Cu with different system size, that is the system size effect can be neglected for this work. We here use np-Cu samples with the larger system (36.15 nm3, Group ) for the following discussion. The initial system-averaged volume , at 300 K, for all nanoporous, are about 4.66104 nm3. We here first clarify the definition of three temperatures, , and , used in this work. is defined as the equilibrium melting temperature of a defect-free bulk Cu system without surface or other defects, which is about 1350 K Samanta et al. (2014), agreement with that in experiment (1356 K) Brillo and Egry (2003). and are the limit temperature of supercooling liquid and superheating solids under equilibrium conditions, which are about 900 K and 1650 K for Cu, respectively.
Figure 2 shows the temperature evolutions of system-averaged volume, , for 10 np-Cu samples (). With the increase of temperature, undergoes a linear increase nearly at first (I1 and I2) until an abrupt drop in the slope (II1 and II2), owing to the “onset” of collapse for all the nanoporous Cu. The np-Cu collapse could be resulted from coarsening of nanopores Kolluri and Demkowicz (2011) or premelting Zheng et al. (2007); Li et al. (2015) from the surface, since temperature lies well below the equilbrium melting temperature Jin et al. (2001); Forsblom and Grimvall (2005). The temperatures for collapse, , are observed to decrease from 1350 K (, D for ) to 650 K (, A for ) as the increase of specific surface area, (see TABLE 1).
Furthering to increase temperatures, two different evolution modes are shown for the nanoporous Cu with different , and a critical specific surface area , is about 2.38 nm-1. For np-Cu with (), a linear rising stage (III1) follows the completion of collapse (B), and their functions are almost same with each other. For np-Cu with (), first increases linearly (III2) after collapse completing (E), which is below the functions at stage III1 for np-Cu . Then an abrupt increase stage of (IV2) is observed as / 1, followed by a stage of V2 as increasing linearly and slowly, which shows the similar processes with solid melting Zheng et al. (2007); Li et al. (2015). It is believed to be solid phases for the np-Cu samples at the stage of III2, while partial melting at IV2 and completed liquid phases at V2 stages. Interestingly, functions at III1 and V2 are observed to well coincide with each other, implying the completed melting during the stage III1. It is deduced that the melting of nanoporous dominates the collapse (II1) for np-Cu . During the nanoporous melting, surface premelting should be preferred owing to its instability and higher energy Cahn (1986). However, surface melting is inadequate to describe the collapse (II2) in np-Cu , owing to the solid stage of III2. We here assume a melting and recrystallization process occurs to accelerate the collapse of nanoporous Cu at II2 stage.
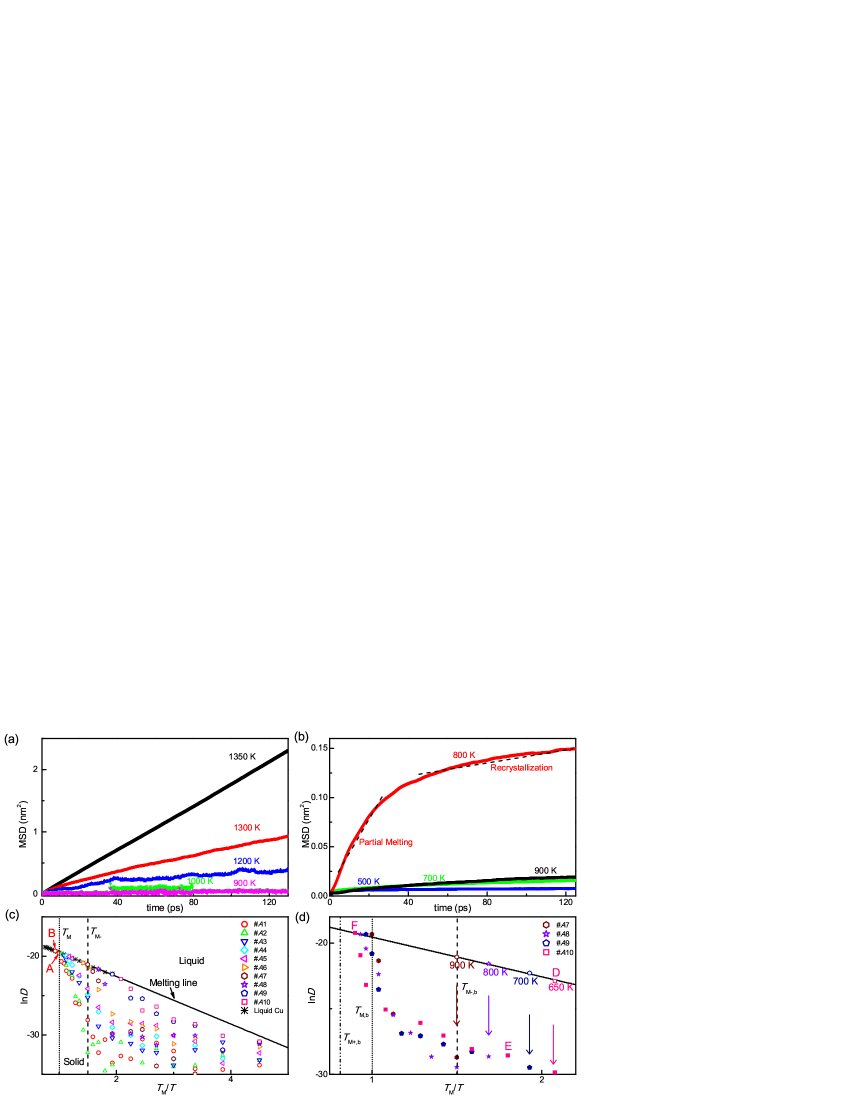
To identify the surface premelting and recrystallization processes in Cu nanoporous, self-diffusion coefficients, , for the surface atoms (the disordering atoms in Fig. 1), are calculated from MSD at different heating temperatures. Here, two MSD evolutions during the extended equilibration period at different temperatures, for np-Cu and , are taken as the examples shown in Fig. 3 (a) and (b), respectively. For np-Cu , MSDs() increase linearly with different slopes, , at different temperature. The calculated increases from 2.13 10-11 to 2.95 10-9 m2 s-1, as increases from 900 to 1350 K. However, MSD() exhibits two distinct stages for np-Cu at 800 K: rapid increase during the first 0–40 ps ( m2 s-1), which is attributed to a partial melting of surface, and followed by slower increase ( m2 s-1), owing to the crystallization of supercooled melts. In contrast, MSD(), at = 500, 700 and 900 K, remain approximately constant, with m2 s-1. The difference of orders of magnitude in between different temperatures supports the partial melting of surface region for different Cu nanoporous.
To further verify the surface melting, we then compare diffusion coefficients at different temperatures with those of liquid copper at zero pressure [Fig. 3(c) and (d)]. Temperature is varied for liquid copper in order to obtain an Arrhenius plot, and its extention to means supercooled liquid, which can be considered as the melting line. Under/in melting line, it represents a liquid; otherwise a solid. At low temperatures, ln for np-Cu fluctuate around a constant value, 10-14 m2 s-1, but follow an approximately linear increase at high temperatures owing to the acceleration of surface diffusion. As , ln at are located in the melting line, implying the commence of surface melting [Fig. 3(c)]. Further to increase temperatures (), ln for np-Cu are also observed to lie in melting line, supporting the deduction above in which surface melting promotes the collapse of surface (II1 in Fig. 2). However, ln for np-Cu are observed to decrease abruptly at [Fig. 3(d)], which means the recrystallization of liquid. Then it can be concluded that surface melting and recrystallization is indeed dominated in the np-Cu collapse for thermal-annealed np-Cu . Interestingly, their , suggesting the instable liquid phase. During stage III2, ln always lie below the melting line, and are shown to increase via the incremental heating until Cu samples melt again. The second melting temperatures for Cu nanoporous are observed to be , indicating a superheating which occurs in defect-, or surface-free bulk Cu crystals Zheng et al. (2007). All the second melting temperature for Cu samples are , implying the existence of defects Li et al. (2015), and it will be discussed below.
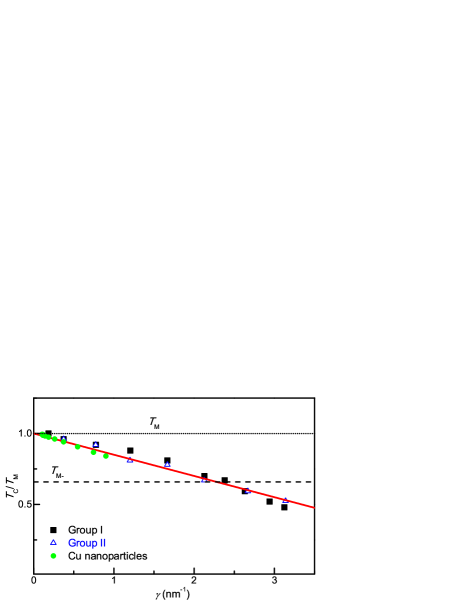
Based on the results above, the relations of surface premelting temperature (or collapse temperature) and specific surface area, , for np-Cu samples are obtained, as shown in Fig. 4. Two sets of np-Cu samples with different system size (Group and ) are considered. An approximately linear decrease of melting temperature () of np-Cu is observed as increasing , which is in accordance with the results of Cu nanoparticles Zhu et al. (2009). Interestingly, the effect of system size can be neglected, owing to the same melting temperature for Group and np-Cu with the same . Fitting the function of – with Eq. 16 in Appendix, it shows a perfect consistence with the results of nanoparticles and nanoporous. Consequently, the melting of nanostructures is dependent strongly on specific surface area, and we can predict their melting temperatures from the function. In addition, it also implies that only surface melting occurs for the nanostructures with melting points , while a transient melting and following recrystallization predominates for ones with melting points below .

III.2 Surface melting processes
To reveal the surface melting of np-Cu, it is necessary to characterize the nucleation and growth process at atomistic scale. The global order parameter, , an important factor to distinguish the liquid and solid phase, is computed to describe the nucleation and growth of melting in nanoporous Cu (Fig. 5). For a bulk Cu in liquid stage, ; we thus define an atom as a “strict liquid” with high disordering and mobility Levitas and Ravelo (2012), if . Liquid atoms tend to aggregate into the clusters, leading to the liquid growth Zheng et al. (2007). The cluster analysis Stukowski (2010) of liquid atoms is conducted here. When two atoms are within the nearest-neighbor distance with each other, they can be considered as belonging to the same cluster, whose size is defined as the number of liquid atoms within a cluster. Shown in Figs. 6–7 are the configuration of liquid clusters during melting. Here, two typical nanoporous (1 and 8) are taken as the examples. Their melting modes are different as their different specific surface area and , respectively, corresponding to their different collapse modes discussed above.
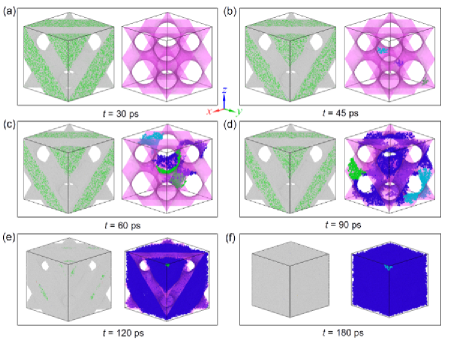
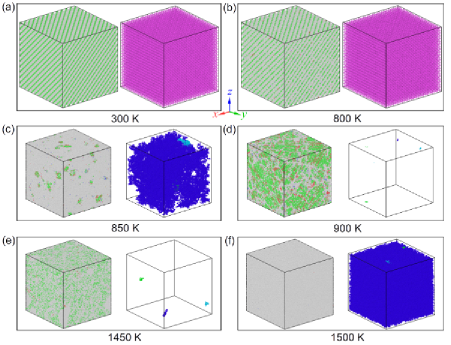
For np-Cu , decreases steadily and slowly at first, and then drops abruptly from 0.62 to 0.12, which means the complete melting of solid in the samples [Fig. 5(a)]. The transition temperature is 1350 K (), consistent with the collapse temperature, above (Fig. 2). We also compute for np-Cu by furthering heating at 1350 K with the running duration of 320 ps [Fig. 5(b)], to describe the evolution process of transition. Continuous heating precipitates the nucleation of surface melting, and starts to decrease at 45 ps from 0.62 to 0.12. Sequentially pronounced fluctuations, stable nuclei, and catastropic growth are shown during the process (Fig. 6). Subcritical nuclei appear at the outer surface via fluctuation in locations and times ( 60 ps, Fig. 6), and supercritical nuclei then become stablized and grow at ps. Then liquid clusters grow towards interior grains, giving rise to the void shrink and ligament pinch-off in nanoporous Cu ( = 90 and 120 ps, Fig. 6). Finally, all voids in np-Cu are observed to be filled by liquid atoms, leading to a completed collapse of surface and the reduction of volume at 180 ps. The melting completes as ps, with an invariable approximately, 0.12.
For np-Cu , interestingly, two decrease stages in are presented as the incremental heating [Fig. 5(c)], different with np-Cu . The first reduction takes place at 800 K, where reduces rapidly from 0.72 to 0.24 owing to the nucleation of surface melting, followed by the collapse of nanoporous. At this stage partial atoms in np-Cu transform from solid/quasisolid atoms to liquid/quasiliquid atoms, accelerating the annihilation of pores and collapse. The processes of nucleation and growth for surface melting are shown in Fig. 7. These liquid or quasiliquid atoms can be crystallized again as K, and increases from 0.24 to 0.66. The dynamic processes of melting and crystallization can also be described by [Fig. 5(d)]. The surface-free bulk Cu crystal, containing such defects as stacking faults, twins and disordering solids (characterized by CNA), is formed as the completion of crystallization [900 K (), Fig. 7]. These defects are the sources of melting as heating in further, which accelerates the melting of bulk Cu crystal and reduces its superheating, = 1450 K (), verifying the assumption above. Then drops rapidly again from 0.62 to 0.12 as the occurrence of completed melting at 1500 K [, Fig. 7].
III.3 Surface reconstruction
The phenomena of surface premelting and collapse globally in the np-Cu are presented above, and it shows a strong dependent of specific surface area, . It is known that the melting of defects, such as grain boundaries, is related to microstructure evolution, which is significant to understand the phenomenology and underlying mechanism Alsayed et al. (2005); Berry et al. (2008). Thus we next examine detailed surface microstructure evolutions via thermal annealing. It also reveals the possible implications and connections to surface premelting. Here np-Cu is taken as the example as shown in Figs. 8–9.
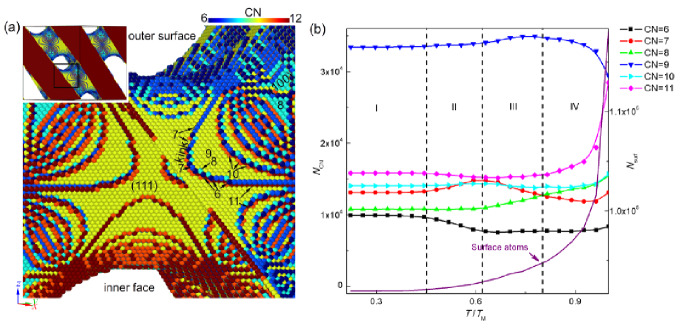
Coordination analysis Stukowski (2010) are performed after implementing quench, to describe the surface microstructure. The atoms with coordination number, CN 12, are defined as the surface atoms here, as shown in Fig. 8(a). In our constructed np-Cu, it is observed that the coordination number of the surface atoms at (100) facet and the close-packed (111) facet are CNs(100) = 8, and CNs(111) = 9 Liu et al. (2002), respectively. Several kinked-lines Wang et al. (2013) are formed between two (111) (or 100) facets, where the atoms with CNkl,ed = 7 at the outer surfaces, considered as the edge of facets Deng et al. (2010); while CN at the subsurfaces. Between two edges, some kinked points, where the atoms with CN and CNkp,inner = 8, are distributed at the out and inner edges on the surfaces, defined as vertices Liu et al. (2009); and CNkp,sub = 10 at the subsurfaces.
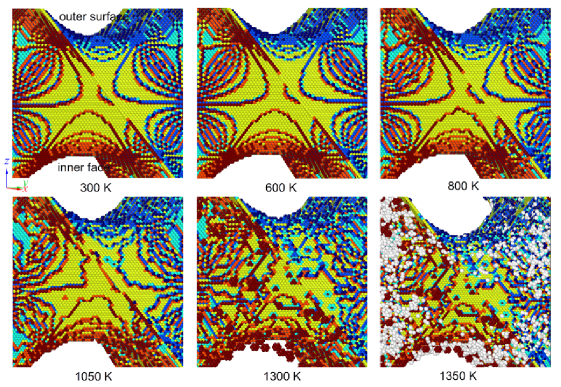
Increasing ambient temperature, it accelerates the diffusion of atoms, and more subsurface atoms could diffuse towards the surface, giving rise to the increase of surface atoms number (), as shown in Fig. 8(b). It simultaneously triggers the surface reconstruction, leading to the change of local structure and surface energy for nanoporous. The evolution of surface rearrangement is shown in Fig. 8(b). It is observed that surface reconstruction undergoes about four stages, denoted as I–IV. At the first stage (stage I, ), surfaces keep smooth and stable [600 K (), Fig. 9]. All of the atoms with different CN () are almost constant. Further to raise the temperature (0.44 0.63, stage II), the kink sites, including edge of facets (kinked lines) and vertices (kinked points) first change, leading to an apparent decrease of for atoms at vertices with CN, but a rise of for atoms at edge with CN. The other surface sites almost keep stable. Thus the surfaces remain smooth, except the transformation of kinked lines from the curve-shaped to some continuous-steps-shaped ones (800 K, Fig. 9). Then of edge atoms (CNkl,ed = 7) decrease at stage III (0.63 0.81), giving rise to the increase of for the atoms at (111) facets (CNs(111) = 9). The kinked lines become shorter and “chaotic”, in contrast to the regular straight edges, causing the surface roughening [1050 K (), Fig. 9]. As 1100 K (,stage IV), for atoms at edged lines and (111) facets decrease distinctly, accompanied by the substantial increase of for atoms CN = 11. Dense of “chaotic” and shorter kinked lines are distributed on the surfaces [1300 K (), Fig. 9], accelerating the surface roughening. Surface roughening then facilitates the nucleation and growth of vacancies in the subsurface and even the interior of crystals, which boost the inner disordering.
Surface melting begins as further to increase temperatures, and prefers to nucleate at the “chaotic” sites with dense of kinks [1350 K (), Fig. 9], where the maximum “disordering” and free volume are presented, and the energy barrier to melt nucleation is the lowest, rather than smooth and “ordered” (111) facets at 1350 K. Melt propagates along the surface and then spreads into grain interiors by absorbing vacancies clusters or interstitial atoms near the inner faces. For other np-Cu samples with higher , it shows the similar surface reconstruction phenomena, although their melting temperatures are different.
IV IV. Conclusion
Our MD simulations demonstrate an apparent effect of specific surface area, on the collapse for a set of open-cell nanoporous Cu with the same porosities and shapes almost, during thermal annealing. Surface premelting dominates in their collapses, and surface premelting temperatures reduce linearly with increasing the specific surface area. The collapse mechanisms are different with different specific surface area. For np-Cu with the smaller specific surface area ( 2.38 nm-1), surface premelting is the cause to lead their collapse. While preferential surface premelting and following recrystallization predominate the pinch-off in np-Cu with 2.38 nm-1, where recrystallization arises at temperatures below supercooling () owing to the instability and instance for liquid. Thermal-induced surface reconstruction prompts surface premelting by accelerating local “disordering” and “chaotic” in the surface, which are the preferred sites for surface premelting.
V acknowledgment
This work was partially supported by the NSFs of China (Nos. 11672254, 51301066, and 51501063) and NSF of Hunan Province (Nos. 13JJ4071 and 14JJ2080). We would also like to acknowledge the support of the computation platform of the National SuperComputer Center in Changsha (NSCC).
VI Appendix
To describe the nucleation of melting in nanostructures, the Gibbs-Thomson equation, derived from classical nucleation theory (CNT) Porter and Easterling (1992), is used. For a solid spherical nanoparticle with the size of , the change of Gibbs free energy during melting is expressed as Kashchiev (2000); Wu et al. (2016)
| (6) |
where is the solid-liquid interfacial energy; is Gibbs free energy difference per unit volume between solid and liquid phase, and
| (7) |
here is the latent heat of fusion, and is the molar volume of solid phase. When maximizing , Gibbs-Thomson equation, describing the relation of particle size and corresponding melting temperature, is obtained Jackson and Mckenna (1990); Jones (1974)
| (8) |
and
| (9) |
For a nanoparticle, is size dependent Bai and Li (2005); Liang et al. (2002), and
| (10) |
Here is the ideal gas constant, 8.314 J mol-1 K-1; is the atomic diameter, 0.256 nm for Cu; and is the vibrational contribution of overall melting entropy of bulk crystals, which is a weak function of , and could be ignored as a first-order approximation Guisbiers and Buchaillot (2009), that () () 7.85 J mol-1 K-1 Zhu et al. (2009). Substituting () and () into Eq. 9, we have
| (11) |
It reasonably matches the experimental data with nm Castro et al. (1990); Dick et al. (2002) as the crystal retains its bulk values of , and Jackson and Mckenna (1990); Peters et al. (1998). However, it fails for small-sized nanoparticles, adopting nonspherical shapes Sun and Xia (2002); Barnard et al. (2009); Xia et al. (2009) with a large . Here, a shape factor Qi and Wang (2004); Qi (2016), =, where is the surface area for a spherical nanoparticle and is the surface area of a nonspherical nanoparticle with the same volume as spherical nanoparticle, is used to describe the shape effect of nanoparticles. For a solid nonspherical particle with size of and shape factor of , its surface area . Combined with Eqs. 6–9, the melting temperature of nonspherical nanoparticle is
| (12) |
The melting temperature of np-Cu with the identical sized nanopores, should be equal to that for the nanoparticle with the same size and shape. For a closed-cell np-Cu containing spherical nanopores with an identical size, , we assume that and are the volume and surface area of a spherical nanopore, respectively. The system volume, solid volume and total surface area of sphere-shaped nanopores in the samples are denoted as , , and , respectively. Here , and . It is noted that , the surface area of solid, for the np-Cu with sphere-shaped nanopores. Consequently, the size of spherical nanopore is
| (13) |
As , , and , Eq. 13 can be rewritten as
| (14) |
where . For np-Cu containing nonspherical nanopores, , where is the surface area of a nonspherical nanopore. Then Eq. 14 can be rewritten as
| (15) |
here is the shape factor, and . For an open-cell np-Cu, it can be considered to contain a nonspherical nanopore, whose size is . Thus the melting temperature of open-cell np-Cu fomas can be obtained
| (16) |
indicating that the melt of nanoporous is the function of specific surface area (), liquid-solid interfacial energy ( in ), and mass density ( in ). For our constructed np-Cu, are almost constant, 58.20; and their sizes are almost the same, nm 10 nm, implying is the bulk values.
References
- Hu et al. (2008) K. C. Hu, D. X. Lan, X. M. Li, and S. S. Zhang, Anal. Chem. 80, 9124 (2008).
- Biener et al. (2009) J. Biener, A. Wittstock, L. A. Zepeda-Ruiz, M. M. Biener, V. Zielasek, D. Kramer, R. N. Viswanath, J. Weissmuller, M. Baumer, and A. V. Hamza, Nat. Mater. 8, 47 (2009).
- Snyder et al. (2010) J. Snyder, T. Fujita, M. W. Chen, and J. Erlebacher, Nat. Mater. 9, 904 (2010).
- Erlebacher et al. (2001) J. Erlebacher, M. J. Aziz, A. Karma, N. Dimitrov, and K. Sleradzki, Nature 410, 450 (2001).
- Swan et al. (2005) E. E. L. Swan, K. C. Popat, and T. A. Desai, Biomater. 26, 1969 (2005).
- Crowson et al. (2007) D. A. Crowson, D. Farkas, and S. G. Corcoran, Scripta Mater. 56, 919 (2007).
- Crowson et al. (2009) D. A. Crowson, D. Farkas, and S. G. Corcoran, Scripta Mater. 61, 497 (2009).
- Kolluri and Demkowicz (2011) K. Kolluri and M. J. Demkowicz, Acta Mater. 59, 7645 (2011).
- Parida et al. (2006) S. Parida, D. Kramer, C. A. Volkert, H. Rosner, J. Erlebacher, and J. Weissmuller, Phys. Rev. Lett. 97, 035504 (2006).
- Kucheyev et al. (2006) S. O. Kucheyev, J. R. Hayes, J. Biener, T. Huser, C. E. Talley, and A. V. Hamza, Appl. Phys. Lett. 89, 053102 (2006).
- Seker et al. (2007) E. Seker, J. T. Gaskins, H. Bart-Simith, J. Z. Zhu, M. L. Reed, G. Zangari, R. Kelly, and M. R. Begley, Acta Mater. 55, 4593 (2007).
- Jin et al. (2009) H.-J. Jin, L. Kurmanaeva, J. Schmauch, H. Rösner, Y. Ivanisenko, and J. Weissmüller, Acta Mater. 57, 2665 (2009).
- Chen-Wiegart et al. (2012) Y. K. Chen-Wiegart, S. Wang, Y. S. Chu, W. J. Liu, I. McNulty, P. W. Voorhees, and D. C. Dunand, Acta Mater. 60, 4972 (2012).
- Frenkel et al. (2012) A. I. Frenkel, R. Vasic, B. Dukesz, D. Y. Li, M. W. Chen, L. Zhang, and T. Fujita, Phys. Rev. B 85, 195419 (2012).
- Hakamada and Mabuchi (2009) M. Hakamada and M. Mabuchi, J. Mater. Res. 24, 301 (2009).
- Chen et al. (2010) Y.-C. K. Chen, Y. S. Chu, J. Yi, I. McNulty, Q. Shen, P. W. Voorhees, and D. C. Dunand, Applied Physics Letters 96, 043122 (2010).
- Cahn (1986) R. W. Cahn, Nature 323, 668 (1986).
- Lipowsky et al. (1989) R. Lipowsky, U. Breuer, K. C. Prince, and H. P. Bonzel, Phys. Rev. Lett. 62, 913 (1989).
- Curtin (1989) W. A. Curtin, Phys. Rev. B 39, 6775 (1989).
- Lai et al. (1996) S. L. Lai, J. Y. Guo, V. Petrova, G. Ramanath, and L. H. Allen, Phys. Rev. Lett. 77, 99 (1996).
- Guisbiers and Buchaillot (2009) G. Guisbiers and L. Buchaillot, J. Phys. Chem. C 113, 3566 (2009).
- Yang and Li (2008) C. Yang and S. Li, J. Phys. Chem. C 112, 16400 (2008).
- Zhu et al. (2009) Y. F. Zhu, J. S. Lian, and Q. Jiang, J. Phys. Chem. C 113, 16896 (2009).
- Qi and Wang (2004) W. H. Qi and M. P. Wang, Mater. Chem. Phys 88, 280 (2004).
- Qi (2005) W. H. Qi, Physica B 368, 46 (2005).
- Qi (2016) W. H. Qi, Acc. Chem. Res. 49, 1587 (2016).
- Shin et al. (2007) H. S. Shin, J. Yu, and J. Y. Song, Appl. Phys. Lett. 91, 173106 (2007).
- Li et al. (2008) H. Li, J. M. Biser, J. T. Perkins, S. Dutta, R. P. Vinci, and H. M. Chan, J. Appl. Phys. 103, 024315 (2008).
- Evans and Marini Bettolo Marconi (1987) R. Evans and U. Marini Bettolo Marconi, J. Chem. Phys. 86, 7138 (1987).
- STRANGE (1998) H. B. J. STRANGE, Mol. Phys. 93, 263 (1998).
- Morishige and Nobuoka (1997) K. Morishige and K. Nobuoka, J. Chem. Phys. 107, 6965 (1997).
- Miyahara and Gubbins (1997) M. Miyahara and K. E. Gubbins, J. Chem. Phys. 106, 2865 (1997).
- Gubbins et al. (2014) K. E. Gubbins, Y. Long, and M. Śliwinska-Bartkowiak, J. Chem. Thermodynamics 74, 169 (2014).
- Coasne et al. (2013) B. Coasne, A. Galarneau, R. J. M. Pellenq, and F. Di Renzo, Chem. Soc. Rev 42, 4141 (2013).
- Coasne (2015) B. Coasne, Langmuir 31, 2706 (2015).
- Japel et al. (2005) S. Japel, B. Schwager, R. Boehler, and M. Ross, Phys. Rev. Lett 95, 167801 (2005).
- Trautt et al. (2012) Z. Trautt, A. Adland, A. Karma, and Y. Mishin, Acta Mater. 60, 6528 (2012).
- Zheng et al. (2007) L. Q. Zheng, Q. An, Y. Xie, Z. H. Sun, and S. N. Luo, J. Chem. Phys. 127, 164503 (2007).
- Mishin et al. (2001) Y. Mishin, M. J. Mehl, D. A. Papaconstantopoulos, A. F. Voter, and J. D. Kress, Phys. Rev. B 63, 224106 (2001).
- Plimpton (1995) S. Plimpton, J. Comp. Phys. 117, 1 (1995), also see http://lammps.sandia.gov.
- Li et al. (2015) Y. H. Li, L. Wang, B. Li, J. C. E, F. P. Zhao, J. Zhu, and S. N. Luo, J. Chem. Phys. 142, 054706 (2015).
- Wang et al. (2016) L. Wang, Y. Cai, A. M. He, and S. N. Luo, Phys. Rev. B 93, 174106 (2016).
- Bringa et al. (2004) E. M. Bringa, J. U. Cazamias, P. Erhart, J. Stolken, N. Tanushev, B. D. Wirth, R. E. Rudd, and M. J. Caturla, J. Appl. Phys. 96, 3793 (2004).
- Bringa et al. (2005) E. M. Bringa, A. Caro, Y. Wang, M. Victoria, J. M. McNaney, B. A. Remington, R. F. Smith, B. R. Torrala, and H. Van Swygenhoven, Science 309, 1838 (2005).
- Cui and Chen (2017) Y. Cui and Z. T. Chen, J. Appl. Phys. 122, 075102 (2017).
- Stukowski (2010) A. Stukowski, Modelling Simul. Mater. Sci. Eng. 18, 015012 (2010).
- Faken and Jonsson (1994) D. Faken and H. Jonsson, Comput. Mater. Sci. 2, 279 (1994).
- Tsuzuki et al. (2007) H. Tsuzuki, P. S. Branicia, and J. P. Rino, Comput. Phys. Comm 177, 518 (2007).
- Morris and Song (2003) J. R. Morris and X. Song, J. Chem. Phys. 119, 3920 (2003).
- He et al. (2013) A. M. He, S. Q. Duan, J. L. Shao, P. Wang, and S. N. Luo, J. Chem. Phys 139, 074502 (2013).
- Rapaport (1995) D. C. Rapaport, The Art of Molecualr Dynamics Simulation (Cambridge University Press, 1995).
- Samanta et al. (2014) A. Samanta, M. E. Tuckerman, T. Q. Yu, and W. N. E, Science 346, 729 (2014).
- Brillo and Egry (2003) J. Brillo and I. Egry, Inter. J. Thermophys. 24, 1155 (2003).
- Jin et al. (2001) Z. H. Jin, P. Gumbsch, K. Lu, and E. Ma, Phys. Rev. Lett. 87, 055703 (2001).
- Forsblom and Grimvall (2005) M. Forsblom and G. Grimvall, Nature Mater. 334, 50 (2005).
- Levitas and Ravelo (2012) V. Levitas and R. Ravelo, Proc. Natl. Acad. Sci. 109, 13204 (2012).
- Alsayed et al. (2005) A. M. Alsayed, M. F. Islam, J. Zhang, P. J. Collings, and A. G. Yodh, Science 309, 1207 (2005).
- Berry et al. (2008) J. Berry, K. R. Elder, and M. Grant, Phys. Rev. B 77, 224114 (2008).
- Liu et al. (2002) Z.-P. Liu, P. Hu, and A. Alavi, J. Am. Chem. Soc. 124, 14770 (2002).
- Wang et al. (2013) Y. M. Wang, F. Sansoz, T. LaGrange, R. T. Ott, J. Marian, T. W. Barbee Jr, and A. V. Hamza, Nat. Mater. 12, 697 (2013).
- Deng et al. (2010) L. Deng, W. Y. Hu, H. Q. Deng, and S. F. Xiao, J. Phys. Chem. C 114, 11026 (2010).
- Liu et al. (2009) D. Liu, Y. F. Zhu, and Q. Jiang, J. Phys. Chem. C 113, 10907 (2009).
- Porter and Easterling (1992) D. A. Porter and K. E. Easterling, Phase transformations in metals and alloys, 2nd Ed. (Chapman Hall, London, 1992).
- Kashchiev (2000) D. Kashchiev, Nucleation: Basic theory with applications (Butterworth-Heinemann, Oxford, 2000).
- Wu et al. (2016) L. K. Wu, Q. L. Li, B. Xu, and W. Liu, J. Mater. Res. 31, 3649 (2016).
- Jackson and Mckenna (1990) C. L. Jackson and G. B. Mckenna, J. Chem. Phys. 93, 9002 (1990).
- Jones (1974) D. Jones, J. Mater. Sci. 9, 1974 (1974).
- Bai and Li (2005) X. M. Bai and M. Li, Phys. Rev. B 72, 052108 (2005).
- Liang et al. (2002) L. H. Liang, M. Zhao, and Q. Jiang, J. Mater. Sci. Lett. 21, 1843 (2002).
- Castro et al. (1990) T. Castro, R. Reifenberger, E. Choi, and R. Andres, Phys. Rev. B 42, 8548 (1990).
- Dick et al. (2002) K. Dick, T. Dhanasekaran, Z. Zhang, and D. Meisel, J. Am. Chem. Soc. 124, 2312 (2002).
- Peters et al. (1998) K. F. Peters, J. B. Cohen, and Y.-W. Chung, Phys. Rev. B 57, 13430 (1998).
- Sun and Xia (2002) Y. Sun and Y. Xia, Science 298, 2176 (2002).
- Barnard et al. (2009) A. S. Barnard, N. P. Young, A. I. Kirkland, M. A. Van Huis, and H. Xu, ACS Nano 3, 1431 (2009).
- Xia et al. (2009) Y. Xia, Y. Xiong, B. Lim, and S. E. Skrabalak, Angew. Chem. Inter. Ed. 48, 60 (2009).