Formation of porous crystals via viscoelastic phase separation
Abstract
Viscoelastic phase separation of colloidal suspensions can be interrupted to form gels either by glass transition or by crystallization. With a new confocal microscopy protocol, we follow the entire kinetics of phase separation, from homogeneous phase to different arrested states. For the first time in experiments, our results unveil a novel crystallization pathway to sponge-like porous crystal structures. In the early stages, we show that nucleation requires a structural reorganization of the liquid phase, called stress-driven ageing. Once nucleation starts, we observe that crystallization follows three different routes: direct crystallization of the liquid phase, Bergeron process, and Ostwald ripening. Nucleation starts inside the reorganised network, but crystals grow past it by direct condensation of the gas phase on their surface, driving liquid evaporation, and producing a network structure different from the original phase separation pattern. We argue that similar crystal-gel states can be formed in monoatomic and molecular systems if the liquid phase is slow enough to induce viscoelastic phase separation, but fast enough to prevent immediate vitrification. This provides a novel pathway to form nano-porous crystals of metals and semiconductors without dealloying, which may be important for catalytic, optical, sensing, and filtration applications.
Crystallization plays a fundamental role in many processes occurring in nature, such as ice formation in atmospheric clouds glickman2000glossary ; morrison2012resilience , and in technological applications that are at the core of the chemical, pharmaceutical, and food industries. Many of the properties of crystals, like the shape, spatial arrangement, polymorph type, and size distribution of the crystallites, depend on the conditions at which the nucleation process took place. Controlling the early stages of crystallization is thus of fundamental importance in order to obtain in a reproducible manner crystals with the desired properties.
Classical Nucleation Theory describes the formation of an ordered crystalline nucleus directly from the supersaturated solution. But crystallization can be preceded by the formation of dense liquid droplets as an intermediate step ten1997enhancement ; SearR ; savage2009experimental ; vekilov2010two ; palberg2014crystallization . Understanding the process of crystal formation in mixed-phase systems (composed of gas, liquid, and solid phases) is thus of great importance for a variety of systems, from protein solutions to clouds.
Colloidal suspensions offer a system where the crystallization process in a mixed-phase environment can be observed with single-particle resolution, and at the same timescales over which nucleation takes place. In colloids with short-range attractions the gas-liquid transition becomes metastable with respect to crystallization anderson2002insights ; lekkerkerker2011colloids , and can form gels poon2002 ; zaccarelli2007 ; piazza1994phase ; verhaegh1997transient ; lu2008gelation . This gel formation process can be regarded as viscoelastic phase separation tanaka1999colloid into a dense liquid phase with slow dynamics and a dilute gas phase with fast dynamics. This difference in the viscoelastic properties between the two phases allows the formation of a space-spanning network structure of the liquid phase, even if it is the minority phase. The network is fractal and its dynamic structure factor shows a stretched-exponential decay to a finite plateau krall1998internal ; solomon2001dynamic ; romer2000sol . During phase separation, the density of the liquid phase increases towards the glass-transition density, leading to slow glassy dynamics. At the glass transition point, the percolated network structure is dynamically stabilised by vitrification of the dense liquid phase pusey1993dynamics ; piazza1994phase ; ilett1995phase ; verhaegh1997transient ; tanaka1999colloid ; foffi2002 ; buzzaccaro2007sticky ; zaccarelli2007 ; lu2008gelation ; testard2011 . More precisely, the dynamical stabilization is due to percolation of locally favoured structures, which are locally stable non-crystalline structures royall2008g .
Unlike the above standard scenario of colloidal gelation, it was shown that phase separation can also be accompanied by crystallization poon1999cpm , if the process takes place below the melting point of one of the two separating phases tanaka1985new , and the phenomena were discussed on the basis of its unique free-energy landscape poon1999cpm . Later the possibility of a different class of gels, which are stabilized by crystallization, was suggested by numerical simulations soga1999metastable ; charbonneau2007systematic ; fortini2008crystallization ; perez2011pathways and observed in experiments sabin2012 ; zhang2012non . In Brownian dynamics simulations, Ref. fortini2008crystallization found that crystallization is enhanced by the metastable gas-liquid binodal by means of a two-stage crystallization process. Despite being less likely than for purely attractive systems, the possibility of interrupting spinodal decomposition with crystallization was observed also in simulations of charged attractive colloids charbonneau2007systematic , and in both experiments and simulations of oppositely charged colloids sanz2008gel ; sanz2008out .
However, there has so far been no experimental single-particle level studies on the dynamical process of crystal-gel formation, which makes the microscopic mechanism of crystal-gel formation elusive. For confocal microscopy experiments on colloidal gels, colloid-polymer mixtures have so far been used as a model system poon2002 ; lu2008gelation ; royall2008g ; zhang2012non . The main difficulty consists in the preparation protocol of the unstable suspension into an initial homogeneous state. Shaking or applying shear introduces turbulent flows at the beginning of the process, prevents the observation of the initial stages of gelation, and may even alter the selection of the final non-equilibrium arrested state. In our experiments we instead succeed in building a novel protocol that allows the time evolution of the system to be observed in a quiescent situation without introducing fluid flows. We thus address by single-particle-level observation how the momentum conservation, which is a consequence of the presence of a liquid component, does affect the selection of the kinetic pathway of gelation.
In this Article, we show that the system can undergo a novel crystallization pathway that leads to the formation of interconnected crystalline droplets, different from both vitrified or crystallised liquid network pathways. We show that after a spinodal decomposition, crystal nucleation in the liquid network is made possible by stress-driven ageing which releases the stresses that build-up during the network formation due to hydrodynamic interactions, allowing for a local increase in density necessary to accommodate critical nuclei. Stress-driven ageing is possible only when interparticle attraction is weak enough, otherwise we observe the classical gelation process, in which phase separation is interrupted by vitrification verhaegh1997transient ; tanaka1999colloid ; lu2008gelation . We then show that the growth of the crystal seeds occurs by three different routes: (i) Growth within the dense branches of the gel; (ii) Bergeron process, analogous to ice formation in mixed phase clouds glickman2000glossary ; morrison2012resilience , where ice droplets grow at the expense of the supercooled liquid droplets due to their lower saturated vapour pressure; (iii) Ostwald ripening. Differently from the standard crystal-gel scenario, where crystals only nucleate and grow inside the dense branches of the gel, becoming dynamically arrested, we show that the kinetic pathways involving the gas phase (predominantly the Bergeron process, but also Ostwald ripening) play an important role. We reveal that the final crystal-gel network structure has smoother interface than the ordinary gels formed by vitrification because of this novel crystal growth mechanism.
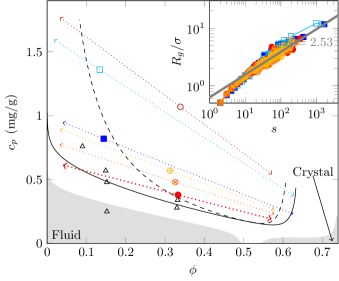
In our experimental setup, the sample cell is put in contact with a reservoir of a salt solution through a semi-permeable membrane (see Methods). At , the increase in the concentration of salt ions within a few Brownian times () screens the Coulomb repulsion between colloidal particles, which are then subject to attractive depletion forces, making the system thermodynamically unstable and leading to spinodal decomposition without any harmful flow or drift, as confirmed by Supplementary Movie 1. In Fig. 1, we superimpose the state points with a theoretical phase diagram (see Supplementary Methods). The state points which did not phase separate are indicated with open triangles, while the other symbols indicate samples undergoing phase separation on which we focus in the following.
A typical early stage phase ordering process observed at and mg/g can be seen in the beginning of Supplementary Movie 1. Due to strong dynamical asymmetry between colloids and the solvent tanaka1999colloid , the colloidal particles start aggregating, eventually forming a percolating network. Thus, a dense network (liquid) coexists with freely diffusing monomers (gas).
At percolation, all samples display a similar network topology. This is shown for example in the inset of Fig. 1, where we plot the radius of gyration of colloidal clusters () as a function of the cluster size () at the percolation time, see Methods. All samples show the same scaling law, , which is compatible with the random gelation universality class exponent () as shown by the grey line in the inset of Fig. 1. Here we do not imply that the formation of the network follows the random gelation universality class, but just that our fractal (or effective) dimension is compatible with it.
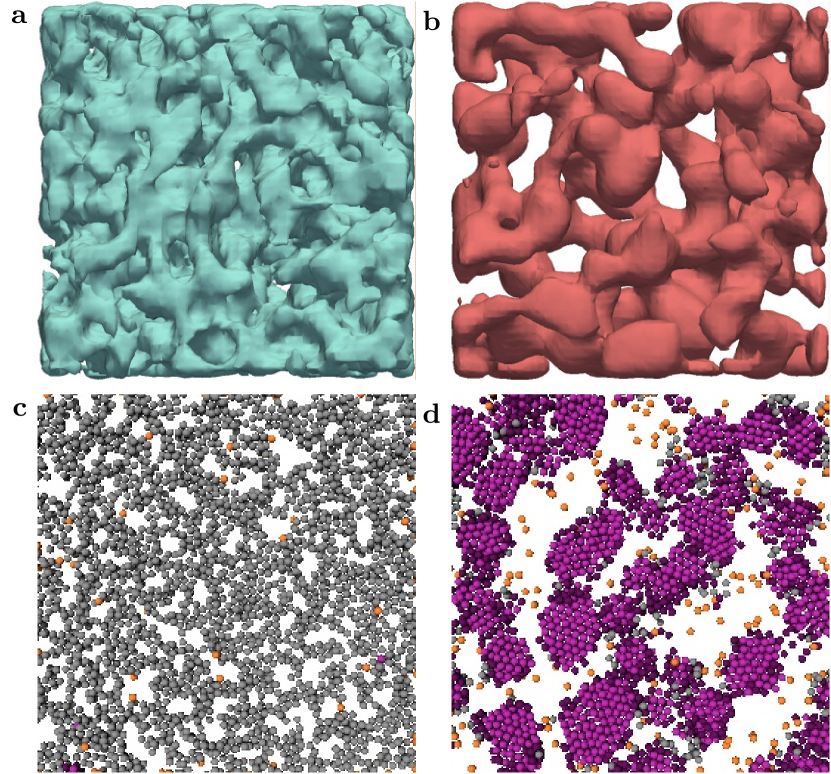
The samples share the same early stages of the phase separation process, but show significantly different behaviours in the later stages. An example of this is given in Fig. 2 where we compare the final network structures for two samples at the same colloid volume fraction but at different polymer concentrations, mg/g and mg/g. In Fig. 2a and b, Gaussian filtering is used to depict the network structure as a continuous field (see Methods). The comparison shows that high polymer concentration (panel a) produces a network of thin strands whereas low polymer concentration produces a beaded network structure with bigger pores, smoother surfaces, and thicker strands (panel b). Fig. 2c and d shows the individual particle positions for slabs with a thickness of 5 particle diameters. From the figures it is immediately clear that the network strands at low polymer concentration are crystalline (Fig. 2d) but not the ones at higher (Fig. 2c).
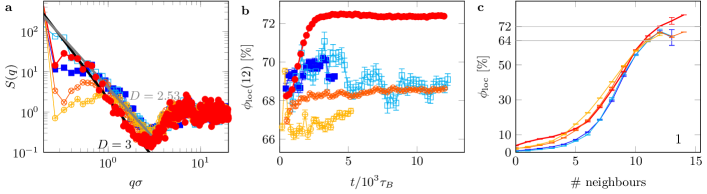
To confirm the generality of these two distinct final structures, we plot in Fig. 3a the structure factor for the final stages of the gelation process for all state points. At low wavenumber , the structure factor displays fractal scaling compatible with the Guinier law, . But a difference in the fractal (or effective) dimension between the and mg/g state point and other state points is visible. In fact, while states with high polymer concentration retain the exponent , which is the random gel universality class exponent, as we also observed in the early stages of the gelation process (see the inset of Fig. 1), the state point with low polymer concentration ( and mg/g) displays a slope compatible with the exponent , which corresponds to compact structures. This is consistent with the smoother surfaces of the beaded network (see Fig. 2b).
In Fig. 3b we plot the late stage (after all samples already underwent gas-liquid phase separation) time evolution of the local volume fraction of closed packed particles (having 12 neighbours, see Methods). Only the state point at and mg/g shows an increase, up to an asymptotic value that we identify with the composition of the stable crystal phase . We plot the asymptotic average volume fraction as a function of the number of neighbours in Fig. 3c. Approaching close packing (12 neighbours), we clearly see two families of curves. The state point at and mg/g reaches close packing at the volume fraction . By contrast, all other state points reach close packing at a markedly lower volume fraction, which is indeed close to the volume fraction of the attractive glass state pham2002multiple . To sum up, at the state point and mg/g the network crystallises whereas other samples stay glassy. In particular, for state points with , increasing polymer concentration drastically reduces the amount of crystals. This is in agreement with the idea of enhanced crystallization rates near metastable critical points ten1997enhancement ; olmsted1998spinodal and the results of Refs. soga1999metastable ; fortini2008crystallization ; perez2011pathways , which speculated two different arrest mechanisms: crystallization at low polymer concentration, and dynamic arrest at high polymer concentrations. This is in contradiction with free energy landscape approach poon1999cpm , predicting that all our samples should crystallise after the initial spinodal decomposition (see Supplementary Methods and Supplementary Figure S2). This indicates that the selection of the kinetic pathway in a non-equilibrium process cannot be inferred from free energy alone, but is strongly affected by kinetic factors, e.g. the difference in the kinetics between spinodal decomposition and crystallization tanaka1985new , and hydrodynamic and mechanical effects (see below).
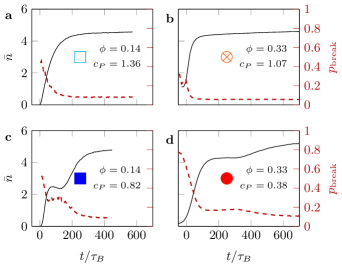
We argue that the main difference between our samples is the occurrence or absence of stress-driven ageing of the network. First, let us recall that the network formed by the initial spinodal decomposition has thin strands, just a few particles thick (see Fig. 2a and c). Such morphology can be explained only by taking into account the fundamental role played by hydrodynamic interactions from initial to intermediate times, before percolation is complete tanaka2000 ; tanaka2007spontaneous ; furukawa2010key . Without hydrodynamic interactions, as often assumed in simulations, particles have the tendency to aggregate in compact structures and subsequently form thick network structures. With hydrodynamic interactions, particles first form a transient gel even at very low volume fractions, and the number of nearest neighbours increases only later to minimize the energy of the structure. Thus, hydrodynamic interactions lead to the formation of gels that are very far from equilibrium and under a strong thermodynamic driving force towards more stable compact structures. The resulting transition from open to more compact networks occurs through the breaking of the bonds that have accumulated more stress. This process has been called stress-driven ageing tanaka2007spontaneous , and is characteristic of viscoelastic phase separation tanaka1999colloid . Whether the network undergoes such restructuring or not depends on the strength of the bonds, i.e. the polymer concentration. In Fig. 4 we plot the bond breaking probability, , and the average coordination, , as a function of the time elapsed since salt injection (). At high polymer concentrations (panels a, b), decreases monotonically, until a stationary state is reached where . At low polymer concentrations (panels c, d), the initial decay of to a network with is followed by a secondary decay to a more compact network with . This means that mechanical stress built up in the first transient network can relax to a more compact network only when bonds are weak enough, i.e. at low polymer concentrations.
It is worth noting that the two-step behaviour of and is not due to crystallization, as this only starts after the network reorganization. For example, the fraction of crystalline particles for all times displayed in Fig. 4d is always below . The increase in number of bonds after network reorganization is a necessary condition for crystallization, as more compact environments become available to accommodate the critical nucleus size, while in its absence the network forms low-density arrested states (gels).
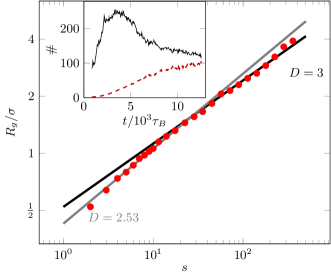
Now we focus on the crystallisation process. Supplementary Movie 1 shows the evolution of a 2D confocal slice. Even in this raw data the growth of crystalline regions from inside the liquid phase is obvious. More quantitatively, we detect crystalline environments by bond orientational analysis (see Supplementary Information). The inset of Fig. 5 shows the evolution of the number and average size of crystallites. Their number first rapidly increases as nucleation events start occurring inside the liquid network, but eventually decreases as the different crystallites merge together. Supplementary Movie 2 shows a three-dimensional (3D) reconstruction of the whole phase ordering sequence that emphasizes crystalline particles. Although crystal clusters look isolated in this movie, they are bridged by the dense colloidal liquid phase and involved in the percolated gel network, as can be seen in Fig. 2b and d. In Fig. 5 we show the gyration radius of individual crystalline nuclei. The results show that crystal growth follows two different scaling laws: at small crystalline sizes it scales with the fractal (or effective) dimension close to random percolation (), while at large sizes it scales as , as in compact crystal growth, consistently with the analysis of the structure factors, Fig. 3a. This demonstrates that crystal nucleates inside the liquid branches, but once a nucleus reaches the transverse size of the branch, the growth proceeds in volume. Contrary to Refs soga1999metastable ; fortini2008crystallization ; perez2011pathways , thus, crystal growth is not limited by the network shape.
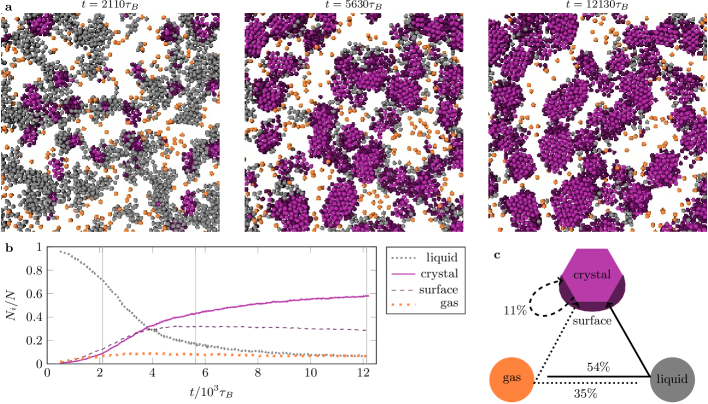
In Fig. 6a we display slabs of 5 particle diameter thickness at different times after stress driven ageing is complete. Particles are coloured according to their phases. Left panel shows the first nucleation events inside the liquid network. At the same time liquid regions that have not crystallized start evaporating, and the gas phase contributes to the growth of crystal nuclei (middle panel). Finally the different nuclei coalesce (right panel). Note that the topology of the crystal network found at late times, i.e. (middle panel) and (right panel) in Fig. 6a, differs significantly from that of the liquid network at early stages, i.e. (left panel) in Fig. 6a. This suggests that the crystal network does not form only by direct freezing of the liquid, but also by other mechanisms which involve the evaporation of the liquid (Bergeron process) and the sublimation of small crystals (Ostwald ripening). In the following we will investigate these different crystallization mechanisms in depth.
In Fig. 6b, we show the fraction of particles in each different phase for the crystallising sample, after the gas-liquid phase separation has occurred. The process of crystallization is characterized by a steep decrease in liquid particles, as they transform into small crystalline nuclei inside the liquid domains. This decrease is then accompanied by an increase in the fraction of gas particles: as the first crystals start to reach the gas phase, liquid particles evaporate to the gas phase due to the higher vapour pressure of the liquid phase compared to the crystalline phase. The crystalline nuclei are initially composed mostly of surface particles, but as the nuclei grow they become more compact and merge together such that the number of surface particles slowly decreases, while bulk crystals keep increasing.
After the onset of a steady-state gas population, there are three growth routes for the crystal. Direct crystallization is the process by which crystals grow by incorporating nearby liquid particles. In the Bergeron process, liquid droplets first evaporate and the resulting gas phase contributes to the growth of crystalline regions. Ostwald ripening is instead the process by which small crystallites sublimate, and colloidal particles are transferred to larger nuclei. The Bergeron and Ostwald ripening processes both take place only when the crystallites are surrounded by the gas phase due to the non-existence of a liquid-crystal coexistence. Since we have access to individual particle trajectories, we can directly assess the relative importance of these three growth channels (see Methods). The different crystallization routes are depicted in the diagram of Fig. 6c. Direct crystallization accounts for 54% of particles trajectories in which gas or liquid particles transition to the crystal state without liquid evaporation or crystal de-sublimation. The Bergeron process accounts for 35% of particle trajectories in which liquid particles transition to the gas state before crystallizing. Ostwald ripening accounts for 11% of particle trajectories in which crystal particles transition to the gas state before returning to the crystal state. In Supplementary Figure S3, we confirm these results with a detailed analysis of transition probabilities. While the direct freezing of the fluid represents the major contribution to the nuclei growth, the kinetic path via the gas phase (gascrystal), also plays a crucial role, especially in determining the morphology of the porous crystal, as we discussed above. In this context the Bergeron process glickman2000glossary ; morrison2012resilience plays a considerably more important role than Ostwald ripening and is responsible for the beaded network morphology.
To summarize our results, the first stages of gelation always involve spinodal decomposition with the formation of liquid network by viscoelastic gas-liquid phase separation. There are then two possible arrest mechanisms: (a) Crystallization: provided stress-driven coarsening of the network, small crystalline nuclei appear inside the liquid phase, reach the surface of the liquid branches, and then grow by addition of particles from the gas phase. The final structure is a network of crystal droplets, as confirmed by the fractal dimension of the branches, the volume fraction of the particles within the branches, and bond orientational analysis. (b) Dynamic arrest: particle arrest when the dynamics inside the liquid branch becomes slow, which should happen at the intersection of the glass line with the liquid side of the coexistence curve.
The physical conditions required for the crystal-gel formation revealed in our study indicates that the extent of the - region where mechanism (a) is operative can be widened by changing the location of the critical point, which in our system is controlled by the size of the polymer: moving the critical point to lower polymer concentrations opens the window where bonds can rearrange before the intervening glass transition. So we argue that the region of formation of crystal-gel porous structures is not only easily accessible, but also controllable.
The process of formation of “crystal gels” may be generic to many other systems. The requirements are (i) the presence of gas-liquid phase separation below the melting point of a crystal, (ii) weak or little frustration against crystallization (in our case, the use of monodisperse colloids), (iii) dynamical slowing down in a supercooled liquid state, which is necessary to induce viscoelastic phase separation leading to the formation of a network structure of the minority liquid phase, and (iv) low enough degree of supercooling to allow bond-breaking events that avoid the vitrification of the liquid phase. Many monoatomic and single-component molecular systems can satisfy all these conditions in a certain range of the temperature and pressure. For example, a Lennard-Jones liquid, which represents many molecular systems without specific directional interactions, display the right kind of phase diagram lodge1997brownian .
Usually, monoatomic systems are very poor glass-formers and thus have not been expected to form gels. However, our mechanism provides a novel kinetic pathway to spontaneously form network or porous structures made of crystals. For monoatomic systems such as noble metals, condition (iii) may not be satisfied easily. To access glassy slow dynamics in a liquid phase and satisfy condition (iii) deep quench at high pressure may be needed. However, we note that even without strong dynamic asymmetry due to glassiness, bicontinuous phase separation can take place between 35-65 volume % of the liquid phase in ordinary gas/liquid phase separation onuki2002 ; and, thus, porous crystalline structures can be formed, although a thin network structure may be more difficult.
Since crystals outgrow from the liquid network, well-ordered crystal planes appear on the surface of the porous structure, which is crucial for applications. For example, nano-porous crystals of noble metals have special functions associated with ultra-high interfacial area and connectivity of pores, which are relevant to catalytic, optical, sensing, super-capacitor, and filtration ding2004nanoporous ; ding2009nanoporous ; wittstock2010nanoporous ; fujita2012atomic . Usually such nano-porous materials are formed via at least two steps: for example, phase separation and dealloying of a mixture erlebacher2001evolution . Our novel mechanism allows us to spontaneously form sponge-like nano-porous crystals in a continuous process, which may have an impact on many applications. We note that laser ablation of metals is a promising method for this purpose povarnitsyn2013mechanisms . So we believe that crystal gels are an important class of heterogeneous non-ergodic states in nature and industrial applications, although they have not attracted much attention so far.
The Bergeron process is also the primary mechanism for the formation of rain drops in clouds glickman2000glossary ; morrison2012resilience . Our system can then be regarded as a colloidal analogue for this important process, which, for the first time, we can observe at the single-particle level. We also speculate that our scenario could play a role in the formation of crystal networks observed in dynamically asymmetric mixtures, which includes magma philpotts1998role , biominerals rousseau2005multiscale , and foods deman1987fat .
References
- (1) Glickman, T. S. & Zenk, W. Glossary of meteorology (Amer. Meteorol. Soc., 2000).
- (2) Morrison, H. et al. Resilience of persistent arctic mixed-phase clouds. Nat. Geosci. 5, 11–17 (2012).
- (3) ten Wolde, P. R. & Frenkel, D. Enhancement of protein crystal nucleation by critical density fluctuations. Science 277, 1975–1978 (1997).
- (4) Sear, R. Nucleation: Theory and applications to protein solutions and colloidal suspensions. J. Phys.: Condens. Matter 19, 033101 (2007).
- (5) Savage, J. R. & Dinsmore, A. D. Experimental evidence for two-step nucleation in colloidal crystallization. Phys. Rev. Lett. 102, 198302 (2009).
- (6) Vekilov, P. G. The two-step mechanism of nucleation of crystals in solution. Nanoscale 2, 2346–2357 (2010).
- (7) Palberg, T. Crystallization kinetics of colloidal model suspensions: recent achievements and new perspectives. J. Phys.: Condens. Matter 26, 333101 (2014).
- (8) Anderson, V. J. & Lekkerkerker, H. N. W. Insights into phase transition kinetics from colloid science. Nature 416, 811–815 (2002).
- (9) Lekkerkerker, H. N. W. & Tuinier, R. Colloids and the depletion interaction, vol. 833 (Springer Science & Business Media, 2011).
- (10) Poon, W. C. K. The physics of a model colloid-polymer mixture. J. Phys.: Condens. Matter 14, R859–R880 (2002).
- (11) Zaccarelli, E. Colloidal gels: Equilibrium and non-equilibrium routes. J. Phys.: Condens. Matter 19, 323101 (2007).
- (12) Piazza, R. & Di Pietro, G. Phase separation and gel-like structures in mixtures of colloids and surfactant. Europhys. Lett. 28, 445–450 (1994).
- (13) Verhaegh, N. A. M., Asnaghi, D., Lekkerkerker, H. N. W., Giglio, M. & Cipelletti, L. Transient gelation by spinodal decomposition in colloid-polymer mixtures. Physica A 242, 104–118 (1997).
- (14) Lu, P. J. et al. Gelation of particles with short-range attraction. Nature 453, 499–503 (2008).
- (15) Tanaka, H. Viscoelastic model of phase separation in colloidal suspensions and emulsions. Phys. Rev. E 59, 6842 (1999).
- (16) Krall, A. H. & Weitz, D. A. Internal dynamics and elasticity of fractal colloidal gels. Phys. Rev. Lett. 80, 778 (1998).
- (17) Solomon, M. J. & Varadan, P. Dynamic structure of thermoreversible colloidal gels of adhesive spheres. Phys. Rev. E 63, 051402 (2001).
- (18) Romer, S., Scheffold, F. & Schurtenberger, P. Sol-gel transition of concentrated colloidal suspensions. Phys. Rev. Lett. 85, 4980 (2000).
- (19) Pusey, P. N., Pirie, A. D. & Poon, W. C. K. Dynamics of colloid-polymer mixtures. Physica A 201, 322–331 (1993).
- (20) Ilett, S. M., Orrock, A., Poon, W. C. K. & Pusey, P. N. Phase behavior of a model colloid-polymer mixture. Phys. Rev. E 51, 1344 (1995).
- (21) Foffi, G. et al. Phase equilibria and glass transition in colloidal systems with short-ranged attractive interactions: Application to protein crystallization. Phys, Rev. E 65, 031407 (2002).
- (22) Buzzaccaro, S., Rusconi, R. & Piazza, R. Sticky hard spheres: equation of state, phase diagram, and metastable gels. Phys. Rev. Lett. 99, 098301 (2007).
- (23) Testard, V., Berthier, L. & Kob, W. Influence of the glass transition on the liquid-gas spinodal decomposition. Phys. Rev. Lett. (2011).
- (24) Royall, C. P., Williams, S. R., Ohtsuka, T. & Tanaka, H. Direct observation of a local structural mechanism for dynamic arrest. Nature Mater. 7, 556–561 (2008).
- (25) Poon, W. C. et al. Colloid-Polymer Mixtures at Triple Coexistence: Kinetic Maps from Free-Energy Landscapes. Phys. Rev. Lett. 83, 1239–1242 (1999). URL http://link.aps.org/doi/10.1103/PhysRevLett.83.1239.
- (26) Tanaka, H. & Nishi, T. New types of phase separation behavior during the crystallization process in polymer blends with phase diagram. Phys. Rev. Lett. 55, 1102–1105 (1985).
- (27) Soga, K. G., Melrose, J. R. & Ball, R. C. Metastable states and the kinetics of colloid phase separation. J. Chem. Phys 110, 2280–2288 (1999).
- (28) Charbonneau, P. & Reichman, D. Systematic characterization of thermodynamic and dynamical phase behavior in systems with short-ranged attraction. Phys. Rev. E 75, 011507 (2007).
- (29) Fortini, A., Sanz, E. & Dijkstra, M. Crystallization and gelation in colloidal systems with short-ranged attractive interactions. Phys. Rev. E 78, 041402 (2008). URL https://doi.org/10.1103/PhysRevE.78.041402.
- (30) Pérez, T., Liu, Y., Li, W., Gunton, J. D. & Chakrabarti, A. Pathways of cluster growth and kinetic slowing down in a model of short-range attractive colloids. Langmuir 27, 11401–11408 (2011).
- (31) Sabin, J., Bailey, A. E., Espinosa, G. & Frisken, B. J. Crystal-arrested phase separation. Phys. Rev. Lett. 109, 195701 (2012).
- (32) Zhang, T. H., Klok, J., Tromp, R. H., Groenewold, J. & Kegel, W. K. Non-equilibrium cluster states in colloids with competing interactions. Soft Matter 8, 667–672 (2012).
- (33) Sanz, E., Leunissen, M. E., Fortini, A., Van Blaaderen, A. & Dijkstra, M. Gel formation in suspensions of oppositely charged colloids: Mechanism and relation to the equilibrium phase diagram. J. Phys. Chem. B 112, 10861–10872 (2008).
- (34) Sanz, E. et al. Out-of-equilibrium processes in suspensions of oppositely charged colloids: liquid-to-crystal nucleation and gel formation. J. Phys.: Condens. Matter 20, 494247 (2008).
- (35) Pham, K. N. et al. Multiple glassy states in a simple model system. Science 296, 104–106 (2002).
- (36) Olmsted, P. D., Poon, W. C. K., McLeish, T. C. B., Terrill, N. J. & Ryan, A. J. Spinodal-assisted crystallization in polymer melts. Phys. Rev. Lett. 81, 373 (1998).
- (37) Tanaka, H. & Araki, T. Simulation method of colloidal suspensions with hydrodynamic interactions: Fluid particle dynamics. Phys. Rev. Lett. 85, 1338–1341 (2000).
- (38) Tanaka, H. & Araki, T. Spontaneous coarsening of a colloidal network driven by self-generated mechanical stress. Europhys. Lett. 79, 58003 (2007). URL https://doi.org/10.1209/0295-5075/79/58003.
- (39) Furukawa, A. & Tanaka, H. Key role of hydrodynamic interactions in colloidal gelation. Phys. Rev. Lett. 104, 245702 (2010). URL https://doi.org/10.1103/PhysRevLett.104.245702.
- (40) Lodge, J. F. M. & Heyes, D. M. Brownian dynamics simulations of lennard-jones gas/liquid phase separation and its relevance to gel formation. J. Chem. Soc. Faraday Trans. 93, 437–448 (1997).
- (41) Onuki, A. Phase Transition Dynamics (Cambridge University Press, 2002).
- (42) Ding, Y., Kim, Y.-J. & Erlebacher, J. Nanoporous gold leaf:?gancient technology?h/advanced material. Adv. Mater. 16, 1897–1900 (2004).
- (43) Ding, Y. & Chen, M. Nanoporous metals for catalytic and optical applications. MRS Bulletin 34, 569–576 (2009).
- (44) Wittstock, A., Zielasek, V., Biener, J., Friend, C. M. & Bäumer, M. Nanoporous gold catalysts for selective gas-phase oxidative coupling of methanol at low temperature. Science 327, 319–322 (2010).
- (45) Fujita, T. et al. Atomic origins of the high catalytic activity of nanoporous gold. Nature Mater. 11, 775–780 (2012).
- (46) Erlebacher, J., Aziz, M. J., Karma, A., Dimitrov, N. & Sieradzki, K. Evolution of nanoporosity in dealloying. Nature 410, 450–453 (2001).
- (47) Povarnitsyn, M. E., Itina, T. E., Levashov, P. R. & Khishchenko, K. V. Mechanisms of nanoparticle formation by ultra-short laser ablation of metals in liquid environment. Phys. Chem. Chem. Phys. 15, 3108–3114 (2013).
- (48) Philpotts, A. R., Shi, J. & Brustman, C. Role of plagioclase crystal chains in the differentiation of partly crystallized basaltic magma. Nature 395, 343–346 (1998).
- (49) Rousseau, M. et al. Multiscale structure of sheet nacre. Biomaterials 26, 6254–6262 (2005).
- (50) Deman, J. M. & Beers, A. M. Fat crystal networks: structure and rheological properties. J. Texture Stud. 18, 303–318 (1987).
- (51) Klein, S. M., Manoharan, V. N., Pine, D. J. & Lange, F. F. Preparation of monodisperse PMMA microspheres in nonpolar solvents by dispersion polymerization with a macromonomeric stabilizer. Colloid Polym. Sci. 282, 7–13 (2003). URL http://www.springerlink.com/openurl.asp?genre=article{&}id=doi:10.1007/s00396-003-0915-0.
- (52) Bosma, G. et al. Preparation of monodisperse, fluorescent pmma-latex colloids by dispersion polymerization. J. Coll. Interf. Sci. 245, 292–300 (2002).
- (53) Leocmach, M. & Tanaka, H. A novel particle tracking method with individual particle size measurement and its application to ordering in glassy hard sphere colloids. Soft Matter (2013).
- (54) Royall, C. P., Louis, A. A. & Tanaka, H. Measuring colloidal interactions with confocal microscopy. J. Chem. Phys. 127, 044507 (2007).
- (55) Poon, W. C. K., Weeks, E. R. & Royall, C. P. On measuring colloidal volume fractions. Soft Matter 8, 21–30 (2012).
- (56) Fleer, G. J. & Tuinier, R. Analytical phase diagrams for colloids and non-adsorbing polymer. Adv. Colloid Interface Sci. 143, 1–47 (2008).
- (57) Russo, J., Maggs, A. C., Bonn, D. & Tanaka, H. The interplay of sedimentation and crystallization in hard-sphere suspensions. Soft Matter 9, 7369–7383 (2013).
Acknowledgements This study was partly supported by Grants-in-Aid for Scientific Research (S) (Grand No. 21224011) and Specially Promoted Research (Grand No. 25000002) from the Japan Society for the Promotion of Science (JSPS). Collaboration between M.L. and H.Ta. has been funded by CNRS through Projet international de coopération scientifique No 7464.
Author Contributions H.Ts. and J.R. contributed equally to this work. H.Ta. conceived and supervised the project, H.Ts. performed experiments, J.R. analysed the data, M.L. linked experiments and analysis, and all the authors discussed and wrote the manuscript.
Additional information Correspondence and requests for materials should be addressed to H.Ta.
Data Availability. The data that support the plots within this paper and other findings of this study are available upon reasonable request.
Competing financial interests The authors declare no competing financial interests
METHODS
Experiments
We use pmma (poly(methyl methacrylate)) colloids sterically stabilized with methacryloxypropyl terminated pdms(poly(dimethyl siloxane)) klein2003 and fluorescently labelled with rhodamine isothiocyanate chemically bonded to the pmma bosma2002 . To allow electrostatic repulsion, pmma was copolymerized with 2 % of methacrylic acid monomers. The diffusion constant in dilute conditions without polymer allows us to estimate the colloid diameter to m. The Brownian time is s. We assess that the size distribution of our particle is Gaussian with a polydispersity below 5% via direct confocal measurements Leocmach2013 . This small polydispersity allows crystallization. We disperse the particles in refractive index and density matching mixture of cis-decalin (Tokyo Kasei) and bromocyclohexane (Sigma-Aldrich). The precision of density matching is g/ml, for which the gravity effect on our gelation processes is negligible up to 12 hours.
To induce short-ranged depletion attraction, we use polystyrene (TOSOH) as non-adsorbing polymer of molecular weight 3.8 MDa. Experiments are conducted at 27 ∘C, some 80 ∘C above the theta temperature in this solvents mixture Royall2007 . A Flory scaling of the measurements of lu2008gelation yields a radius of gyration nm.
Matching phase boundaries often leads to better determination of volume fractions than colloid diameter measurements poon2012 . We obtain the best match between theoretical phase diagram (which we calculated from generalised free volume theory Fleer2008 ) and experimental data for m and nm (see Supplementary Method). Therefore the polymer-colloid size ratio is and the overlap mass fraction of polymer mg/g. The samples displaying a gel behaviour are prepared at two different volume fractions ( and ) and for different values of the polymer concentration, mg/g for and mg/g for .
In the absence of salt, the Debye length is expected to reach a few micrometers and the (weakly) charged colloids experience a long range electrostatic repulsion. We confirm that colloids never come close enough to feel the short-ranged attraction. Screening by tetrabutylammonium bromide (Fluka) at saturated concentration brings down the Debye length to about 100 nm practically discarding the repulsion. Thus, salt introduction can screen the Coulomb repulsion and make the polymer-induced depletion attraction effective, initiating phase separation.
To avoid solvent flow upon salt addition, our sample cell has two layer compartments separated by a membrane filter of pore size of 0.1 m, permeable only to polymers and the salt ions. The top layer is 200 m thick and contains the sample: a mixture of colloids, polymer, and solvent without salt. The bottom layer is a salt-reservoir with a half-opened structure, which allows us to exchange or insert a reservoir solution. The volume ratio of the first and second compartments is approximately 1:100.
In our experiments, the reservoir solution is initially a polymer solution without salt and electrostatic repulsion by the unscreened surface charges inhibited colloidal aggregation. Under microscopy observation, we quickly exchange the reservoir solution to a polymer solution with salt at saturated concentration (4 mM) and seal the half-opened reservoir with cover glass to avoid evaporation of solvent. Salt diffuses into the sample cell and the salt concentration becomes homogeneous within a few minutes, typically 2 minutes. This diffusive salt injection screens the surface charges of colloids, and thus initiates colloidal aggregation. This allows us to observe the process without suffering from harmful turbulent flow.
The data are collected on an upright Leica SP5 confocal microscope, using 532 nm laser excitation. The scanning volume is 98 98 53 m3, which contains colloid particles. Our spatial resolution is 192 nm / pixel. To be able to follow individual trajectories, we perform a 3D scan every 10 s () at early time and every 30 s later.
The crystal-gel state is reproduced in a sealed cell with all the components of the suspension pre-mixed. The colloid volume fraction is virtually identical at and polymer concentration is mg/g. See Supplementary Figure S4.
Structural analysis
Calculation of the structure factor is done with the Hanning window function, to minimize boundary effects. To account for imprecision in particle localisation close to contact, we consider two particles bonded if their centre-to-centre distance is within 2.4 m, which is the range of the potential () plus our worse estimate of localisation inaccuracy (0.15 pixels) Leocmach2013 .
To detect percolation, two different methods have been employed. In the first one we detect percolation by looking at which frame the cluster size distribution has a more extended power-law decay. In the second technique, we simply measure the spatial extent of the largest cluster and consider it percolating when it is comparable to the size of the field of view of the microscope. Both methods lead to essentially identical percolation time for each state point.
Coarse-grained representation of the network is obtained by applying a Gaussian filter to the position of the particles (of width equal to the inter-particle distance) and plotting the surface which bounds the highest 20 % values of the field. The local volume fraction is obtained by computing the Voronoi diagram of each configuration, which uniquely assigns a volume to each colloidal particle.
Classification into gas, liquid, crystal and crystal surface from bond orientational order russo2013interplay is detailed in Supplementary Information. Transition probabilities shown in Supplementary Figure S3c and histories shown in Figure 6 are obtained as follow: for every time frame, we assign each particle a state between gas, liquid and crystal. In order to minimize short-term fluctuations, the state of each colloidal particle is time averaged for . We then measure either the time-dependent transition probability between two states, or the fraction of trajectories ending as crystal with different transition histories.