The Density Profile and Kinematics of the Milky Way with RR Lyrae Stars
Abstract
Most of known RR Lyraes are type ab RR Lyraes (RRLab), and they are the excellent tool to map the Milky Way and its substructures. We find that 1148 RRLab stars determined by Drake et al.(2013) have been observed by spectroscopic surveys of SDSS and LAMOST. We derived radial velocity dispersion, circular velocity and mass profile from 860 halo tracers in our paper I. Here, we present the stellar densities and radial velocity distributions of thick disk and halo of the Milky Way. The 288 RRLab stars located in the thick disk have the mean metallicity of [Fe/H]. Three thick disk tracers have the radial velocity lower than 215 km . With 860 halo tracers which have a mean metallicity of [Fe/H], we find a double power-law of and with a break distance of 21 kpc to express the halo stellar density profile. The radial velocity dispersion at 50 kpc is around 78 km .
1 Introduction
The recent photometric and spectroscopic surveys have been providing information of stars to measure the stellar number density profile and kinematics of the Galactic disk and halo (e.g., Bland-Hawthorn & Gerhard 2016), and the stellar density profile is the one of the key issues for knowing the nature of the Milky Way. The Galactic thick disk is different from the Galactic thin disk by its unique chemistry, older age and higher elevation (e.g. Bensby 2014; Hawkins et al. 2015). It has been showed that an edge in the stellar disk could be in the range kpc from the surveys data (Habing 1988; Minniti et al. 2011).
The Milky Way’s stellar halo is an important component to understand our Galaxy’s formation history. Many observational studies have claimed the broken power-law slope of space density distributions with RR Lyraes (RRLs), globular clusters and blue horizontal branch stars so on (e.g., Saha 1985; Wetterer & McGraw 1996; Miceli et al. 2008; Bell et al. 2008; Watkins et al. 2009; Sear et al. 2010, 2011; Deason et al. 2011). The theoretical study of Font et al. (2011) predict the broken power-law slope of the mass-density profile. The study of Deason et al. (2013) always found the broken stellar halo profile of the Galaxy, and they theoretically explained the origin of the break radius in the RRL profiles in terms of the apocentric distance of the satellites that were accreted. More recently, Iorio et al. (2017) demonstrated the properties of the Galactic stellar halo with RRL in the Gaia data, and they showed that the inner halo ( kpc) stellar density profile is well approximated by a single power-law with exponent . Cohen et al. (2017) presented RRLs determined in the Palomar Transient Facility database, and derived the stellar density profile with the power-law index of -4 for the outer halo of the Milky Way.
RRL is a very good standard candle because of the narrow luminosity-metallicity-relation in the visual band and period-luminosity-metallicity relations in the near-infrared wavelengths. Besides, most of RRL stars are type ab RRLs (RRLab), and they are old ( Gyr) with low metallicity, so that they are mainly distributed in the bulge, thick disk and halo (Smith 1995; Demarque et al. 2000).
In this paper, we investigate density profiles of the Galactic thick disk and halo by using 1148 RRLab variable stars presented in our previous paper (Ablimit & Zhao 2017, hereafter paper I). We briefly describe our RRL sample and methods in §2. The kinematic and density information of the thick disk and halo are discussed in §3. In the last section (§4), the conclusions are given.
2 The sample and methods
The RRLab sample of this work were selected from 12227 RRLab stars of Catalina Surveys Data Release 1 (Drake et al. 2013a), and the cross matches were made with Sloan Digital Sky Survey (SDSS) spectroscopic data release 8 (DR8) and Large sky Area Multi-Object fiber Spectroscopic Telescope (LAMOST) DR4 within an angular distance of 3 arcsecond. LAMOST is a Chinese national scientific research facility operated by National Astronomical Observatories, Chinese Academy of Sciences (Zhao et al. 2006, 2012; Cui et al. 2012). We found 797 LAMOST matched RRLab stars and 351 SDSS matched RRLab stars with the corrected radial velocities (uncertainty ) and reliable metallicities (in the region of Galactic centric distance kpc, for more details see paper I).
An absolute magnitude-metallicity relation has been adopted for distance determination (Sandage 1981). The method of Chaboyer (1999) and Cacciari & Clementini (2003) is used in this work as,
| (1) |
where [Fe/H] is the metallicity of an RR Lyrae star. We find our overall uncertainties is around 0.15 mag from the uncertainties from the photometric calibration and the variations in metallicity and uncertainty in RRab absolute magnitudes (also see Dambis et al. (2013) for the uncertainty in absolute magnitude). The uncertainties of in distances are expected by our overall uncertainties of . The heliocentric and Galactocentric distances can be derived from the equations,
| (2) |
where average magnitudes were corrected for interstellar medium extinction using Schlegel et al. (1998) reddening maps, and
| (3) |
where , and are the distance from the sun to the Galactic center (8.33 kpc in this work, see Gillessen et al. 2009), Galactic longitude and latitude of the stars, respectively.
We obtain the fundamental (Galactic) standard of rest (FSR) of stars by using the heliocentric radial velocities (, the corrected ones:see our paper one) and the solar peculiar motion of (U, V, W) = (11.1, 12, 7.2) km (Binney & Dehnen 2010) which are defined in a right-handed Galactic system with U pointing toward the Galactic center, V in the direction of rotation, and W toward the north Galactic pole. The value of km is taken for the local standard of rest (, Reid at al. 2014) in the equation below,
| (4) |
For deriving the spatial density of our RRLab sample, we followed the density calculation as a function of Galactocentric distance described by Wetterer & McGraw (1996), as
| (5) |
is the number of RRLab as a function of distance and is the fraction of the total halo volume at sampled by the survey. The efficiency or completeness of sampling (selection process) is a way to achieve each for each individual field. Drake et al. (2013a) discussed the Catalina Surveys efficiency of RRL sampling, and their Figure 13 showed the detection completeness as a function of magnitude. We followed Drake et al. (2013a) for by adopting completeness as 70% for mag and it is gradually reach to 0% from to 20 mag.
3 Results
Our sample of 1148 RRLab stars contains 288 thick disc stars with kpc, and also 860 halo stars with kpc (see Figure 3 of paper I). We use the equations introduced above section to demonstrate the stellar number density and velocity distributions of the thick disk and halo.
3.1 The thick disk profile
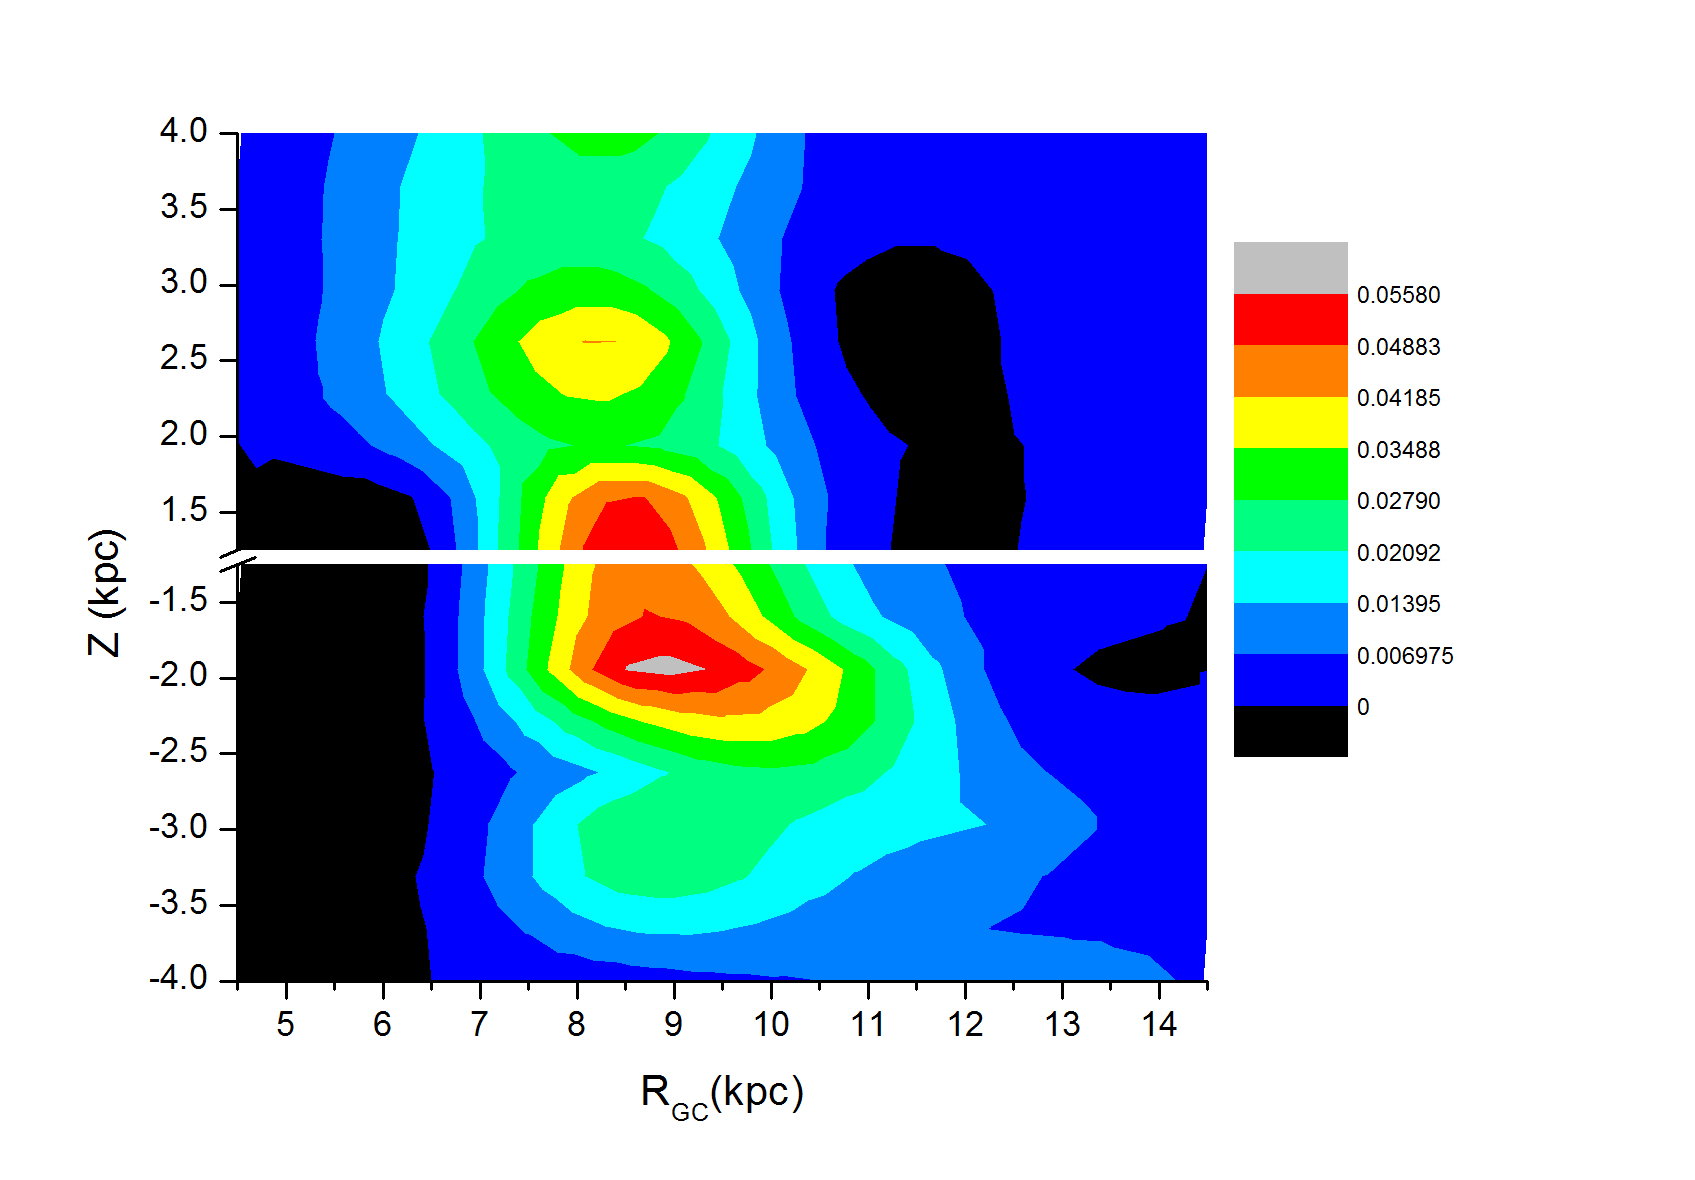
Figure 1 demonstrates the stellar density map in the –Z plane for the thick disk, the bin size is kpc. We assume the thick disk has a shape of cylinder, and get the volume from the and Z (Z as a height). The thick disk has a range of kpc in the vertical direction, and there is a gap between -1 and 1 kpc because of thin disk, RRLab stars are old and metal-poor stars. The tomographic map distributed in a Galactocentric distance range of 4.5–14.5 kpc. There are two ring areas in the Figure 1, the high density ring showed at the region of – kpc and – kpc, while the relatively lower density ring showed up at the region of – kpc and – kpc (for the similar results see Newberg et al (2003), Juri et al. (2008) and Ivezi et al. (2008)). LAMOST survey covers different areas at different longitudes. Thus, these two density regions might be caused by the selection effect of LAMOST. From – kpc the density distribution yield a heart shape between – kpc, and gradually decreases until kpc (the outer edge). Combining our results of the thick disk and halo, we agree the conclusion of Liu et al. (2017) which is that the disk smoothly transit to the halo without any truncation (also see Liu et al. 2017).
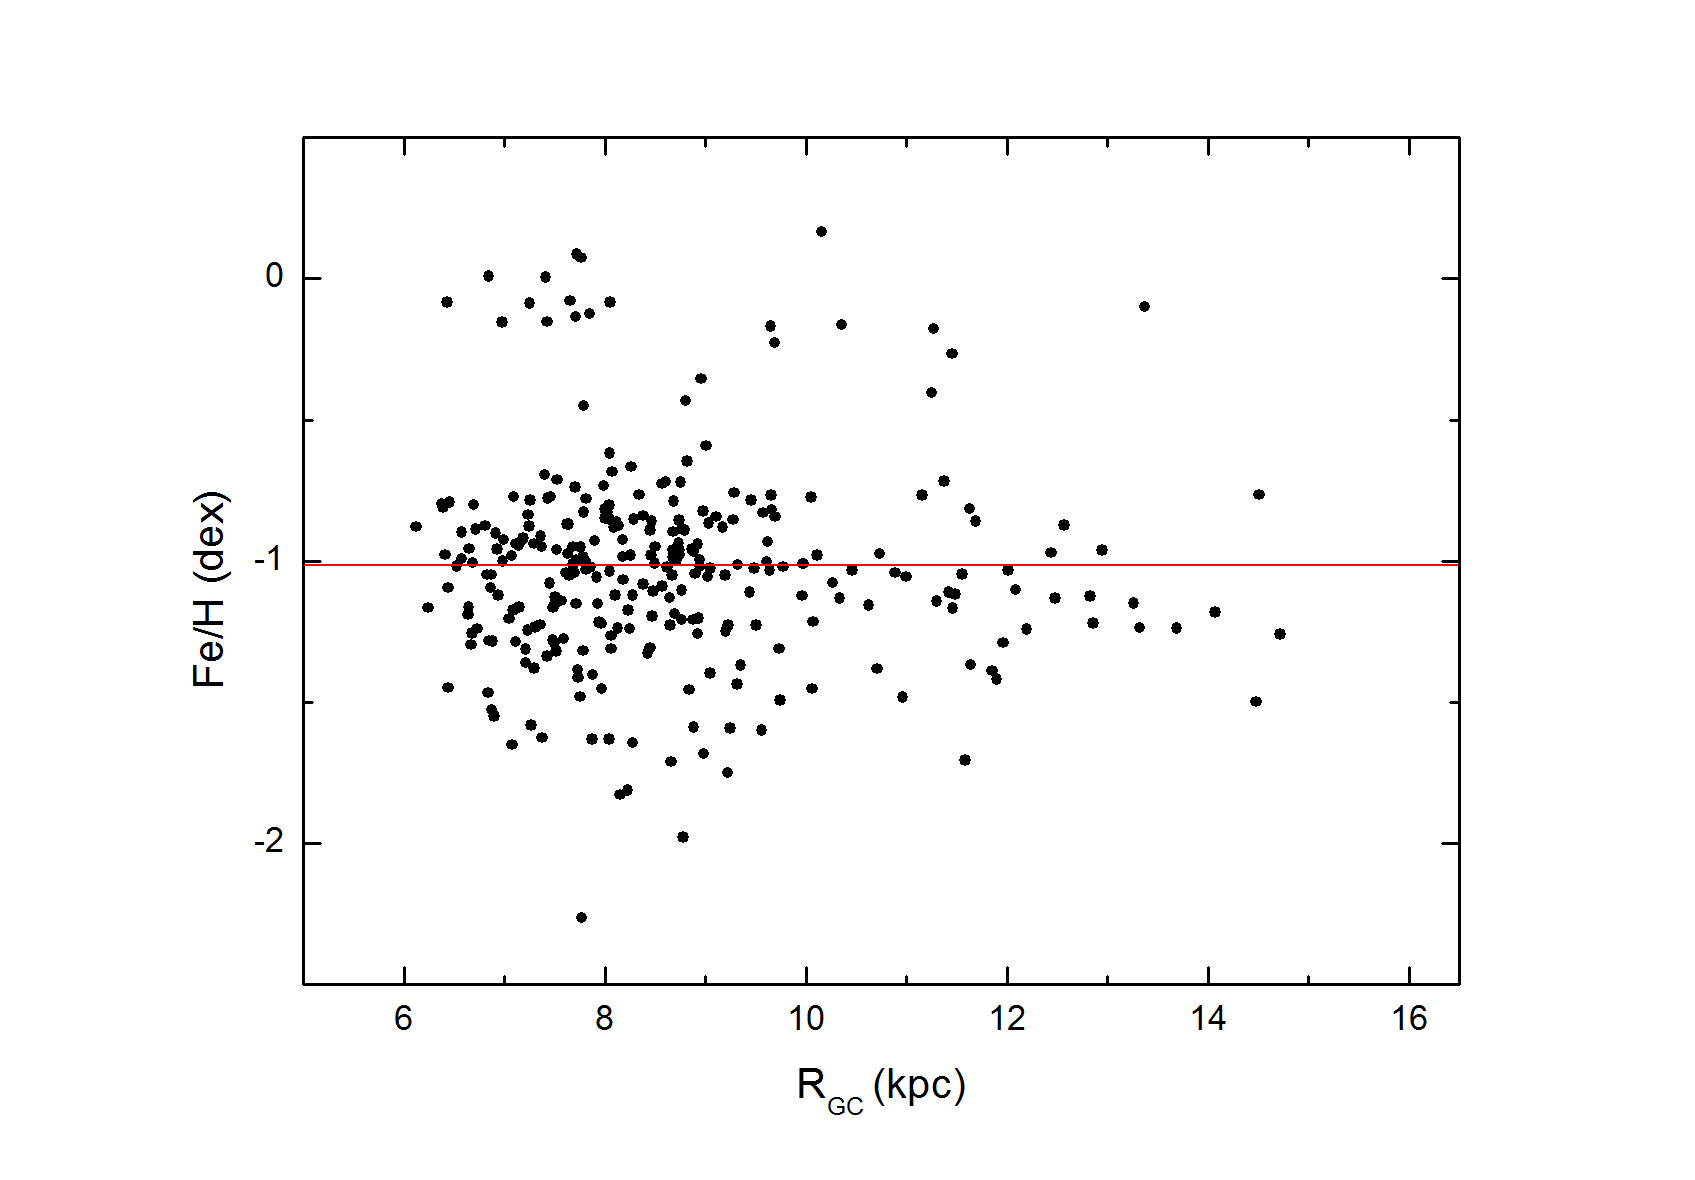
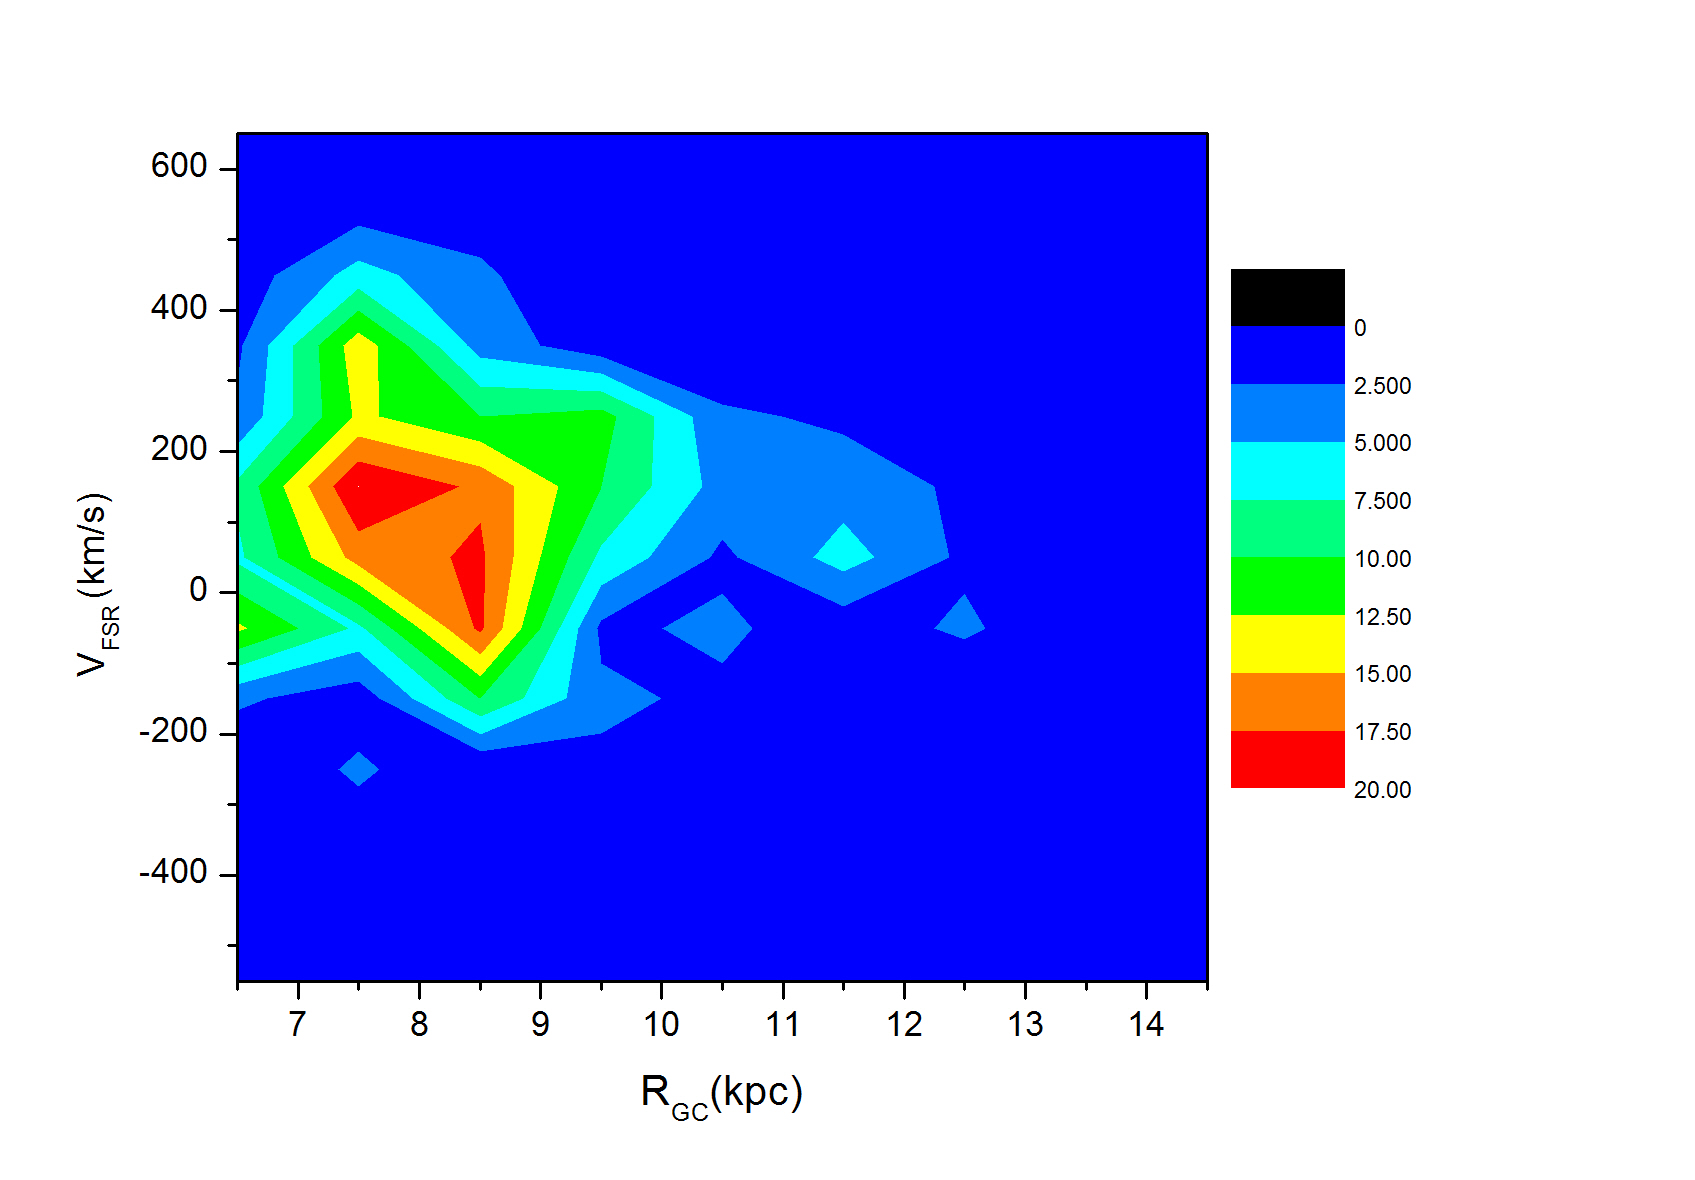
The metallicity and velocity profiles of the thick disk RRLab stars are given in the upper and lower panels of Figure 2. Most of the RRLab are metal-poor stars which have [Fe/H] around or lower than -1 dex while few of them with around 0. The red line in the upper panel of the figure is the mean value ([Fe/H]) of all the thick disk tracers. There are three stars which have the radial velocity -215 km around 7.5 kpc, while other the RRLab have the radial velocities higher than -210 km (see distribution in the lower panel of Figure 2).
3.2 The halo profile
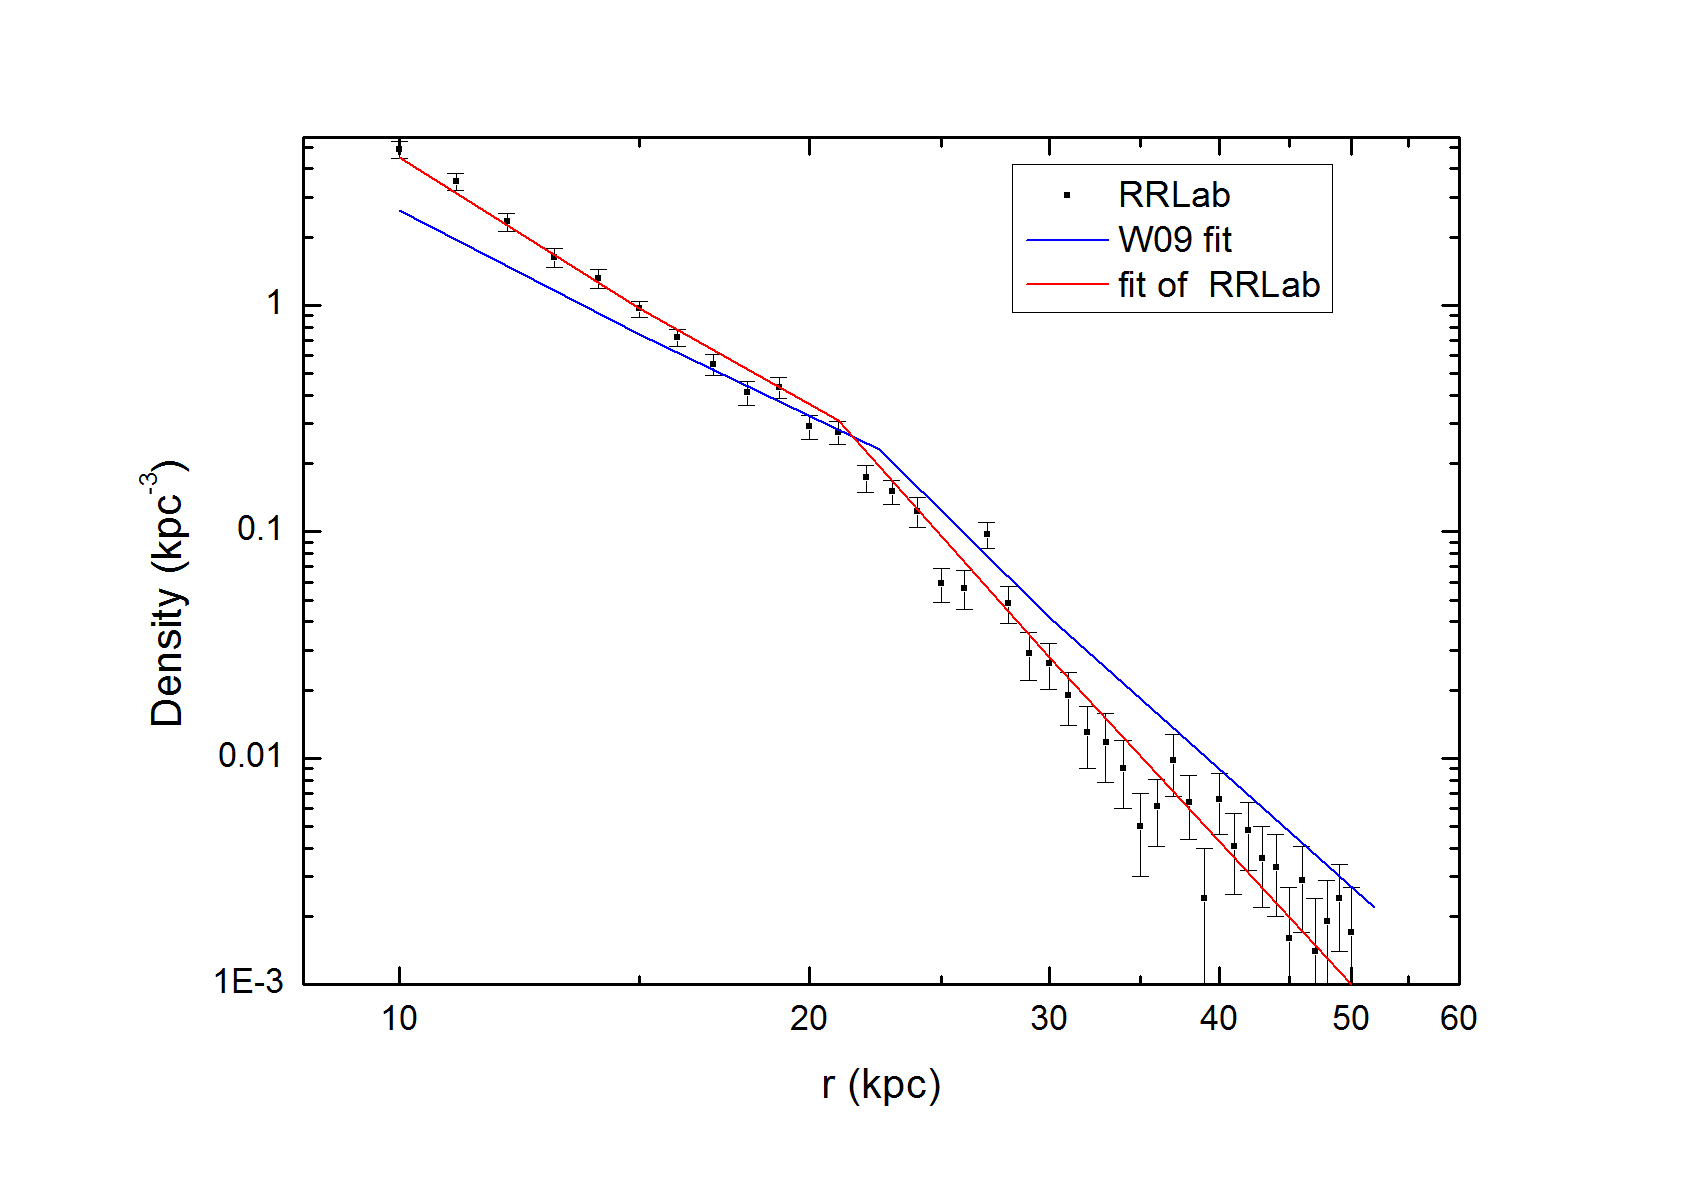
The number density of RRL has been on debate such as break or no break in the density distribution. Ivezi et al. (2000) claimed the existence of a break in the density distribution in the halo at kpc by using 148 SDSS RRLs. However, Ivezi et al. (2004) and Vivas & Zinn (2006) have found no break until 60 or 70 kpc. A broken-power law has been considered as a better number density profile for the RRLs by a number of works (e.g., Saha 1985; Sesar et al. 2007; Keller et al. 2008; Watkins et al. 2009; Akhter et al. 2012; Faccioli et al. 2014). Drake et al. (2013b) presented 1207 RRLs taken by the Caltalina Survey’s Mount Lemmon telescopes, and found the number density out to 100 kpc with 70% detection efficiency and a break appeared around 50 kpc (see the Figure 12 of Drake et al. (2013b)). They claimed their density profile is good agreement with the Watkins et al.(2009), and the different break is caused by the density enhanced by RRLs in the Sagittarius stream leading and trailing arms. We further analyze 860 RRLab stars from Drake et al. (2013a) by combining LAMOST DR4 and SDSS DR8 data to show the density profile in the 9–50 kpc range. We consider a spherical averaged number density and fit by following formula,
| (6) |
and derive the following values for the halo parameters : , kpc, and (see Figure 3). Watkins et al. (2009) gave their best results as: . Faccioli et al. (2014) demonstrated 318 RRLs observed by Xuyi Schmidt telescope photometric survey, and obtained the density profiles by including and removing the possible Sagittarius RRLs. There is not a significant difference between their results with and without Sagittarius RRLs. Their spherical double-power model results are shown in their table 2, and the result with all RRLs are , kpc, and . It is obvious that our result are strongly supports the results of Watkins et al. (2009) and Faccioli et al. (2014).
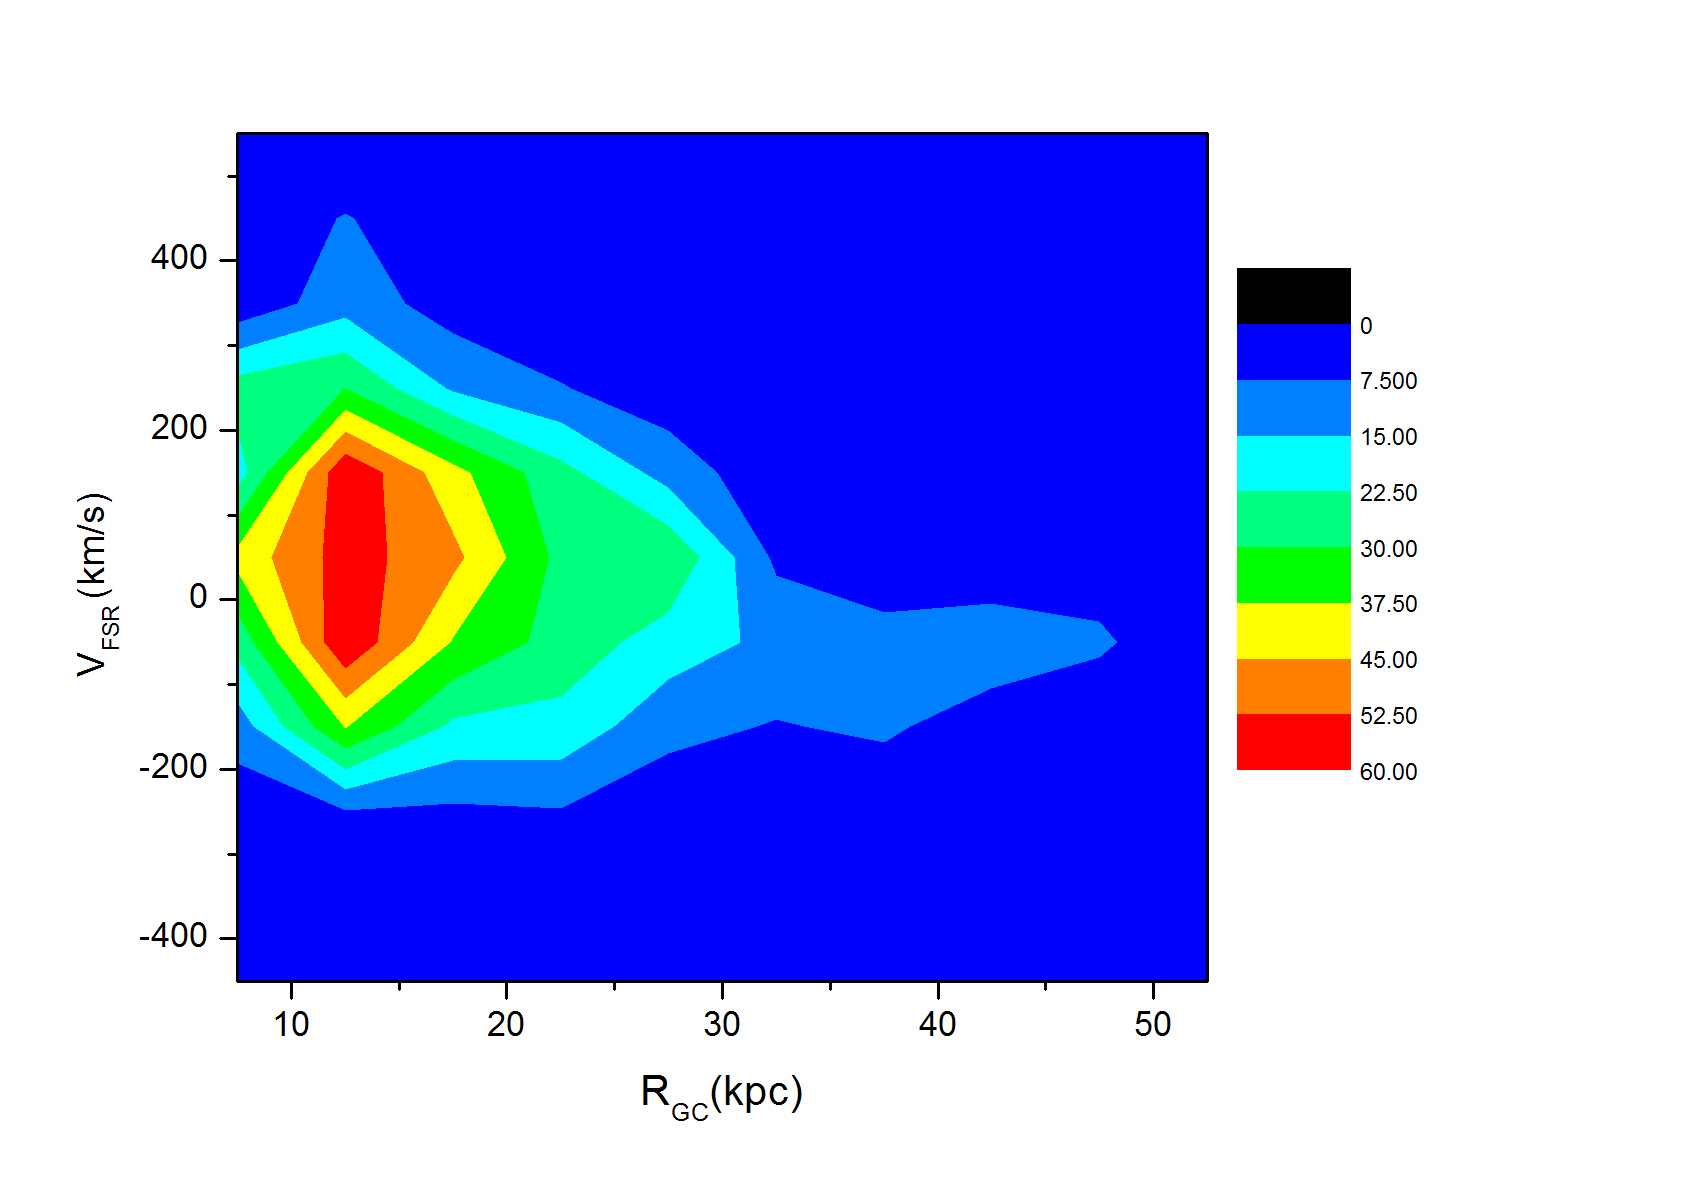
Figure 4 shows the velocity distributions of 860 RRLab stars. In general, the radial velocities of RRLab stars are smoothly distributed with the distance, and a small part has a higher radial velocities at inner Galaxy, this may caused by the stream effect. We find the radial velocity dispersion at 50 kpc is 78 km (for more details also see paper I), which is smaller than 90 km derived by Cohen et al. (2017). We used 860 RRLab stars to measure the radial velocity dispersion for the halo based on the SDSS and LAMOST spectroscopic surveys, and Cohen et al. (2017) determined the radial velocity dispersion by only using 112 RRLs based on the moderate resolution spectra with Deimos on the Keck 2 Telescope.
4 Conclusions
In this work, we have investigated the density profiles and velocity distributions of the thick disk and halo of the Milky Way, based on 1148 RRLab variables with precise distances (7% uncertainty) and reliable radial velocities (uncertainty 15 km ) presented in paper I. The 288 thick disk RRLab stars have the mean metallicity of [Fe/H]. Despite three RRLab with the radial velocity lower than -215 km , other disk tracers distributed in a region -210 km . Our result shows that the edge of the thick disk is around 14.5 kpc. The halo of the Milky Way have been studying by using RRLab variables. Comparing to previous works, we present a larger sample (860) of halo RRLab variables with the mean metallicity of [Fe/H]. The stellar density distribution of the halo tracers can be well fitted by a broken power-law, and power law index of -2.8 for 21 kpc & the index of -4.8 for 21 kpc. This density distribution is agreed by most of other works, especially by the works which used RRLs as the tracer. The radial velocity dispersion at 50 kpc is 78 km , and few halo tracers show high radial velocities while that of others smoothly distributed.
Acknowledgements
This work is supported by JSPS International Postdoctoral Fellowship of Japan (P17022, JSPS KAKENHI grant no. 17F17022), and also supported by National Natural Science Foundation of China under grant number 11390371 and 11233004. Guoshoujing Telescope (the Large Sky Area Multi-Object Fiber Spectroscopic Telescope LAMOST) is a National Major Scientific Project built by the Chinese Academy of Sciences. Funding for the project has been provided by the National Development and Reform Commission. LAMOST is operated and managed by the National Astronomical Observatories, Chinese Academy of Sciences.
REFERENCES
Ablimit, I. & Zhao, G. 2017, ApJ, 846, 10
Akhter, S., Da Costa, G. S. et al. 2012, ApJ, 756, 23
Bell, E. F., Zucker, D. B., Belokurov, V., et al. 2008, ApJ, 680, 295
Bensby, T. 2014, A&A, 562, A71
Binney, J. J., & Dehnen, W. 2010, MNRAS, 403, 1829
Bland-Hawthorn, J. & Gerhand, O. 2016, ARA&A, 54, 529
Cacciari, C., & Clementini, G. 2003, in Stellar Candles for the Extragalactic Distance Scale, ed. D. Alloin & W. Gieren (Lecture Notes in Physics, Vol. 635; Berlin: Springer), 105
Chaboyer, B. 1999, in Post-Hipparcos Cosmic Candles, ed. A. Heck & F. Caputo (Astrophysics and Space Science Library, Vol. 237; Dordrecht: Kluwer), 111
Cohen, G. J., Sesar, B., Bahnolzer, S., et al. 2017, arXiv:1710.01276v1
Cui, X-Q., Zhao, Y-H., Chu, Y-Q. et al., 2012, RAA, 12, 1197
Dambis, A. K., Berdnikov, L. N., Kniazev, A. Y. et al. 2013, MNRAS, 435, 3206
Deason, A. K., Belokurov, V. & Evans, N. W. 2011, MNRAS, 416, 2903
Deason, A. J., Belokurov, V., Evans, N. W. & Johnston, K. V. 2013, ApJ, 763, 113
Demarque, P., Zinn, R., Lee, Y-W. & Yi, S. 2000, AJ, 119, 1398
Drake, A. J., Catelan, M., Djorgovski, S. G., et al. 2013a, ApJ, 763, 32
Drake, A. J., Catelan, M., Djorgovski, S. G., et al. 2013b, ApJ, 765, 154
Faccioli, L., Smith, M. C. et al. 2014, ApJ, 788, 105
Gillessen, S., Eisenhuaer, F., Trippe, S., et al. 2009, ApJ, 692, 1075
Habing, H. 1988, A&A 200, 40
Hawkins, K., Jofre, P, Masseron, T. & Gilmore, G. 2015, MNRAS, 453, 758
Iorio, G., Belokurov, V., Erkal, D. et al. 2017, arXiv:1707.03833v2
Iverzi, . et al. 2000, AJ, 120, 963
Iverzi, . et al. 2004, in Clemens D., Shah R. Y., Brainerd T., eds, APS Conf. Ser. Vol. 317, Milky Way Survey: The Structure and Evolution of Our Galaxy. Astron. Soc. Pac., San Francisco, p. 179
Iverzi, ., Sesar, B., Juri, M. et al. 2008, ApJ, 684, 287
Juri, M., Iverzi, ., Brooks A. et al. 2008, ApJ, 673, 864
Keller, S. C., Murphy, S. et al. 2008, ApJ, 678, 851
Liu, C., Xu, Y., Wan, J-C. et al. 2017, RAA, 17, 96L
Miceli, A., Rest, A., Stubbs, C. W. et al. 2008, ApJ, 678, 865
Minniti, D., Saito, R., Alonso-Garcia, J., Lucas, P. & Hempel, M. 2011, ApJ, 733, L43
Newberg, H. J., Yanny, B., Rockosi, C. et al. 2002, ApJ, 569, 245
Reid, M. J., Menten, K. M., Brunthaler, A. et al., 2014, ApJ, 783, 130
Saha, A. 1985, ApJ 289, 310
Sandage, A. R. 1981, ApJ, 248, 161
Sesar, B. et al., 2007, ApJ, 134, 2236
Sesar, B. et al., 2010, ApJ, 708, 717
Sesar, B. et al., 2011, ApJ, 731, 4
Smith, H. A. 1995, IrAJ 22, 228S
Watkins, L. L., Evans, N. W., Belokurov, V. et al. 2009, MNRAS, 398, 1757
Wetterer, C. J. & McGraw, J. T. 1996, AJ, 112, 1046
Zhao, G., Chen, Y.-Q., Shi, J.-R. et al. 2006, ChJAA, 6, 265
Zhao, G., Zhao, Y.-H., Chu, Y.-Q., Jing, Y.-P., Deng, L.-C. 2012, RAA, 12, 723