Thermocapillary-driven fluid flow within microchannels
Abstract
Surface tension gradients induce Marangoni flow, which may be exploited for fluid transport. At the micrometer scale, these surface-driven flows can be more significant than those driven by pressure. By introducing fluid-fluid interfaces on the walls of microfluidic channels, we use surface tension gradients to drive bulk fluid flows. The gradients are specifically induced through thermal energy, exploiting the temperature dependence of a fluid-fluid interface to generate thermocapillary flow. In this report, we provide the design concept for a biocompatible, thermocapillary microchannel capable of being powered by solar irradiation. Using temperature gradients on the order of degrees Celsius per centimeter, we achieve fluid velocities on the order of millimeters per second. Following experimental observations, fluid dynamic models, and numerical simulation, we find that the fluid velocity is linearly proportional to the provided temperature gradient, enabling full control of the fluid flow within the microchannels.
Keywords: Thermocapillary, microfluidics, lab-on-a-chip, Marangoni flow, thermal gradients
1 Introduction
Microfluidic devices have greatly improved within the last 30 years following the development of microelectromechanical systems (MEMS) Fan , Ho . These miniature devices manipulate small volumes of fluids, on the order of nano and microliters, for fundamental studies of individual cells and macromolecules as well as clinical assays Stone . At these length scales, typically less than a millimeter, viscous and other surface forces dominate, providing challenges for controlling fluid transfer Sitti . Traditionally, mechanical pumps are utilized for generating the pressure gradients necessary for driving fluid flow. However, other attractive methods have arisen due to their efficiency at small scales and controllability given certain signals, including the use of enzymatic reactions Sengupta , Das , capillary effects, sound, and electric and magnetic fields Stone .
Surface tension arises from an imbalance of intermolecular forces between molecules on the surface of a fluid. At small length scales, these forces are prevalent. Therefore, fluid transport via capillary action is very attractive for applications at the micrometer scale Stone , Darhuber , Karbalaei . Biological systems exploit such surface forces Bourouiba , either for propulsion Bush , spore dispersal Money , adhesion Federle , feeding Kim , or respiration Notter . These biological systems use changes in surface tension to generate large forces at small length scales.
Fluid motion due to surface tension gradients has been documented for over 150 years Thomson , Marangoni . Gradients in surface tension can be produced magnetically, electrically, chemically, or thermally. In engineered systems, fluid transport using electric fields has been widely applied Prins , Janocha , Chung , Luo . By using electrically conductive fluids, applied electric potentials will alter the apparent surface tension at a liquid-solid interface–commonly referred to as electrowetting Colgate . The use of electric fields to induce surface tension gradients and drive fluid flows is especially appealing for use in electronics, such as for liquid-cooling systems in microelectronics. However, it is limited to electrically conductive fluids.
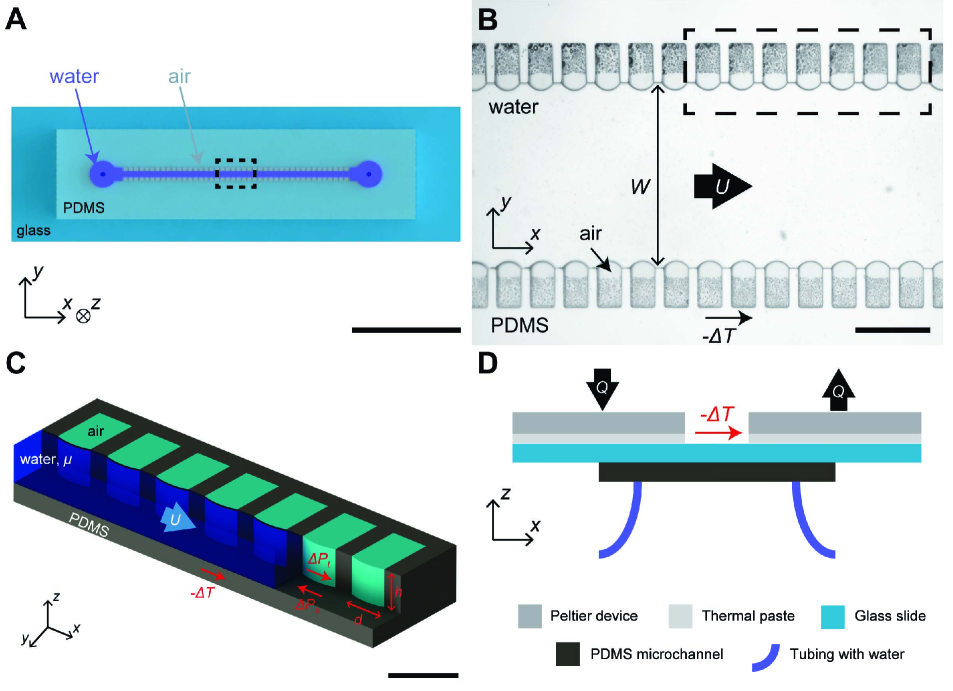
Temperature differences also induce surface tension gradients Benard , since the interfacial tension of fluid-fluid interfaces depends on the local temperature Shereshefsky . While this phenomenon has been studied for over 100 years, it has only recently received attention for use in practical applications Kataoka , Maggi , Sammarco , Ohta , Hu . In this study, we demonstrate the first enclosed thermocapillary-driven pump for microfluidics. This pump was proposed theoretically in a previous study Baier . Here, we present the proof of concept microfluidic channel with the walls lined with fluid-filled cavities that introduce fluid-fluid interfaces (Fig. 1a-c). A temperature gradient across the interfaces was introduced using external heating and/or cooling. By inducing temperature gradients on the order of degrees Celsius per centimeter, we pumped water with flow speeds on the order of millimeters per second.
2 Results
Microfluidic channels were fabricated out of PDMS and polyurethane and bonded to glass coverslips or slides. An array of small cavities ( m wide and 150 m deep) lined the two side walls. These cavities were used to trap fluids, i.e., air, silicone oil, or dodecanol, generating fluid-fluid interfaces with the bulk fluid (water). A typical PDMS channel with air trapped in the cavities is shown in Fig. 1a-c.
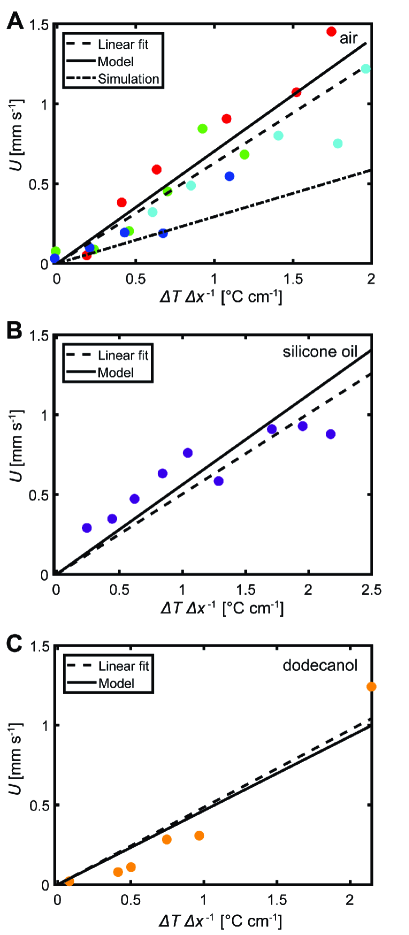
By imposing a temperature gradient across the length of the channel , we generated a surface tension gradient that resulted in bulk flow of the water. As shown in Fig. 2, the fluid velocity along the length of the channel was found to vary linearly with the temperature gradient for all three of the trapped fluids.
The temperature gradient was generated using two Peltier devices spaced 10 mm apart, as shown in Fig. 1d. An electrical current was applied across each Peltier device to generate heat on one of the faces. The Peltier devices were oriented in opposite directions so that one transfers heat to the channel, while the other transfers out of the channel. The temperature difference was measured using two thermocouples placed beneath each Peltier device.
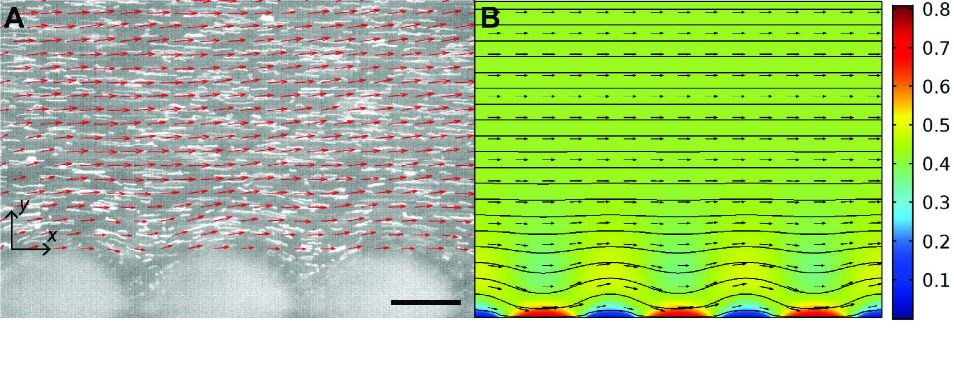
The fluid velocity was measured using particle image velocimetry at the micrometer scale (or micro-PIV). Details on the procedure can be found in the Methods. By seeding the bulk water with 1-m fluorescent particles and exciting them with a high-powered laser, we observed their motion and deduced the flow within the microfluidic channels. Fig. 3a shows streaklines and the velocity field for a typical experiment with air trapped in the cavities. The streaklines represent the motion of the particles during one second of filming at 200 Hz. Typical videos obtained using micro-PIV are shown in the electronic supplementary material, video S1. By visualizing the flow, we observed bulk fluid motion within the microchannels with a velocity , which was induced by the temperature gradient .
The observed linear relationship between and was modeled through a force balance on the bulk water. Two forces act on the flowing water, viscous and thermocapillary. The viscous forces are , where is the pressure gradient associated with viscous shear losses and is the surface area on the top and bottom walls of the channel where shearing occurs. The thermocapillary forces are , where is the pressure gradient associated with thermocapillary effects and is the cross-sectional area of the channel. By using a control volume that encompasses one unit cell of the fluid-fluid interface, we may assume since , where m is the height of the channel as depicted in Fig. 1c.
The pressure gradient generated by the temperature-induced surface tension gradient along the fluid-fluid interfaces is , where is the temperature dependence of the interfacial tension at the fluid-fluid interface. This value has been previously measured for the fluid-fluid interfaces used in this study Baier , Peters , Villers . The values are , 12, and 0.10 mN m-1 ∘C-1 for air-water, silicone oil-water, and dodecanol-water, respectively. The interfacial tension between air and water decreases with increasing temperature, while it increases with increasing temperature for water and silicone oil and dodecanol. These values were reported for a temperature range of ∘C, and our experiments were conducted within the same range. Fig. 1b-c show how the velocity and temperature gradient are in opposite directions for air-water interfaces. The shear resisting the fluid motion on the top and bottom walls is responsible for pressure losses, expressed as , where is the dynamic viscosity of the bulk fluid (water) and is the velocity vector.
The thermocapillary pressure gradient was simplified by assuming a linear temperature gradient; therefore, , where is the temperature difference between the two Peltier devices and is the distance between the points where the temperatures were measured. Additionally, the losses due to shear were simplified by assuming a linear velocity gradient with respect to the channel depth , and uniform velocity across the channel (in ). Then, it follows that .
With these assumptions and through a force balance, we may solve for the flow velocity by balancing the two pressure gradients, or , thus resulting in
| (1) |
We found that this model provided an accurate representation of the observed fluid mechanics. As shown in Fig. 2, the model predicts the slope of the linear relationship within 12%, 12%, and 4% error for air-water, silicone oil-water, and dodecanol-water, respectively.
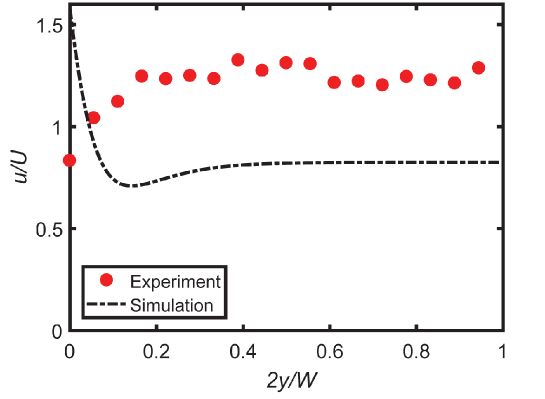
To gain further insight into this phenomenon, especially the bulk flow, we used numerical simulation. We used a two-dimensional (2D) geometry (see electronic supplementary material Fig. S3) to simulate the flow through the center plane of the channel, where the maximum flow is expected. The boundary conditions used in the simulation (electronic supplementary material Table S1) were adapted from a previous study Baier . We found that while the numerical simulations captured the linear relationship between and , they predicted much lower velocities (Fig. 2a) with an error of 53% for the slope.
However, the simulations provided qualitative agreement with the experimental observations (compare Fig. 3a-b). The streaklines and streamlines in the experiments and simulation both exhibited bulk fluid motion even away from the fluid-fluid interfaces along the side walls, as depicted by the velocity distribution in the electronic supplementary material Fig. S4. Therefore, we have successfully demonstrated the first enclosed thermocapillary micro-pump. While others have exploited the thermocapillary phenomenon to drive particles through a fluid Maggi , Sammarco , Hu , Ohta or to transport thin fluid films Kataoka , we directly applied thermocapillary stresses to a fluid and generated bulk motion within a closed microchannel. Additionally, we have found that our thermocapillary pump outperforms the one first proposed by previous researchers (compare the dashed and dash-dot lines in Fig. 2a) Baier .
The simple design, a polymer microchannel bonded to glass, and low thermal energy required by the thermocapillary phenomenon, watt, make our device attractive for lab-on-a-chip applications, especially in point-of-care (POC). Moderate temperature gradients, on the order of degrees Celsius per centimeter, can pump fluids through microfluidic devices without the use of traditional electrical micro-pumps. Additionally, the phenomenon is not restricted to electrically conductive fluids, like electrocapillary pumping or electro-wetting.
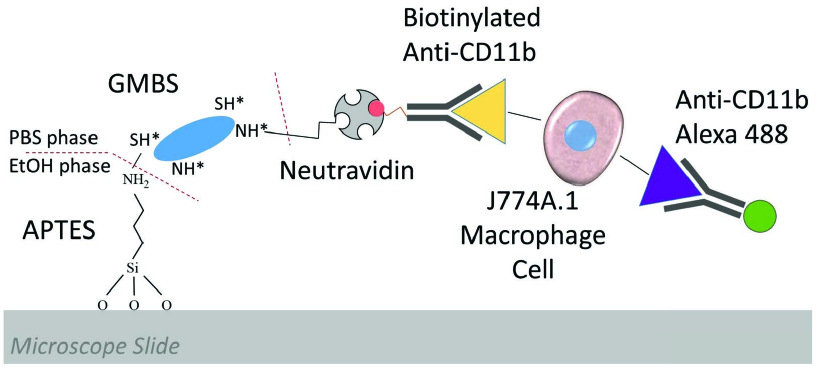
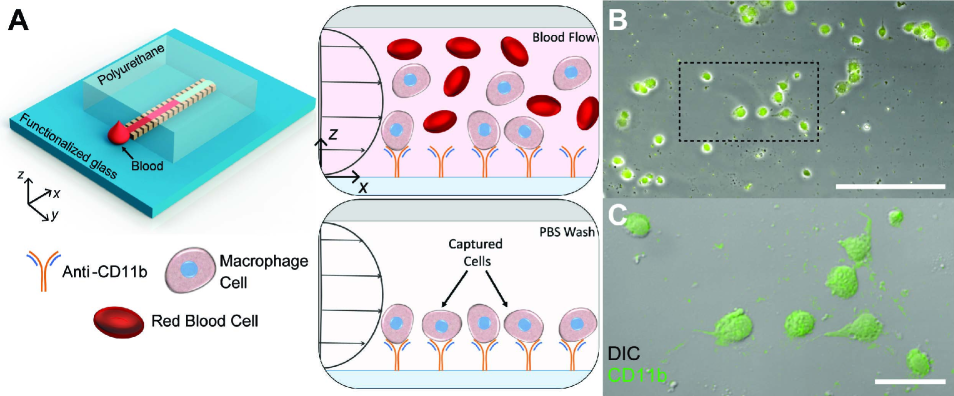
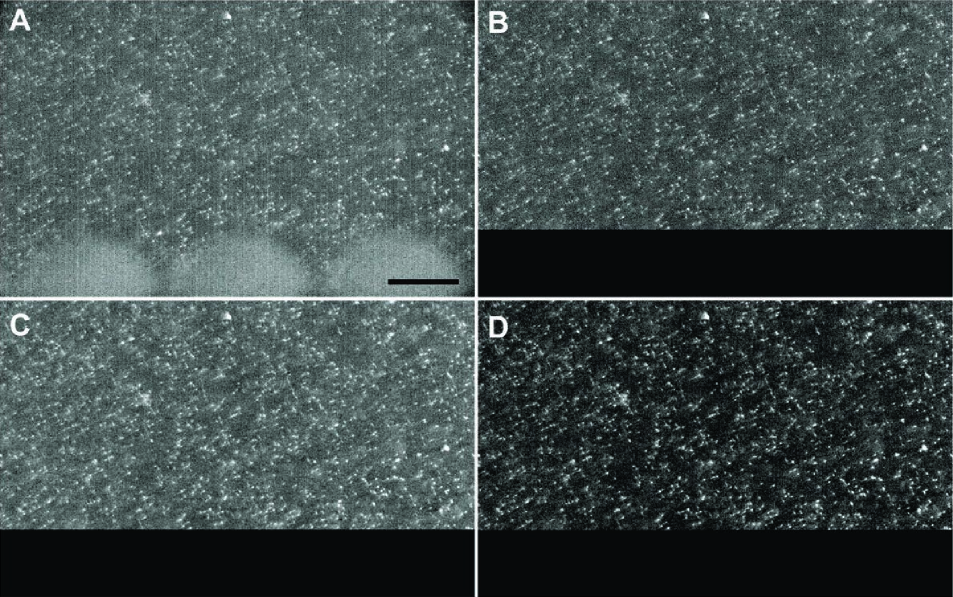
To demonstrate the device’s functionality, we used it to pump blood samples spiked with specific leukocyte subpopulations over functionalized glass for selective isolation of the leukocytes within the blood. A schematic of the demonstration is shown in Fig. 4a. A drop of blood spiked with CD11b+ monocytes and macrophages was placed at the inlet of the microchannel, and then pumped through using thermocapillary effects. After the blood was pumped through, phosphate-buffered saline (PBS) was pumped to wash away red blood cells. The CD11b+ monocytes and macrophages were immobilized on the glass via binding to antibodies functionalized on the surface (Anti-CD11b). Details on the surface functionalization can be found in the electronic supplementary material Fig. S5. With our demonstration, we found effective isolation of CD11b+ leukocytes with high specificity, as shown in the fluorescent images in Fig. 4b-c. Our thermocapillary micropump was capable of pumping a heterogeneous biological fluid and power a functional cell isolation assay, and can be further utilized for diagnostic and monitoring at the POC.
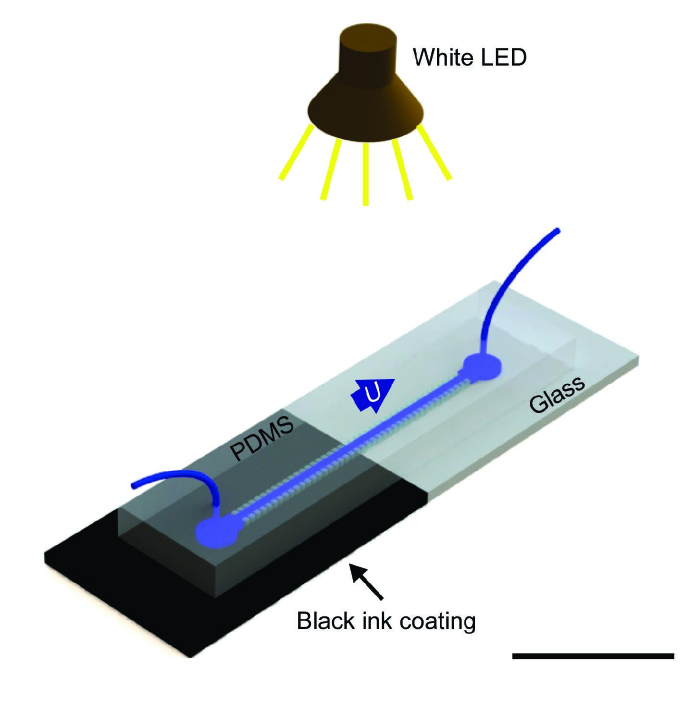
We tested to determine if our device could be powered by solar irradiation at the POC. A schematic of the experiment is shown in Fig. 5. Air was trapped in the cavities by water and the flow was observed with 1-m polystyrene seeding particles. A high-intensity white LED was used to simulate the typical irradiation experienced on the Earth’s surface, or 100 mW cm-2. Half of the thermocapillary channel was coated with black ink to absorb the thermal energy and generate a temperature gradient. The electronic supplementary material, video S2, shows the observed flows for irradiations of 44 and 88 mW cm-2, which produced temperature differences and ∘C, respectively. The observed flows were significant, or and 10 m s-1, respectively. Therefore, solar irradiation provided enough thermal energy to drive fluid flow. Thermocapillary-driven microfluidic devices may be operated in remote locations where electricity is not available.
3 Discussion
In this study, we presented the design of an enclosed thermocapillary-driven microfluidic channel. This device exploits surface tension gradients induced by temperature differences for fluid transport. We used micro-PIV to provide a quantitative observation of the fluid flow. Numerical simulation and fluid mechanic modeling revealed the underlying physics. The model provided an accurate representation of the phenomenon; therefore, the channel geometry and working fluids may be designed to generate the desired fluid flows.
We investigated the thermocapillary flow with three different fluid-fluid interfaces: air-water, silicone oil-water, and dodecanol-water. However, it is not limited to these particular interfaces. Other fluid-fluid interfaces may be used, and future studies should be pursued to determine other successful interfaces. The selection of working fluids may be a function of the application since their interfacial tension will determine the flow direction and velocity. The geometry of the microchannel may also be tuned to create more complex flows, especially with integration of MEMS.
Microfluidics offer the potential to revolutionize clinical practice in diagnosis and monitoring of various debilitating diseases, from cancer to sickle cell disease, due to their time- and cost-efficient operation using only miniscule volume of reagents and clinical samples. Even though most developed microfluidic technologies can fit on tiny cover glasses with small fingerprints, these technologies also require bulky periphery equipment for operation, such as syringe pumps. Use of syringes and syringe pumps increases the required reagent and sample volumes due to dead volumes within the syringe, needle, and long tubing. All these factors significantly hamper the application and translation of microfluidic technologies at the POC, especially at low-resource settings with limited electricity supply in the field. The thermocapillary micropump presented here has the potential to replace bulky syringe pumps and, due to its low power consumption, can enable translation of various microfluidic clinical assays for portable and hand-held operation at the POC.
In short, this platform is capable of continuously driving fluid flows without the use of conventional fluid pumps and irrespective of the electrical conductivity of the working fluid. We demonstrated our device’s capability of functioning with heterogeneous biological fluids, in this case blood, for diagnostic applications. Additionally, our device was able to pump fluids using only solar irradiation, making it possible to operate without the use of electricity.
4 Methods
4.1 Microfluidic channel fabrication
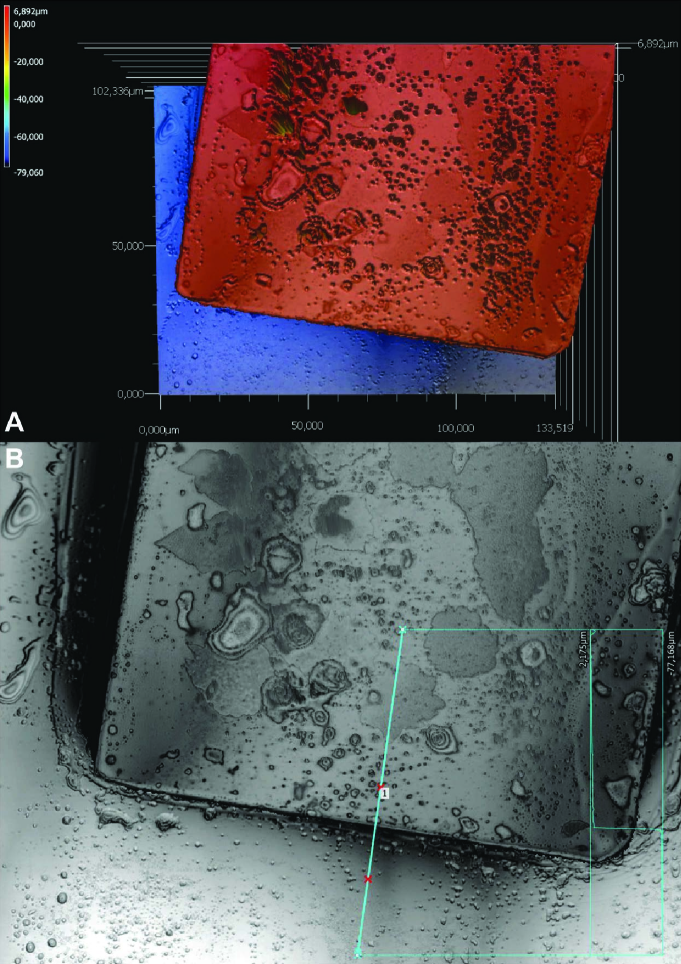
The microfluidic channels were fabricated using photolithography and polymer molding. The channels were 27 mm long, 1 mm wide, and m deep with two circular reservoirs (3 mm diameter) for the inlet and outlet. The exact height of the channels was measured using a laser profilometer (Keyence VK-X200, Neu-Isenburg, Germany), as shown in the electronic supplementary material Fig. S1. The laser scans were conducted using an objective with 100X magnification. The walls of the channel were lined with 150-m long and 50-m wide fins, equally spaced by m. The space between the fins trapped air, silicone oil, or dodecanol, as shown in Fig. 1a-c.
For fabrication, first, a mask of the channel was fabricated on sodalime glass by Compugraphics Jena GmbH (Jena, Germany). This mask was then used to fabricate a mold using SU-8 photoresist (micro resist technology GmbH, Berlin, Germany). The photoresist was spin-coated (WS-650MZ-8NPPB, Laurell Technologies, North Wales, PA, USA) to a thickness of approximately 100 m onto a 3-in silicone wafer. Next, the photoresist was etched using UV irradiation (MJB 4 mask aligner, SUSS MicroTec, Garching, Germany). Finally, the SU-8 mold was used to cast polydimethylsiloxane (PDMS; Sylgard 184, Dow Corning, Inc., Midland, MI, USA) and polyurethane (ST-1087, BJB Enterprises, Inc., Tustin, CA, USA) channels. In order to seal a channel, it was bonded to a glass coverslip (24 x 60 x 0.15 mm). The bonding was achieved by first etching the channel and glass using oxygen plasma (Diener Electronic Zepto, Ebhausen, Germany). The channel and glass were pressed together and then baked for 30 minutes at 60 ∘C. This process ensured a tight bond and prevented any leakage.
4.2 Particle image velocimetry (PIV) and heating and cooling through the Peltier effect
The fluid flow inside of the microfluidic channels was characterized through the use of particle image velocimetry (PIV). Water was seeded with 1-m polystyrene particles embedded with a fluorochrome dye (Molecular Probes, Inc., Eugene, OR, USA; 1.1 0.035 m) that excites at a wavelength of 535 nm and emits at 575 nm for fluorescence imaging. The particles were excited using a 10 mJ, 1000 Hz, 527-nm laser (Dantec Dynamics A/S, Skovlunde, Denmark) and imaged through a fluorescence stereomicroscope (Leica M165 FC with PLAN APO 2.0x CORR objective, Wetzlar, Germany). The videos were captured using a high speed camera (Vision Research SpeedSense M310, Wayne, NJ, USA) at 200 Hz for 500 frames, or 2.5 seconds, at 58x magnification. Typical videos obtained are shown in the electronic supplementary material, video S1.
For processing the images obtained, we used the built-in functions in DynamicStudio 2016a (Dantec Dynamics) software. The same analysis sequence was used for each trial. First, we coupled each image pair, or made double frames. With this function, we were able to obtain 250 image pairs from the 500 frames captured. Next, we defined a mask to exclude the fins and fluid trapped in the cavities along the channel wall, focusing only on water in the bulk. Then, we found the minimum image value for each image pair and subtracted it in order to eliminate the background and isolate the particles. Next, we applied a low-pass Gaussian filter. Then, we again subtracted the minimum image value to further eliminate the background. Finally, we calculated vector fields for each image pair with a vector every 32 pixels. Typical image pairs obtained after each processing step are shown in the electronic supplementary material Fig. S2.
After obtaining the vector fields, we averaged them to obtain an overall average vector field for each trial. To report the flow velocity , we found the average horizontal velocity within a 350 m by 20 m rectangle immediately above the trapped fluid. This value is the velocity reported throughout the text and in Fig. 2.
Because of the inlet and outlet conditions of the microchannels, there was an observed minimum temperature gradient required to initiate the flow. The inlet and outlets of the channels were connected to tubing (ID 0.5 mm, OD 1.5 mm, length 50 mm; Tygon® Tubing, Cole-Parmer GmbH, Wertheim, Germany) via an inserted metal tube (24 gauge: ID 0.31 mm, OD 0.57 mm, length 8 mm). This connection introduced a 90∘ turn into the channel, as well as a constriction followed by an expansion in the width of the fluid. Flow constrictions have been observed to cause pressure drops in microchannels in the Stokes flow regime Lee , akin to flows within ducts in the laminar flow regime Munson . In order to correct for this observed phenomenon, we corrected the temperature gradient for each trial so that at . Each trial was corrected individually due to slight variations in the fabrication of each channel. This correction was made for all trials (Fig. 2).
The temperature gradient across the microfluidic channels was induced using thermoelectric modules that use the Peltier effect (European Thermodynamics Limited ETC-200-14-06-E, Leicestershire, UK). Two modules were used, one to heat and one to cool, spaced 10 mm apart. They were supplied electrical currents varying from 0.8 to 1.6 amps. To ensure good thermal contact between the modules and the channels, we applied silicone thermal grease (Heat Sink Compound Plus, 2.9 W/m-K; RS Components Ltd., Northants, UK) evenly on the contact surface.
The channel and thermoelectric modules were mounted in a custom, 3D-printed stand Fig. 2a. Additionally, thermocouples were integrated to measure the temperature difference (OMEGA Engineering RDXL6SD with Type K thermocouples, Norwalk, CT, USA). The heating/cooling, temperature measurement, and PIV recording were synchronized using an Arduino processor (make and model). The experimental procedure is as follows. First, the heating and cooling are initiated. Then, the PIV videos are captured after 30 seconds. Finally, the temperature difference is measured at the instant when acquisition started. The 30 second delay ensures that the temperature difference and flow velocity reach a steady state.
4.3 Numerical simulation
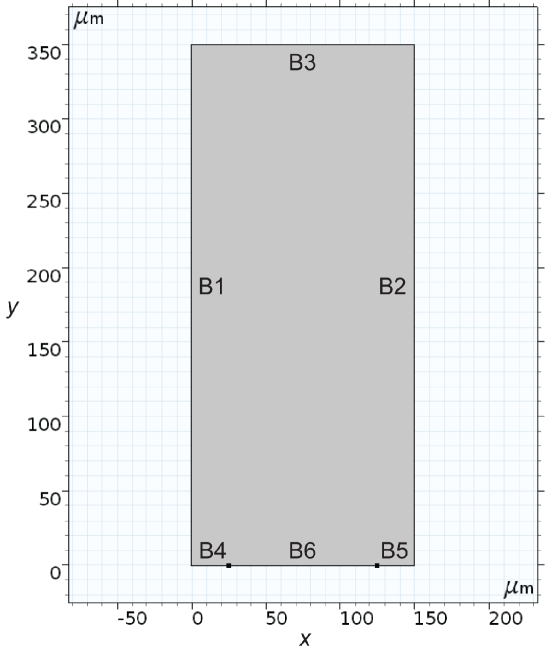
We used COMSOL Multiphysics® Software 5.3 (COMSOL, Inc., Stockholm, Sweden) to conduct numerical simulations of our experimental setup depicted in Fig. 1b. A simplified, two-dimensional representation of the setup was constructed. We simulated the flow over one cavity by exploiting the symmetry and periodic boundary conditions, akin to the simulations reported in previous studies Baier , Baier01 . A schematic of the geometry and boundary conditions is presented in the electronic supplementary material Fig. S3 and Table S1. The velocity reported was the average horizontal velocity within the 100 m by 20 m rectangle immediately above the air pocket.
The simulation was first verified by comparing it to the results from a previous study for a temperature gradient of 6 ∘C cm-1 Baier01 . Next, a mesh study was conducted across two orders of magnitude in mesh elements. The results are shown in the Supplement Table S2. They closely match the reported velocity of 1.7 mm s-1 from Baier et al for ∘C cm-1 Baier01 . The simulations shown in Fig. 2a and Fig. 3b were conducted using the highest number of mesh elements.
4.4 Macrophage cell capture using thermocapillary pumping
Microchannels were bonded with glass slides coated with 3-Aminopropyl Triethoxysilane (Electron Microscopy Sciences, Hatfield, PA) and functionalized against the target cell types using a three-step surface chemistry approach Alapan , Krebs . Microfluidic channels were first injected with sulfo-N-g-maleimidobutyryloxysuccinimide ester solution (0.28% (v/v) in water) for 15 minutes at room temperature. Afterwards, microfluidic channels were flushed with PBS and filled with Neutravidin solution (1 mg mL-1 in PBS). After an incubation period of 30 minutes, the channels were washed with PBS to remove any remaining non-bound Neutravidin. Next, biotinylated CD11b antibodies were injected into the channels and incubated for 30 minutes at room temperature. Channels were rinsed again before blood processing. A schematic of the functionalized glass is shown in the electronic supplementary material Fig. S5.
Purified mouse RBCs were purchased from Innovative Research (Novi, Michigan). RBCs were washed three times with PBS and reconstituted at a concentration of 108 cells mL-1. Mouse monocytes and macrophages (J774A.1, ATCC® TIB-67TM) were cultured in Dulbecco’s Modified Eagle’s Medium (DMEM) with 10% fetal bovine serum and 1% penicillin-streptomycin (5,000 U mL-1). Cultured monocytes and macrophages were scraped and mixed with blood with a final concentration of 106 cells mL-1. Afterwards, the diluted blood samples containing monocytes and macrophages were pumped through the channels. Next, PBS was pumped to remove any non-attached cells. Then, channels were injected with fluorescently labeled (Alexa Fluor 488) CD11b antibodies and incubated for 30 minutes at room temperature to determine the specificity of captured cells using a fluorescent microscope (Nikon Eclipse Ti, Düsseldorf, Germany).
4.5 Experiments with simulated solar irradiation
We investigated the potential use of solar irradiation for providing the temperature gradient to drive thermocapillary flow. Solar irradiation was absorbed with black ink (Pelikan 4001 Brilliant Black, Pelikan Vertriebsgesellschaft mbH & Co, Hannover, Germany). The black ink was applied to the underside of a glass slide (25 x 70 x 1 mm) with a PDMS microchannel bonded to the upper side. Half of the slide was coated with the ink and left to dry.
After the ink dried, the microchannel was filled with water seeded by polystyrene microparticles (Polysciences, Inc., Washington, PA, USA; diameter: m). The particles allowed approximate observation of fluid motion.
Solar irradiation was simulated using a high-power LED (SOLIS-3C, Thorlabs, Inc., Newton, NJ, USA). The irradiation from the LED was measured with a microscope slide thermal power sensor (S175C, Thorlabs, Inc., Newton, NJ, USA). For the experiments, the LED was mounted to an inverted microscope (Zeiss Axio Observer.A1, Jena, Germany). The microchannel and fluid flow were observed using a 10X objective and high-speed camera (Vision Research Phantom v641, Wayne, NJ, USA). Videos captured at different irradiations are shown in the electronic supplementary material, video S2. The fluid velocities were approximated by tracking three individual particles using an open source tracking software (Tracker by Douglas Brown, http://physlets.org/tracker/).
Acknowledgments
We thank W. Hu for his early contributions, V. Sridhar for help with the solar irradiation experiments, and N. Krishna-Subbaiah for his help with photolithography.
Author Contributions
GJA designed the study, carried out the experiments, developed the fluid model, participated in the numerical simulations, and drafted the manuscript; AFT designed the numerical simulations, participated in the design of the study, participated in the experiments, and drafted the manuscript; ZR participated in the experiments and drafted the manuscript; YA designed and participated in the biological experiments, and drafted the manuscript; OY designed and participated in the biological experiments, and drafted the manuscript; MS participated in the design of the study and drafted the manuscript. All authors gave final approval for publication.
Funding
This research is funded by the Max Planck Society.
Data Accessibility
The datasets supporting this article have been uploaded as part of the supplementary material.
References
- [1] Fan, L.-S., Tai, Y.-C. & Muller, R. S. Integrated movable micromechanical structures for sensors and actuators. IEEE Transactions on Electron Devices 35, 724–730 (1988).
- [2] Ho, C.-M. & Tai, Y.-C. Micro-electro-mechanical-systems (MEMS) and fluid flows. Annual Review of Fluid Mechanics 30, 579–612 (1998).
- [3] Stone, H. A., Stroock, A. D. & Ajdari, A. Engineering flows in small devices: microfluidics toward a lab-on-a-chip. Annual Review of Fluid Mechanics 36, 381–411 (2004).
- [4] Sitti, M. Mobile Microrobotics (MIT Press, Cambridge, MA, USA, 2017).
- [5] Sengupta, S. et al. Self-powered enzyme micropumps. Nature chemistry 6, 415–422 (2014).
- [6] Das, S. et al. Harnessing catalytic pumps for directional delivery of microparticles in microchambers. Nature Communications 8 (2017).
- [7] Darhuber, A. A. & Troian, S. M. Principles of microfluidic actuation by modulation of surface stresses. Annual Review of Fluid Mechanics 37, 425–455 (2005).
- [8] Karbalaei, A., Kumar, R. & Cho, H. J. Thermocapillarity in microfluidics–a review. Micromachines 7, 13 (2016).
- [9] Bourouiba, L., Hu, D. L. & Levy, R. Surface-tension phenomena in organismal biology: An introduction to the symposium. American Zoologist 54, 955–958 (2014).
- [10] Bush, J. W. & Hu, D. L. Walking on water: Biolocomotion at the interface. Annual Review of Fluid Mechanics 38, 339–369 (2006).
- [11] Money, N. P. More g’s than the space shuttle: Ballistospore discharge. Mycologia 547–558 (1998).
- [12] Federle, W., Riehle, M., Curtis, A. S. & Full, R. J. An integrative study of insect adhesion: mechanics and wet adhesion of pretarsal pads in ants. Integrative and Comparative Biology 42, 1100–1106 (2002).
- [13] Kim, W., Gilet, T. & Bush, J. W. Optimal concentrations in nectar feeding. Proceedings of the National Academy of Sciences 108, 16618–16621 (2011).
- [14] Notter, R. H. Lung Surfactants: Basic Science and Clinical Applications (CRC Press, 2000).
- [15] Thomson, J. XLII. On certain curious motions observable at the surfaces of wine and other alcoholic liquors. The London, Edinburgh and Dublin Philosophical Magazine and Journal of Science. 10, 330–333 (1855).
- [16] Marangoni, C. Ueber die ausbreitung der tropfen einer flüssigkeit auf der oberfläche einer anderen. Annalen der Physik 219, 337–354 (1871).
- [17] Prins, M., Welters, W. & Weekamp, J. Fluid control in multichannel structures by electrocapillary pressure. Science 291, 277–280 (2001).
- [18] Janocha, B., Bauser, H., Oehr, C., Brunner, H. & Göpel, W. Competitive electrowetting of polymer surfaces by water and decane. Langmuir 16, 3349–3354 (2000).
- [19] Chung, S. K., Ryu, K. & Cho, S. K. Electrowetting propulsion of water-floating objects. Applied Physics Letters 95, 014107 (2009).
- [20] Luo, J. et al. Moving-part-free microfluidic systems for lab-on-a-chip. Journal of Micromechanics and Microengineering 19, 054001 (2009).
- [21] Colgate, E. & Matsumoto, H. An investigation of electrowetting-based microactuation. Journal of Vacuum Science & Technology A: Vacuum, Surfaces, and Films 8, 3625–3633 (1990).
- [22] Bénard, H. Les tourbillons cellulaires dans une nappe liquide propageant de la chaleur par convection: en régime permanent (Gauthier-Villars, Paris, France, 1901).
- [23] Shereshefsky, J. Surface tension of saturated vapors and the equation of Eötvös. The Journal of Physical Chemistry 35, 1712–1720 (1931).
- [24] Kataoka, D. E. & Troian, S. M. Patterning liquid flow on the microscopic scale. Nature 402, 794 (1999).
- [25] Maggi, C., Saglimbeni, F., Dipalo, M., De Angelis, F. & Di Leonardo, R. Micromotors with asymmetric shape that efficiently convert light into work by thermocapillary effects. Nature Communications 6 (2015).
- [26] Sammarco, T. S. & Burns, M. A. Thermocapillary pumping of discrete drops in microfabricated analysis devices. AIChE Journal 45, 350–366 (1999).
- [27] Ohta, A. T., Jamshidi, A., Valley, J. K., Hsu, H.-Y. & Wu, M. C. Optically actuated thermocapillary movement of gas bubbles on an absorbing substrate. Applied Physics Letters 91, 074103 (2007).
- [28] Hu, W., Fan, Q. & Ohta, A. T. An opto-thermocapillary cell micromanipulator. Lab on a Chip 13, 2285–2291 (2013).
- [29] Baier, T., Steffes, C. & Hardt, S. Thermocapillary flow on superhydrophobic surfaces. Physical Review E 82, 037301 (2010).
- [30] Peters, F. & Arabali, D. Interfacial tension between oil and water measured with a modified contour method. Colloids and Surfaces A: Physicochemical and Engineering Aspects 426, 1–5 (2013).
- [31] Villers, D. & Platten, J. Temperature dependence of the interfacial tension between water and long-chain alcohols. The Journal of Physical Chemistry 92, 4023–4024 (1988).
- [32] Lee, W. Y., Wong, M. & Zohar, Y. Pressure loss in constriction microchannels. Journal of Microelectromechanical Systems 11, 236–244 (2002).
- [33] Munson, B. R., Young, D. F., Okiishi, T. H. & Huebsch, W. W. Fundamentals of Fluid Mechanics, 6th edition (Wiley, 2009).
- [34] Baier, T., Steffes, C. & Hardt, S. Numerical modelling of thermocapillary flow on superhydrophobic surfaces. In 14th International Conference on Miniaturized Systems for Chemistry and Life Sciences. Chemical and Biological Microsystems Society (2010).
- [35] Alapan, Y., Hasan, M. N., Shen, R. & Gurkan, U. A. Three-dimensional printing based hybrid manufacturing of microfluidic devices. Journal of Nanotechnology in Engineering and Medicine 6, 021007 (2015).
- [36] Krebs, J. C., Alapan, Y., Dennstedt, B. A., Wera, G. D. & Gurkan, U. A. Microfluidic processing of synovial fluid for cytological analysis. Biomedical Microdevices 19, 20 (2017).
![[Uncaptioned image]](/html/1802.00475/assets/x9.png)
![[Uncaptioned image]](/html/1802.00475/assets/x10.png)