Precise half-life measurement of the superallowed emitter 30S
Abstract
We have measured the half-life of 30S, the parent of a superallowed transition, to high precision using very pure sources and a 4 proportional gas counter to detect the decay positrons. Our result for the half-life is 1.17992(34) s. As a byproduct of this measurement, we determined the half-life of its daughter, 30P, to be 2.501(2) min.
I INTRODUCTION
Currently, the superallowed -decay branch from 30S is not one of the fourteen transitions that have been measured to 0.1% precision and collectively used to determine, , the up-down element of the Cabibbo-Kobayashi-Maskawa (CKM) quark-mixing matrix. The most recent survey of world data HT15 gives = 3005(41) s for the 30S superallowed transition, a precision of 1.4%, which is more than a factor of 10 too large for it to contribute to any fundamental tests of the weak interaction or of isospin symmetry breaking. There are good reasons to improve this situation though, and we report here a first step in doing so.
The superallowed transitions between analog states are interesting in general because they depend uniquely on the vector part of the weak interaction. Their experimental values are related to the vector coupling constant , which, according to conservation of the vector current (CVC), should be the same for all such transitions. In practice, several small (1%) correction terms intervene, so these can be combined with the value to obtain a “corrected” value HT15 :
| (1) |
where GeV-4s, is the isospin-symmetry-breaking correction and is the transition-independent part of the radiative correction. The terms and comprise the transition-dependent part of the radiative correction, the former being a function only of the positron’s energy and the of the daughter nucleus, while the latter, like , depends in its evaluation on the details of nuclear structure. This value, which combines the experimental together with small calculated corrections, is inversely proportional to and thus should be statistically constant from one transition to another. The precisely determined values from fourteen superallowed transitions satisfy this condition. Thus their average can be used to derive the value of HT15 . At the present time, this is the most precise result for and it enables the most demanding available test of the unitarity of the CKM matrix, a test which is passed within 0.06%.
Since any deviation from unitarity would be a signal of new physics, there is strong motivation to further improve the unitarity test by reducing the uncertainty attached to . The largest contributor to its uncertainty is the calculated radiative correction , but the nuclear-structure-dependent corrections ( - ) are the second largest HT15 and, unlike , they can be tested by experiment. By requiring that a set of structure-dependent corrections must produce a statistically consistent set of values or be rejected, we can restrict the number of acceptable sets, and thus reduce the uncertainties attached to ( - ) TH10 .
The 30S case is a particularly interesting one because its nuclear-structure-dependent correction as calculated with the currently favored “Shell-model, Woods-Saxon” (SM-WS) model HT15 ; TH08 is ( - ) = 1.040(32)%. That makes it one of the two largest correction terms among all the superallowed transitions with 54, the cases for which the shell model can be considered rather reliable. If the measured value for a transition with such a relatively large correction were to yield an value that is consistent with the other well-known cases, it would serve to verify the calculations’ reliability for all those cases that have smaller corrections.
The value that characterizes any transition depends on three measured quantities: the total transition energy , the half-life of the parent state, and the branching ratio for the particular transition of interest. For the 30S superallowed transition, only the value can be considered known with sufficient precision. Its contribution to the -value uncertainty is merely 0.03% HT15 . The large uncertainty currently assigned to the 30S value is mostly attributable to the branching ratio of the superallowed transition, which is based on a single 1963 measurement Fr63 . Though the half-life is known much more precisely, it is still not adequate since its world-average value HT15 is quoted to 0.14% and is based on only two measurements, one quoted to 0.41% Wi80 and the other to 0.14% So11 .
We have chosen to begin with a measurement of the half-life of 30S. Quite apart from its ultimate benefit in contributing to a usefully precise value, the measurement also offers an excellent opportunity for us to verify one of the techniques we have used in previous half-life measurements. Unlike most = -1 superallowed emitters, 30S does not feed a second transition from its daughter, 30P. Instead, the , = 1 state populated in 30P decays electromagnetically to the , = 0 ground state, which proceeds by ordinary allowed decay to 30Si with a half-life of 2.498(4) min Ba10 ; En90 . This leads to a very clean separation between the 30S half-life of 1.18 s and that of its daughter, which is more than a factor of 100 longer. In the = -1 cases we have measured before Ia06 ; Ia10 ; Pa11 , the parent and daughter half-lives only differ by a factor of 2 and, because we detect the positrons from both decays together in the same detector, we must use the parent-daughter linkage as input to the fit in order to extract the parent half-life with any precision. This requires us to know the time-dependence of the source deposit rate and also to incorporate the subtle difference between the parent and daughter detection efficiencies for positrons Ia10 ; together, these effects can introduce systematic uncertainties. In the case of 30S, the large difference between parent and daughter half-lives makes it possible to extract a result for 30S by treating the two decays as independent components and to compare that half-life result to the one obtained when the linkage between parent and daughter is enforced. This is our first opportunity to make such a comparison.
II Experiment
II.1 Overview
We produced a 30S radioactive beam via the inverse-kinematics reaction 1H(31P, 2)30S, initiated by a 30-MeV, 250-nA beam of 31P from the K500 superconducting cyclotron at Texas A&M University. The target was hydrogen gas at a pressure of 2 atm, contained in a cell that was kept at liquid-nitrogen temperature to increase the gas density. The fully-stripped reaction products exiting the target cell entered the Momentum Achromat Recoil Spectrometer (MARS) Tr89 where they were separated according to their charge-to-mass ratio , with 30S being selected in the focal plane. After passing through the extraction slits, the 30S beam exited the vacuum system through a 51-m-thick Kapton window, passed through a 0.3-mm-thick BC404 scintillator, where the ions were counted, and then through a stack of aluminum degraders, finally stopping in the 76-m-thick aluminized Mylar tape of a fast tape-transport system.
After the radioactive sample had been collected for a time interval approximately equal to the 30S half-life, the beam was turned off and the tape-transport system moved the sample rapidly to a well-shielded location 90 cm away, stopping it at the center of a 4 proportional gas counter. Beginning 220 ms after the beam was turned off, the decay positrons were recorded for 20 half-lives (24 s). The beam was then turned on again and the cycle repeated. These collect-move-detect cycles were controlled by the tape-transport system’s precision clock, and the timing of the generated control signals was continuously monitored on-line by our data-acquisition system. The cycles were repeated until the desired counting statistics had been achieved. For this experiment we accumulated data from nearly 6,000 cycles divided into 33 separate runs, which yielded a total of 1.4 beta counts.
II.2 Source purity
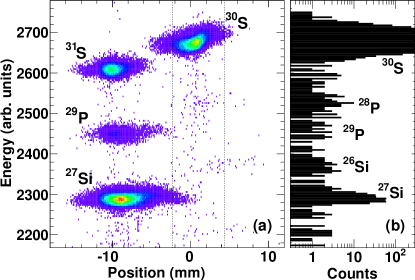
Before beginning the measurements, we inserted a 1-mm-thick 16-strip position-sensitive silicon detector (PSSD) into the focal plane of MARS while using a low-current primary beam. This detector was used first for the identification of secondary reaction products, and then to monitor the selection and focus of 30S in the center of the beam line. As shown in Fig. 1, in addition to 30S, there were four reaction products, 26Si ( = 2.255 s), 27Si ( = 4.135 s), 28P ( = 270.3 ms) and 29P ( = 4.140 s), that appeared between the extraction slits as weak contaminants in the extracted 30S beam. On the one hand, 26Si and 28P were not problematic since both passed completely through the tape without contaminating the collected sample. On the other hand, 27Si and 29P, having a similar range to 30S, were potentially a concern. With the focal-plane acceptance slits of MARS set to a width of 6.6 mm, the total extracted beam contained 0.37(8)% of 27Si ions and 0.050(15)% of 29P. The composition of the beam exiting MARS was checked on a daily basis during our half-life measurement: On each occasion we reinserted the PSSD at the MARS focal plane and acquired a spectrum equivalent to the one shown in Fig. 1. There were some changes observed from time to time in the extracted beam composition; these are reflected in the uncertainties we quote on the impurity percentages.
Although the amount of 27Si contaminant from MARS, at 0.37(8)%, is already quite small, it is large enough to cause concern for a half-life measurement aiming for sub-0.1% precision, so we adjusted the thickness of aluminum degraders to minimize the amount of 27Si that stopped in the tape. This was accomplished as follows:
Before the main measurements began, we measured the amount of 30S activity retained in the tape as a function of degrader thickness, spanning the full range from a minimum, at which all the 30S passed entirely through the tape, to a maximum, at which no 30S reached the tape at all. This yielded a detailed picture of the depth distribution of the implanted ions, valid not only for 30S but also for other ions of similar range. It also produced an experimental value for the degrader thickness required to center the deposit at the desired depth in the tape. As in our previous published measurements, the value obtained was very close to that predicted by the SRIM code SRIM , giving confidence that the SRIM calculations can be relied on to determine the spatial distributions of impurities relative to that of 30S.
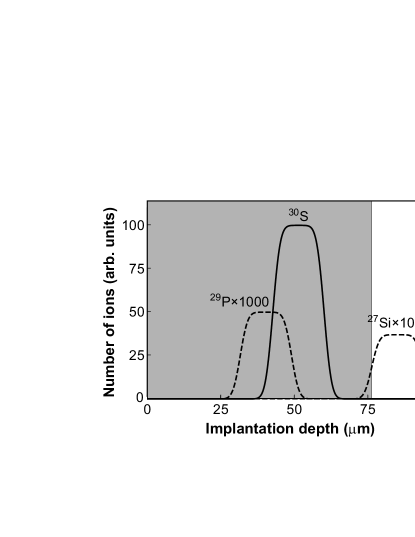
Figure 2 presents the results of calculations based both on the SRIM code and on our measured depth distribution. Note that they correspond to the thickness of degraders we actually used in our half-life measurement, which placed the 30S activity towards the back of the tape. The solid line in the figure represents a simplified functional form for the implantation-depth distribution of 30S; it is consistent with the results of our scan of 30S activity versus degrader thickness and with the known momentum spread as set by the momentum-selection slits in MARS ( = 0.86%). We have then reproduced the semi-empirical 30S shape as dashed lines to represent the distributions of 29P and 27Si at their calculated locations and with their measured relative intensities.
Based on the results illustrated in Fig. 2, we determined that only approximately 4% of the 27Si impurity observed in the MARS focal plane was actually retained in the tape with our particular choice of degrader thickness. This means that its effective contribution to the measurement is 0.015(15)% relative to that of 30S. The contribution of 29P, being obviously unaffected by the degrader choice, is the same in the tape as it was in the MARS focal plane. Coincidentally, 29P and 27Si have almost identical half-lives so their effects on the measurement are equivalent. Their relative intensities in the tape sum to 0.065(21)%, a manageably small amount.
II.3 4 gas counter
Our 4 gas counter consists of two separate gas cells that, when assembled, leave a very narrow slot between them, through which the aluminized Mylar transport tape passes. The identical cells each have an active gas volume of about 30 cm3. They were machined from copper and are equipped with anodes of 13-m-diameter gold-plated tungsten wire. Methane at just over one-atmosphere pressure is continuously flushed through both cells. Methane offers adequate gas gain for detecting positrons and is quite insensitive to radiation. A Havar foil window, 3.7 cm in diameter and 1.5 m thick, hermetically seals each gas cell on the side facing the tape. The performance of this type of detector is well known Ha78 ; Ko83 ; Ko97 and the particular detector employed in this measurement is the same one used by us in many previous half-life measurements (e.g. see Refs. Ia06 ; Pa11 ; Ia10 ; Pa12 ).
Before and after our experiments, we check the performance of the gas counter using a 90Sr/90Y source. This source has been specially prepared on a sample length of transport tape and is inserted into the gas counter in exactly the position that an on-line sample occupies. We record the count rate as a function of the applied counter bias voltage. Initially, as the voltage increases the rate rises too since the increasing gas gain leads to more primary ionizing events producing a large enough signal to be recorded. However, at approximately 2600 V a “plateau” is reached and the count rate remains nearly unchanged for the next 200-300 V increase in the bias voltage. At higher voltages still, there is a second rapid rise in count rate as spurious pulses and electronic noise are increasingly recorded. This behavior is well understood Ha78 and clearly demonstrates that, when operated in the plateau region, such detectors have essentially 100% efficiency with minimal rate dependence. During our 30S measurements, we operated the gas counter between 2650 and 2850 V, well within the plateau region as determined with our source measurements before and after the experiment.
II.4 Source positioning
Although the tape transport system is quite consistent in placing the collected source within 3 mm of the center of the detector, it is a mechanical device and occasionally larger deviations occur. So, during the collection period of each cycle we recorded the number of ions passing through the scintillator en route to implantation; then during the subsequent count period we recorded the number of positrons detected in the gas counter. The ratio of the latter to the former is a sensitive measure of whether the source was seriously misplaced in the counter. We rejected the results from any cycle with an anomalous (i.e. low) ratio.
II.5 Data acquisition
Data from this measurement were acquired with essentially the same analog electronics we have used in previous measurements; a detailed description of the setup appears in Ref. Ia06 . Briefly, the strongly amplified signals from the gas counter are fed to a low-threshold discriminator, the output of which is split and sent to two fixed-width nonretriggering and nonextending gate generators, which introduce well known fixed dead times that are selected to be longer than any up-stream dead-time contributions. The outputs from the two gate generators are sent to two multi-channel scalers, each with 15,000 channels. The time base for the acquired spectra is defined by a Stanford Research System pulser, which is accurate to 0.01 ppm.
We set the widths of the two gate generators (dead times) to be different from one another and frequently changed them – as well as the detector bias voltage and discriminator level – from run to run as a check on any systematic effects that might arise from these adjustable parameters. We monitored both gates continuously during every run by recording coincidences between each gate and 4-ns-wide pulses from a precise 1-MHz pulse generator; this gave us a continuous measure of the imposed dead times. In this experiment we used dead times of 3 and 6 s in dead-time channel A, and 6 and 4 s in channel B.
We also tested for any systematic count-rate dependence in our system. Within a given run the initial counting rate was reasonably consistent from cycle to cycle. However, we varied the 30S production rate so that some runs were recorded at relatively high rates, while others were at considerably lower rates. Since 30S was available in copious quantities, we covered initial rates from 7-20 counts/s.
For the first time, in this experiment we added another parallel data-acquisition branch to our analog system. The discriminator output signal was also sent to a multichannel time-to-digital converter (TDC), which was used to record the arrival times of the signals. Recorded in addition were the arrival times of the 30S ions detected by the scintillator located just in front of the collection tape; and the logic signals that originated from the tape-transport control system, indicating the start of the collect, move and detect periods. Altogether, this information provided a decay spectrum and an independent measure of the time between collection and detection for each cycle. In this sense, it served as a parallel backup to our conventional equipment.
Beyond that, though, during analysis we could insert digitally into the time-stamp data stream from the TDC-based system, via software, any kind or amount of dead time we chose. We could then analyze the resulting decay histogram, making our usual dead-time correction but based on the dead time we inserted digitally. The results in all cases were found to agree closely with those from our conventional analysis; so they will not be referred to again.
III Analysis and Results
III.1 Data processing
Before analysis, we preselected the data based on two criteria. First, a cycle was rejected if the total number of particles detected by the gas counter was less than 500, which indicates that there had been little or no primary beam from the cyclotron during the collection period. This happened infrequently, so only 1.4% of the cycles were eliminated by this criterion. The second criterion we used to exclude cycles was the ratio of detected positrons to implanted sulfur ions; a low ratio indicates that the implanted source was not centrally located in the gas counter for that cycle (see Sec. II.4). To be safe, for our final analysis of the data we set very tight limits on this ratio, requiring it to be between 95 and 100% of the maximum value obtained. This eliminated 15.2% of the total cycles. A separate analysis with limits offset at 91-98% yielded a half-life that agreed with the one we obtained using our tight central limits to within their 0.02% statistical uncertainties, thus confirming the validity of the latter result.
The remaining data were then corrected cycle-by-cycle for dead-time losses. We used the conventional method, increasing the number of events in each channel in the decay spectrum analytically for the known dominant dead-time; this method is described, for example, in Ref. Ko97 .
In this measurement, we also added a further refinement: We corrected the data for the slight dependence of detection efficiency on counting rate. This occurs because, even when the detector is operated in the “plateau” region (see Sec. II.3) there is a very slight increase in efficiency with bias voltage. As the counting rate decreases during a decay measurement, the current decreases across the series resistor that connects the anode wire to the bias supply, and the effective bias on the wire increases, thus increasing the efficiency very slightly. The details of our implementation of this correction will be described separately Ia18 . Its impact on our final half-life turned out to be less than 0.02%, a small but non-negligible amount.
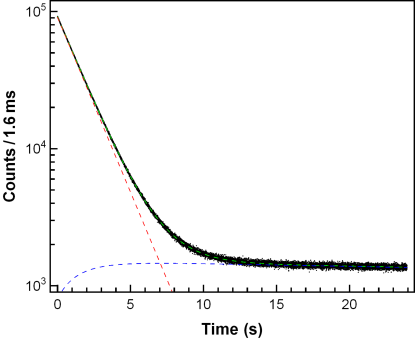
The final decay spectrum for each run was then obtained from the sum of the dead-time- and efficiency-corrected decay spectra for all accepted cycles in that run. To illustrate the overall quality of the data, we present in Fig. 3 the total time-decay spectrum obtained by combining all the runs. Note that the daughter activity is entirely due to the decay of the 30S parent, and at its maximum is a factor of 70 less than the initial 30S activity. The constant background is another two orders of magnitude below that.
III.2 Half-life determination
We fitted the data from each of the 33 runs separately, incorporating five components: 30S; its daughter 30P; impurities 29P and 27Si; and a constant background. The half-life of 30P was fixed at its known value of 2.498(4) min Ba10 and the half-lives of 29P and 27Si were fixed at 4.140(16) s and 4.135(19) s Se08 respectively. As explained in Sec. II.2, the initial activities of 29P and 27Si relative to that of 30S were set at 0.050(15)% and 0.015(15)% respectively. Finally, the background was fixed to the value obtained (1 count/s) from a measurement in which all conditions were identical to those of a normal run except that the tape motion was disabled.
Note that in our primary analysis we treat 30S and its daughter 30P as independent decay components. Since all the 30P in our decay spectrum originates from the decay of 30S, there is a well-defined connection between their intensities; and indeed, as explained in the Introduction, we have previously used such parent-daughter connections in fits when the parent and daughter half-lives are so similar that the two components are not clearly separated in the decay spectrum Ia10 ; Ia06 ; Pa11 . In the present case, however, the half-life of 30P is more than 100 times longer than that of 30S, so there is no need to connect the two activities; and we deemed that by ignoring the connection we would reduce our potential exposure to systematic uncertainties. It is the result of this procedure that we quote as our final result. However, we also performed a parallel analysis in which the parent-daughter linkage was enforced in the fits. By comparing the results from the two methods, we can test the efficacy of the latter, which has been the only method available to us in previous measurements of = -1 superallowed emitters.
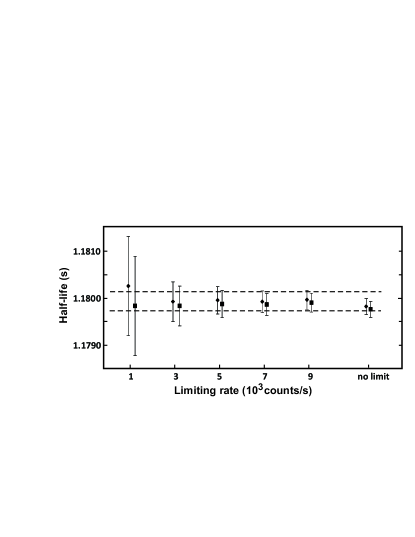
As explained in Sec. II.5, the initial counting rate associated with each run ranged from 7-20 counts/s. We therefore chose to analyze the runs in several different ways: First, we accepted all the data from each run, regardless of its rate, and obtained a half-life value by averaging the fitted results from all 33 runs. Next, we set a maximum limit of 9 counts/s and only analyzed that part of each run’s decay spectrum for which the count rate had dropped below 9 counts/s; if the run had a lower rate to start with, we used its full decay spectrum. Finally we set lower rate limits – at 7, 5, 3 and 1 counts/s – and repeated the analysis for each one. The half-life results for the different rate limits are given in Fig. 4; the values for dead-time channels A and B are plotted separately, although they agree very closely with one another.
It is evident from Fig. 4 that there is no significant change in the half-life result as the rate is substantially decreased. In the past, we have routinely made measurements at rates only up to 9 counts/s and have found no rate-dependent effects in our data-acquisition system. Although the results in the figure indicate that the inclusion of higher-rate data makes very little change, we have chosen to conservatively select the data set in which the rate is limited to 9 counts/s as our standard, and it is the uncertainty limits on its half-life value that appear as dashed lines in the figure.
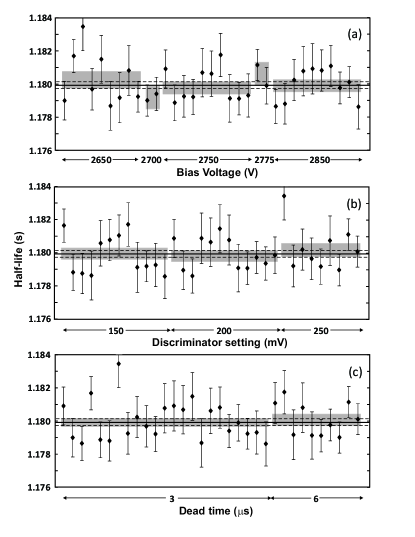
Since each run was executed with a different combination of detection settings – bias voltage, discriminator threshold setting and dominant dead-time – we could use the fitted half-lives of 30S from each individual run to test for any systematic dependence on those settings. Employing the data set that has been limited to a maximum rate of 9 counts/s, we present the results from dead-time channel A in Fig. 5. The three parts of the figure each include all 33 runs, but the runs have been grouped differently in each part, according to the parameter being investigated. No statistically significant dependence on any of the three detection settings is apparent in the figure, and this observation applies equally well to the results from dead-time channel B and from the data sets with other count-rate limits.
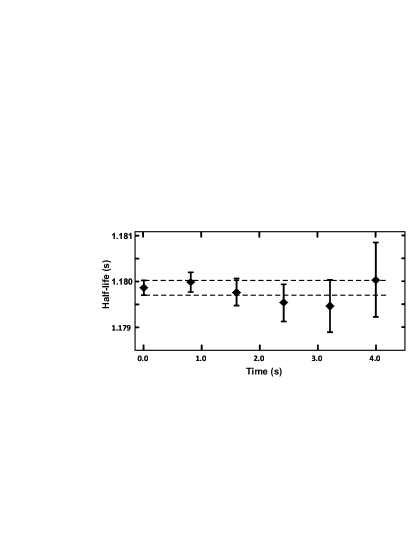
Our last systematic check was to test for any unanticipated short-lived impurities in the collected samples. For this purpose we needed to return to the complete rate-unlimited data set since, to be effective, this test requires that all decay spectra begin immediately after the source arrives at the counting location. With this set, we removed data from the first 0.8 s of the counting period and fitted the remaining data; then we removed an additional 0.8 s of data and fitted again. This procedure was continued until 4.0 s of data – 3.4 half-lives of 30S – had been removed. The result is given in Fig. 6 where, as before, we have used the data from dead-time channel A; the results from channel B show the same behavior. Evidently the half-lives obtained in this way are consistent with one another within statistical uncertainties, ruling out any short-lived impurities. This test is also sensitive to any rate-dependent effects on the half-life measurement. In agreement with the more sensitive test illustrated in Fig. 4, this test shows no sign of rate dependence.
As already explained in the context of Fig. 4, we take our final half-life result from the data set limited to 9 counts/s, which is illustrated run-by-run in Fig. 5. Our final average value for the 30S half-life, incorporating results from both dead-time channels is 1.17992(20) s with a reduced of 0.93. At this stage, the uncertainty is purely statistical.
With systematic instrumental effects eliminated as significant contributors to the half-life uncertainty, we must still take account of uncertainties arising from the known impurities in the collected samples and from the half-life of 30P, the radioactive daughter of 30S, which is a growing presence in each decay spectrum. The final error budget for the 30S half-life is shown in Table 1. In this measurement, it is the uncertainty associated with the two weak impurities that is the largest contributor to the overall uncertainty, although the counting statistics makes the second-largest contribution. Our final result for the 30S half-life is 1.17992(34) s, in which statistical and systematic uncertainties have been combined.
| Source | Uncertainty (ms) |
|---|---|
| statistics | 0.20 |
| sample impurities (29P,27Si) | 0.27 |
| 30P half-life | 0.016 |
| Total | 0.34 |
| 30S half-life result (s) | 1.17992(34) |
III.3 Comparison with previous results
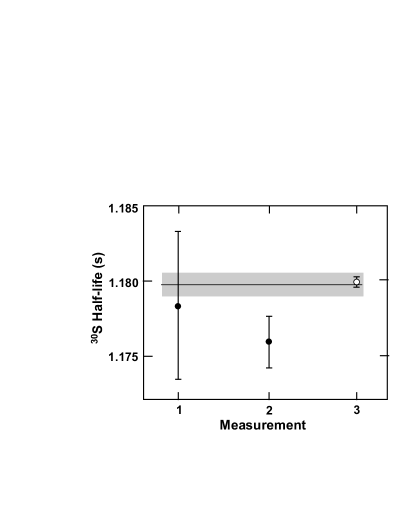
Although several measurements of the 30S half-life have been reported previously, only two have small enough uncertainties to be relevant here. These are listed in the most recent review of world data HT15 : 1.1783(48) s Wi80 and 1.1759(17) s So11 . The first of these results was published more than 35 years ago: The authors used a pneumatic shuttle to transport collected samples to a Ge(Li) detector, where 16 successive -delayed -ray spectra were recorded; the half-life was extracted from the decay of the 677-keV peak, the strongest one in the spectrum; this procedure uniquely isolated the decay of 30S. The second, more recent measurement, employed a pulsed beam and a “close to 4” plastic scintillator to detect particles; both 30S and its daughter were produced directly so the decay spectra, which included both activities, contained a relatively large contribution from the latter. The results from these two previous measurements appear in Fig. 7, together with our new result.
With 0.029% precision, our result is five times more precise than the most competitive previous measurement. It agrees with one of the earlier results Wi80 , but differs from the other So11 by more than two of the latter’s standard deviations. There is no obvious non-statistical explanation for this difference although we note that the ratio of 30P-to-30S activity in their spectra was ten times worse (i.e. greater) than in our spectra. The inclusion of the result from Ref. So11 in an overall average leads to a normalized of 2.7 and an average half-life for 30S of 1.17976(77) s, a result that includes an uncertainty scale factor (see Ref. HT15 ) of 2.3.
III.4 Half-life of 30P
In the midst of our measurement of the half-life of 30S, we changed the time sequencing of our collect-move-count cycles in order to focus on the decay of its daughter, 30P. Although the latter’s half-life plays a minor role in the analysis of the 30S decay, we wanted to be sure that the accepted half-life for 30P was not seriously incorrect. With 30-s collect and 60-s detect periods we accumulated 2 million counts in 8 complete cycles.
These data were analyzed in the manner described in Sec. III.2 except that in this case the half-life of 30S was fixed at our measured value and the half-life of 30P was determined from the fit. The result we obtained for the half-life of 30P was 2.501(2) min, which is more precise than, but completely consistent with, the literature value of 2.498(4) min Ba10 .
III.5 Test of analysis with parent-daughter link
All the results quoted so far have been arrived at by our considering the 30S and 30P activities as being independent of one another. We have already explained that this is the optimum approach for parent and daughter activities with very different half-lives, but the same approach cannot be taken when the activities have similar half-lives, as has been the case for the = -1 superallowed emitters we have studied previously. As a test of the method we have been forced to use in those cases, we have also analyzed the mass-30 data by fitting the decay spectra with the parent and daughter decays linked. In doing so, we used our measured record of source deposition as a function of time, and the calculated difference in detection efficiencies for the parent and daughter activities, just as we did in our previous measurements Ia06 ; Ia10 ; Pa11 .
The result we obtain for the 30S half-life that way is 1.17986(20) s, where the uncertainty is statistical only. It agrees very closely with the result we quoted in Sec. III.2 where we omitted the linkage between the parent and daughter activities, and the 0.017% uncertainties are the same. This convincingly validates the method we have used in the past to determine precise half-lives for = -1 superallowed emitters.
IV Conclusions
We have measured the half-life of 30S to be 1.17992(34) s. This is a factor of five more precise than the currently accepted value HT15 and, at 0.029%, is more than sufficient to allow the 30S superallowed value to contribute to the evaluation of once the branching ratio has been measured with sufficient precision. Unfortunately though, one of the previous half-life measurements So11 disagrees by two of its standard deviations from our more precise result, thus degrading the precision attributable to the world-average value. Using the methods employed in the periodic surveys of world data for superallowed decays (e.g. see Ref. HT15 ), we obtain an average half-life value of 1.17976(77) s. Although this scaled-up uncertainty (0.065%) is still an improvement over the previously accepted average, it cries out for yet another measurement with sufficient precision (and accuracy) to resolve the disagreement now revealed between the two most-recent measurements.
Because the 30S and 30P half-lives differed by more than a factor of 100, we could analyze our data either by treating the parent and daughter activities as being independent of one another, or by enforcing the linkage between them. Thus, we could test the efficacy of the latter method, which is the one we have been forced to use exclusively in previous half-life measurements of = -1 superallowed emitters, since in those cases the parent and daughter half-lives differed by merely a factor of two. The results from both methods were consistent well within their 0.017% precision.
Finally, as a by-product of this measurement, we have measured the half-life of 30P to be 2.501(2) min. This agrees with, but is a factor of two more precise than the literature value.
Acknowledgements.
This material is based upon work supported by the U.S. Department of Energy, Office of Science, Office of Nuclear Physics, under Award Number DE-FG03-93ER40773, and by the Welch Foundation under Grant No. A-1397.References
- (1) J.C. Hardy and I.S. Towner, Phys. Rev. C 91, 025501 (2015).
- (2) I.S. Towner and J.C. Hardy, Phys. Rev. C 82, 065501 (2010).
- (3) I.S. Towner and J.C. Hardy, Phys. Rev. C 77, 025501 (2008).
- (4) G. Frick, A. Gallmann, D.E. Alburger, D.H. Wilkinson and J.P. Coffin, Phys. Rev. 132, 2169 (1963).
- (5) H.S. Wilson, R.W. Kavanagh and F.M. Mann, Phys. Rev. C 22, 1696 (1980).
- (6) J. Souin, T. Eronen, P. Ascher, L. Audirac, J. Aysto, B. Blank, V.-V. Elomaa, J. Giovinazzo, J. Hakala, A. Jokinen, V.S. Kolhinen, P. Karvonen, I.D. Moore, S. Rahaman, J. Rissanen, A. Saastamoinen and J.C. Thomas, Eur. Phys. J. A 47, 40 (2011).
- (7) M.S. Basunia, Nucl. Data Sheets, 111, 2331 (2010).
- (8) P.M. Endt, Nucl. Phys. A521, 1 (1990).
- (9) V.E. Iacob, J.C. Hardy, J.F. Brinkley, C.A. Gagliardi, V.E. Mayes, N. Nica, M. Sanchez-Vega, G. Tabacaru, L. Trache and R.E. Tribble, Phys. Rev. C 74, 055502 (2006).
- (10) V.E. Iacob, J.C. Hardy, A. Banu, L. Chen, V.V. Golovko, J. Goodwin, V. Horvat, N. Nica, H.I. Park, L. Trache and R.E. Tribble, Phys. Rev. C 82, 035502 (2010).
- (11) H.I. Park, J.C. Hardy, V.E. Iacob, A. Banu, L. Chen, V.V. Golovko, J. Goodwin, V. Horvat, N. Nica, E. Simmons, L. Trache and R.E. Tribble, Phys. Rev. C 84, 065502 (2011).
- (12) R.E. Tribble, R.H. Burch and C.A. Gagliardi, Nucl. Instrum. Methods Phys. Res. A 285, 441 (1989).
- (13) J.F. Ziegler [http://www.srim.org]
- (14) A Handbook of Radioactivity Measurements Procedures, National Council on Radiation Protection and Measurements report NCRP No. 58 (1978); see especially section 3.5.
- (15) V. T. Koslowsky, E. Hagberg, J.C. Hardy, R.E. Azuma, E.T.H. Clifford, H.C. Evans, H. Schmeing, U.J. Schrewe and K.S. Sharma, Nucl. Phys. A405, 29 (1983).
- (16) V.T. Koslowsky, E. Hagberg, J.C. Hardy, G. Savard, H. Schmeing, K.S. Sharma and X.J. Sun, Nucl. Instrum. and Methods Phys. Res. A 401, 289 (1997).
- (17) H.I. Park, J.C. Hardy, V.E. Iacob, L. Chen, J. Goodwin, N. Nica, E. Simmons, L. Trache and R.E. Tribble, Phys. Rev. C 85, 035501 (2012).
- (18) V.E. Iacob et al., to be published.
- (19) N. Severijns, M. Tandecki, T. Phalet and I.S. Towner, Phys. Rev. C 78, 055501 (2008).