Can disorder act as a chemical pressure? An optical study of the Hubbard model
Abstract
The optical properties have been studied using the dynamical mean-field theory (DMFT) on a disordered Hubbard model. Despite the fact that disorder turns a metal to an insulator in high dimensional correlated materials, we notice that it can enhance certain metallic behavior as if a chemical pressure is applied to the system resulting in an increase of the effective lattice bandwidth (BW). We study optical properties in such a scenario and compare results with experiments where the BW is changed through chemical doping and obtain remarkable similarities vindicating our claim. We also make a point that these similarities differ from some other forms of BW tuned optical effects.
pacs:
71.27.+a, 71.10.Fd, 71.10.-w 71.10.Hf, 71.10.Fd 71.30.+h, 72.80.Ng 78.30.Ly 78.20.-eOptical studies have driven a huge attention towards understanding interaction effects on strongly correlated electronic materials (SCEMs), specifically after the discovery of high temperature superconductors [1, 2]. For the frequency () dependent complex optical conductivity , real () and imaginary () parts of it provide much information to probe properties beyond the Drudé paradigm of optical conductivity for SCEMs. Recently many dynamical quantities related to optical conductivity, particularly the effective carrier density, scattering rate and dynamical effective mass have been found to be useful in understanding correlated metallic phase in cuprates [1], pnictides [3, 4], V2O3 [5], VO2 [6], organic conductors [7], ruthenates [8, 9, 10], and other correlated materials [11].
It is known that pressure or doping the transition metals with ions of equal valency but a different size (chemical pressure) leads to a change in the effective bandwidth (BW) of a transitional metal oxide (TMO). In the half-filling carrier concentration such a change may give rise to a Mott metal-to-insulator transition (MIT). Such a transition is often dubbed bandwidth-controlled MIT (BC-MIT) [12]. Though extensive optical studies have been performed on myriads of TMOs and other SCEMs [11], studies of disorder-effect on them occupy limited volumes in the literature, both in experiments and theories. Recently Radonjić et al [13] studied a disordered Hubbard model following the X-ray irradiation induced disorder in -BEDT organic conductor [14], which is a typical two-dimensional Mott insulator. However, the authors limited their investigation to the extended metalicity due to BW increase in presence of disorder, from their transport and optical results, while how the BW change affects several dynamic properties compared to the similar effect in clean systems remains unanswered. This sets up a motivation to investigate the mentioned optical properties and relate them to BW-controlled physics.
The site-disordered Hubbard model is written as
| (1) |
where / is the electron creation/annihilation operator with spin at site , indicates the amplitude of hopping from site to (typically ), is the onsite Coulomb interaction, and are chemical potential and orbital energy of the electrons in clean system, and is the disorder potential at site . The model has been addressed by several authors, particularly within the framework of dynamical mean-field theory (DMFT) [15, 16, 13, 17, 18, 19] where the spectral density shows a disorder driven MIT in a certain parameter regime. However, the optical properties comparatively received lesser attention and we investigate the dynamic properties studied in the clean system [7] in our disordered model.
Method : We solve Eq. (1) using the DMFT in which a correlated lattice model is mapped onto a single impurity Anderson model where the impurity is self-consistently connected to a non-interacting fermionic bath [20]. Despite the lattice problem gets simplified in this way, the impurity model still requires many-body numerics to be solved and among many such existing methods [20] we employ the standard iterated perturbation theory (IPT) which is a second order perturbation around the Hartree-Fock (HF) self-energy : [21]
| (2) |
with
| (3) | ||||
| (4) |
where is average occupancy, is inverse temperature, are relevant Matsubara frequencies, and is the Weiss Green’s function of the non-interacting bath [20]. In practice, either of or is guessed in the first iteration of the self-consistency loop. The self-consistency condition in DMFT equates both the impurity and lattice self-energies and hence the same self-energy in Eq. (2) is used to calculate the lattice Green’s function where is the non-interacting lattice density of states and we choose the Bethe lattice in our work where implying non-interacting BW in our theory, . We also work in the half-filling case (, ) and select a binary alloy distribution of the disorder potential where is the weight for disordered sites and for the half-filling case . The effect of disorder is treated through the coherent potential approximation (CPA) [22, 15, 13, 23], which gives rise to the following self-energy and Green’s function.
| (5) | ||||
| (6) |
with defined through the Dyson Eq. , . becomes the updated Weiss function () and hence feeds back to Eq. (4) in the DMFT self-consistency loop.
To determine the optical conductivity we use the standard expression based on the Kubo formalism : [24, 21]
| (7) |
where ( and being electronic charge and the reduced Planck’s constant), and is called the transport function defined as
| (8) |
where is the momentum () dependent lattice dispersion. We choose which is exact for the hypercubic lattice at infinite dimension and a reasonable approximation for the Bethe lattice that we consider in our calculations [25]. For simplicity, we express in the unit of , i.e. we set .
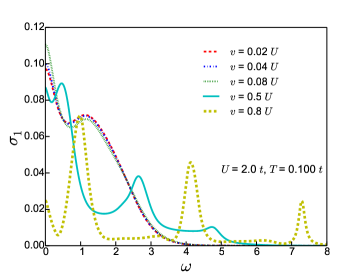
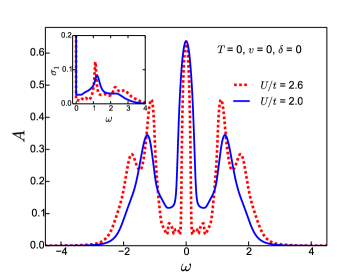
Results : We first look at the real part of the complex optical conductivity : . Since disorder induces localization of electrons, and CPA effectively captures such an effect for disordered binary alloys [15], our zero temperature results show that the Drudé peak () diminishes as disorder strength increases and finally disappears by opening an optical gap at ( at , see Fig. 1.), signaling an MIT (see inset in Fig. 1 for the spectral densities reflecting the same). The Drudé peak becomes finite at finite temperature () and slowly merges with the first absorption peak as temperature is raised. The optical gap formed at large disorder strength () gets closed at high temperature (, see Fig. 1).
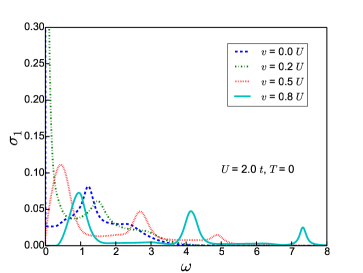
Though this signifies transition from a good metal to bad metal, our interest sticks to the case where disorder leads to the change in the BW before it ends up with an Anderson-like insulating phase at . This bears a close resemblance to the BC-MIT, where higher disorder strength effectively increases the lattice BW and following that it increases the quasiparticle weight in the coherent regime [15, 13, 23].
Recently several optical measurements have been performed on the Br-doped organic conductor -BEDT [7] where particularly three kinds of optical property have been investigated, namely (i) effective carrier density (), (ii) dynamic scattering rate (), and (iii) effective optical mass (). Following the -sumrule for the Drudé optical conductivity of free electron metals, one can define the effective spectral weight or charge density , by performing cumulative sum (instead of full sum upto ) on [11] :
| (9) |
where is called the optical mass of electrons (equivalent to effective mass derived from the bandstructure but in presence of correlation now) for the generic Drudé theory [11].
The other two quantities are defined from the complex optical conductivity for the generalized Drudé model : ( is the plasma frequency), following which we find
| (10) | |||
| (11) |
Effective carrier density - The main panel in Fig. 2 shows how changes with at various disorder strengths. As a generic trend, increases with as more charge carriers can be excited at higher optical energy.
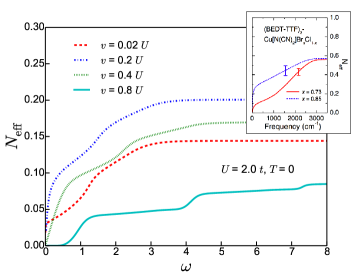

Increasing leads to increasing BW and hence the Drudé peak gets broadened (see Fig. 1) resulting in more weight in the -sumrule at low frequency. Since for small , significant change solely happens around the Drudé peak () and hence below a critical value , is higher at higher . From Fig. 1 one can also speculate that slope change in the optical sum-rule should occur at the frequency where there is a significant feature (such as an absorption peak or shoulder) in . Thus the peaks and shoulder at and manifest change of slopes at the same values for , while . At high frequency, since there remains no charge carrier density to be excited: , ’s value does not alter much and finally saturates. Similar trends have been noticed in experiments described in Ref. 7 (see inset of Fig. 2; implies doping concentration in the legend).
The feature is more or less the same at finite temperature. However, at quite high temperature () the Drudé peak significantly melts down and merges with absorption peaks resulting in featureless monotonically increasing as a function of until it reaches the saturation at large (see Fig. 2). In the insulating regime (), for where is the optical gap. At higher , starts increasing and forms plateaus at positions where the absorption peaks appear in .
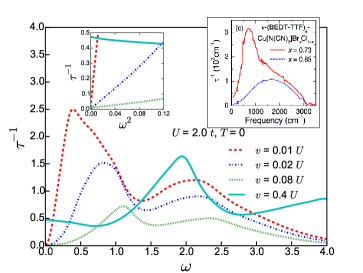
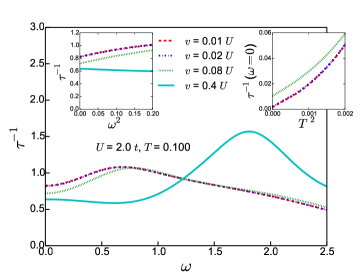
Dynamic scattering rate - Next we look at the dynamic scattering rate as defined in Eq. (10). For a Fermi liquid, it measures the quasiparticle lifetime and it bears the following frequency-temperature () dependence.
| (12) |
where and are constants [26, 27]. At low or zero temperature, for , depends on and in accord with Eq. (12) and hence signifies a Fermi-liquid metallic phase. The insets in Fig. 3 show the plots against and supporting the fact. For , dependence and , dependence get violated, insinuating breakdown of FL regime. At zero temperature a mid-infrared peak cum shoulder feature arises in the scattering rate while the shoulder is not much evident in the experiment reported in Ref. 7. However, the DMFT results in the same reference (BW tuned by ratio) contain the shoulder feature reinforcing the fact BW tuning by both and are of the same ilk. The peak position appears around 750 and 1500 respectively for Br-doping and respectively, which are and considering the experimental noninteracting BW, eV [7]. Similarly, though disorder is a different drive compared to the experiment, the peaks for and at occurs around and respectively, which are remarkably within the same energy range. Blueshifting of the peak due to increase in BW also agrees with the experiment. At sufficiently high temperature () the shoulder feature disappears followed by a long universal tail extending to high frequency. After , the quasiparticle description entirely breaks down and starts decreasing as frequency increases (see Fig. 3).
Effective optical mass - Optical mass is another interesting property that tells about the renormalization of the electronic mass as a combined effect of electronic bandstructure and correlation. Like in Ref. 7 the dynamical mass ratio at low also decreases due to increase of the BW by rise in disorder strength. While the real part contribution of the conductivity in Eq. (10) gives rise to a peak feature, the contribution from its imaginary part (Eq. (11)) forms a dip in the mid-infrared frequency range. In the experiment described in Ref. 7 the dip occurs around 1000 () 1900 () for dopings () 0.73 and 0.85 respectively. Similarly for and , the dips appear at and respectively, which are again in the same energy range. As the BW increases further due to increase in , the dip experiences a blueshift and becomes shallower. At the dip continues blueshifting, however, the ratio increases with frequency at low regime instead of decreasing, again signaling a breakdown of Fermi liquid coherence.
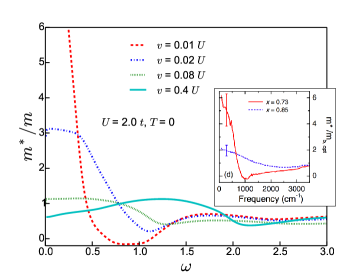
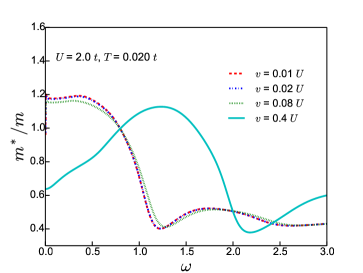
At , value drops down near and almost collapses for all frequency range for various ’s less than (see Fig. 4).
Other BW controlling factors - There exist several factors which can control the effective BW of a correlated lattice and for fixed , we mention four such important ones, viz. (i) Coulomb interaction , (ii) carrier doping , (iii) temperature and (iv) disorder potential .
At fixed , decreasing lowers
the ratio and effectively increases BW.
The width of the quasiparticle peak in the spectral density
represents a measurement of the effective BW. Fig. 5
shows the width enhances as is reduced from to , however,
keeping the height at the Fermi level ()
unchanged due to the Luttinger pinning [28] property
of a Fermi liquid. The pinning remains intact as well in the
Drudé weight of optical conductivity ()
though the mid-infrared peak position acquires a blueshift and broadening as
is reduced.
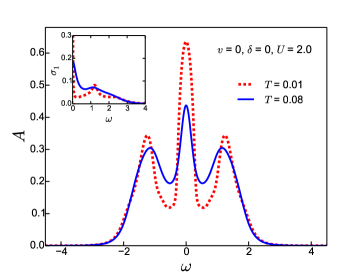
Similarly increasing also broadens the quasiparticle peak though
the Luttinger pinning does not hold any more.
As a consequence of this, the Drudé peak in also diminishes.
However, redshifts as the BW increases due to temperature
rise.
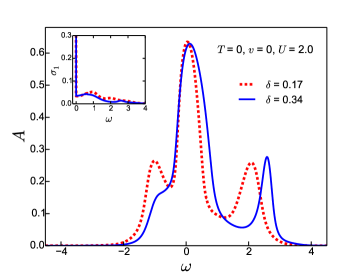
Deviation from the particle-hole symmetry again leads to change in BW. For small ,
the Luttinger pinning is obeyed and effective BW increases as increases. Like in the
-driven case, BW increasing leads to redshift in .
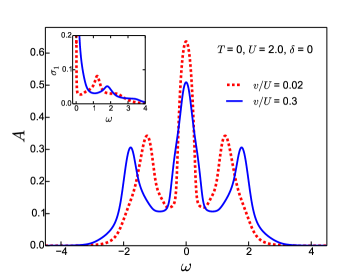
Now if we look back to the calculations with changing disorder, we can see the absorption peak
goes to a blueshift like the -driven BW increase. This ensures that disorder indeed
acts like chemical pressure from the change in BW perspective.
The comparisons can be viewed in Fig. 5,
which are summarized in the table below.
| Factor | Effect on BW | Effect on |
|---|---|---|
| Pressure () | Increase | Blueshift |
| Disorder () | Increase | Blueshift |
| Temperature () | Increase | Redshift |
| Doping () | Increase | Redshift |
Summary : In this work, we for the first time establish the fact that the interaction/pressure and disorder driven bandwidth (BW) changes play very similar roles on optical properties, while other alternatives such as carrier filling and temperature change lead to different behaviors even though both shape the BW. Our results are at par with the the experiment on Br-doped BEDT conductor [7]. Though the experiment has been practically done in clean samples, our results invites similar experiments on disordered correlated systems [14]. Our investigation also could be generalized for a generic disorder distribution and to invoke the effect of Anderson localization the same DMFT formalism could be combined with the typical medium theory (TMT) [29]. On the DMFT side, thought IPT provides a reliable insight, recently developed exact impurity solvers such as continuous time Monte Carlo (CTQMC) method could be implemented to find more accurate results and compare to our predictions [30].
Acknowledgments
HB owes to the DAE, Govt. of India for providing financial support and scientific resources. For the energy unit conversions we used the table provided by NIST, USA.
References
- van der Marel et al. [2003] D. van der Marel et al., Nature 425, 271 (2003).
- Basov and Timusk [2005] D. N. Basov and T. Timusk, Rev. Mod. Phys. 77, 721 (2005).
- Moon et al. [2014] S. J. Moon et al., Phys. Rev. B 90, 014503 (2014).
- Barišić et al. [2010] N. Barišić, D. Wu, M. Dressel, L. J. Li, G. H. Cao, and Z. A. Xu, Phys. Rev. B 82, 054518 (2010).
- Deng et al. [2014] X. Deng, A. Sternbach, K. Haule, D. N. Basov, and G. Kotliar, Phys. Rev. Lett. 113, 246404 (2014).
- Qazilbash et al. [2007] M. M. Qazilbash, M. Brehm, B.-G. Chae, P.-C. Ho, G. O. Andreev, B.-J. Kim, S. J. Yun, A. V. Balatsky, M. B. Maple, F. Keilmann, H.-T. Kim, and D. N. Basov, Science 318, 1750 (2007).
- Merino et al. [2008] J. Merino, M. Dumm, N. Drichko, M. Dressel, and R. H. McKenzie, Phys. Rev. Lett. 100, 086404 (2008).
- Kamal et al. [2006] S. Kamal, D. M. Kim, C. B. Eom, and J. S. Dodge, Phys. Rev. B 74, 165115 (2006).
- Dang et al. [2015] H. T. Dang, J. Mravlje, A. Georges, and A. J. Millis, Phys. Rev. Lett. 115, 107003 (2015).
- Geiger et al. [2016] D. Geiger, U. S. Pracht, M. Dressel, J. Mravlje, M. Schneider, P. Gegenwart, and M. Scheffler, Phys. Rev. B 93, 165131 (2016).
- Basov et al. [2011] D. N. Basov, R. D. Averitt, D. van der Marel, M. Dressel, and K. Haule, Rev. Mod. Phys. 83, 471 (2011).
- Imada et al. [1998] M. Imada, A. Fujimori, and Y. Tokura, Rev. Mod. Phys. 70, 1039 (1998).
- Radonjić et al. [2010] M. c. v. M. Radonjić, D. Tanasković, V. Dobrosavljević, and K. Haule, Phys. Rev. B 81, 075118 (2010).
- Sasaki [2012] T. Sasaki, Crystals 2, 374 (2012).
- Laad et al. [2001] M. S. Laad, L. Craco, and E. Müller-Hartmann, Phys. Rev. B 64, 195114 (2001).
- Byczuk et al. [2005] K. Byczuk, W. Hofstetter, and D. Vollhardt, Phys. Rev. Lett. 94, 056404 (2005).
- Kuleeva and Kuchinskii [2013] N. A. Kuleeva and E. Z. Kuchinskii, Journal of Experimental and Theoretical Physics 116, 1027 (2013).
- Poteryaev et al. [2015] A. I. Poteryaev, S. L. Skornyakov, A. S. Belozerov, and V. I. Anisimov, Phys. Rev. B 91, 195141 (2015).
- Ekuma et al. [2015] C. E. Ekuma, S.-X. Yang, H. Terletska, K.-M. Tam, N. S. Vidhyadhiraja, J. Moreno, and M. Jarrell, Phys. Rev. B 92, 201114 (2015).
- Georges et al. [1996] A. Georges, G. Kotliar, W. Krauth, and M. J. Rozenberg, Rev. Mod. Phys. 68, 13 (1996).
- Barman and Vidhyadhiraja [2011] H. Barman and N. S. Vidhyadhiraja, Int. J. Mod. Phys. B 25, 2461 (2011).
- Velický et al. [1968] B. Velický, S. Kirkpatrick, and H. Ehrenreich, Phys. Rev. 175, 747 (1968).
- Barman et al. [2016] H. Barman, , M. S. Laad, and S. R. Hassan, “Realization of a Two Relaxation Rates in the Hubbard-Falicov-Kimball Model,” (2016), arXiv:cond-mat/1611.07594 [cond-mat.str-el] .
- Pruschke et al. [1995] T. Pruschke, M. Jarrell, and J. Freericks, Ann. Phys., Lpz. 44, 187 (1995), http://dx.doi.org/10.1080/00018739500101526 .
- Lange and Kotliar [1999] E. Lange and G. Kotliar, Phys. Rev. B 59, 1800 (1999).
- Berthod et al. [2013] C. Berthod, J. Mravlje, X. Deng, R. Žitko, D. van der Marel, and A. Georges, Phys. Rev. B 87, 115109 (2013).
- Stricker et al. [2014] D. Stricker, J. Mravlje, C. Berthod, R. Fittipaldi, A. Vecchione, A. Georges, and D. van der Marel, Phys. Rev. Lett. 113, 087404 (2014).
- Vollhardt et al. [2005] D. Vollhardt, K. Held, G. Keller, R. Bulla, T. Pruschke, I. A. Nekrasov, and V. I. Anisimov, J. Phys. Soc. Japan 74, 136 (2005).
- Dobrosavljević et al. [2003] V. Dobrosavljević, A. A. Pastor, and B. K. Nikolić, EPL (Europhysics Letters) 62, 76 (2003).
- Gull et al. [2011] E. Gull, A. J. Millis, A. I. Lichtenstein, A. N. Rubtsov, M. Troyer, and P. Werner, Rev. Mod. Phys. 83, 349 (2011).