Methods for multiple telescope beam imaging and guiding in the near infrared
Abstract
Atmospheric turbulence and precise measurement of the astrometric baseline vector between any two telescopes are two major challenges in implementing phase referenced interferometric astrometry and imaging. They limit the performance of a fibre-fed interferometer by degrading the instrument sensitivity and astrometric measurements precision and by introducing image reconstruction errors due to inaccurate phases. A multiple beam acquisition and guiding camera was built to meet these challenges for a recently commissioned four beam combiner instrument, GRAVITY, at the ESO Very Large Telescope Interferometer. For each telescope beam it measures: a) field tip-tilts by imaging stars in the sky; b) telescope pupil shifts by imaging pupil reference laser beacons installed on each telescope using a lenslet; c) higher order aberrations using a Shack-Hartmann. The telescope pupils are imaged for a visual monitoring while observing. These measurements enable active field and pupil guiding by actuating a train of tip-tilt mirrors placed in the pupil and field planes, respectively. The Shack-Hartmann measured quasi-static aberrations are used to focus the Auxiliary Telescopes and allow the possibility of correcting the non-common path errors between the Unit Telescopes adaptive optics systems and GRAVITY. The guiding stabilizes light injection into single-mode fibres, increasing sensitivity and reducing the astrometric and image reconstruction errors. The beam guiding enables to achieve astrometric error less than as. Here, we report on the data reduction methods and laboratory tests of the multiple beam acquisition and guiding camera and its performance on-sky.
keywords:
instrumentation: interferometers, instrumentation: adaptive optics, instrumentation: high angular resolution, atmospheric effects1 Introduction
GRAVITY (GRAVITY collaboration et al., 2017A) is a dual feed phase referencing interferometric imaging and a narrow-angle astrometric instrument. It has been built for the ESO Very Large Telescope Interferometer (VLTI) and was born with the aim to monitor stellar sources in the vicinity of the Galactic Centre supermassive black hole (Genzel et al., 2010; Eisenhauer et al., 2011). It combines four beams coherently in the K-band of either Unit Telescopes (UTs, 8 m) or Auxiliary Telescopes (ATs, 1.8 m). It is designed to deliver a differential astrometry of around 10 microarcseconds (as) and an angular resolution of around 4 milliarcseconds (mas). It works by observing a reference star at position and a science star at position : fringes for each star are obtained in separate beam combiners (cf. Figure 1). The differential separation of stars in the sky is proportional to the differential optical path difference () observed in the beam combiner instrument. For first-order approximation, the differential optical path difference is related to the differential separation of stars and the baseline vector () by
The coherent beam combination of star light is implemented using a single-mode fibre-fed integrated optics chip (Benisty et al., 2009; Jocou et al., 2014). The between the science and reference beam combiners is measured with a dedicated laser metrology system (Lippa et al., 2016; GRAVITY collaboration et al., 2017A).
Adaptive optics correction residuals such as slow field drifts (tip/tilts) and non-common path aberrations and telescope/optical pupil motions111Optical train vibrations cause pupil motions while tracking the object of interest with the delay lines. (lateral and longitudinal or pupil defocus shifts) are a concern to be corrected. They degrade the performance in terms of: a) instrument sensitivity, because of star’s light injection problems into the single-mode fibres in the presence of field drifts; b) astrometric errors due to field drifts and pupil shifts caused baseline paradox (Lacour et al., 2014; Woillez & Lacour, 2013; Colavita, 2009); c) image reconstruction errors due to inaccurate phases222Of relevance for, e.g., imaging stellar high signal-to-noise surfaces..
The astrometric error caused by the presence of field tip-tilts (), lateral () and longitudinal () pupil shifts is (cf. Figure 2, Lacour et al., 2014)
| (1) |
In order to achieve the GRAVITY goal of 10 as astrometric precision, the telescope beams must be corrected with residuals in the field to less than 10 mas root-mean-square (RMS) deviation error333This is given by , with , m (Lacour et al. 2014)., the lateral pupil to less than 40 mm RMS and the longitudinal pupil to less than 10 km RMS, at the UTs (Lacour et al., 2014). To enable these corrections a four beam imaging and guiding instrument, the multiple beam acquisition and guiding camera, was built.
The paper is presented as follows. In Section 2, the optical layout and functions of the multiple beam acquisition and guiding camera are briefly described. The methods of extraction of the beam guiding parameters from the image are presented in Section 3. Section 4 and 5 present the instrument concepts validation and characterization results at the laboratory and on-sky. The paper ends with a summary and conclusions.
2 The multiple beam acquisition and guiding camera optical functions
2.1 Overall optical layout
The multiple beam acquisition and guiding camera is a subsystem of GRAVITY. It has two sub-units: a) the external folding optics; and b) the core beam analyser. The folding optics has four optical entrance channels, accepts four 18 mm sized near infrared beams and redirects them into the beam analyser. The beam analyser is the core of the multiple beam acquisition and guiding camera. It implements four important optical functions (cf. Figure 3): a) pupil tracker – measures the telescope pupil shifts; b) aberration sensor – measures quasi-static wavefront aberrations; c) pupil imager – images the telescope pupil; and d) field imager – images the field and measures slow field drifts.
The multiple beam acquisition and guiding camera images are used to stabilize the telescope beams using tip-tilt and piston systems (TTPs), pupil motion controllers (PMCs, Pfuhl et al., 2014) and variable curvature mirrors (VCMs, Ferrari et al., 2003). The tip-tilt and piston systems are actuated mirror controllers placed in the pupil plane of the optical train where incoming beams are propagated. These are used to correct the field drifts. The pupil motion controllers are the pupil lateral shift mirrors located in a field plane of the optical train. They are used to correct the lateral pupil offsets. The variable curvature mirrors are focus/defocus mirrors placed at the image plane in the VLTI delay lines (Derie, 2000). These are used to adjust the position of pupil longitudinally (pupil focus correction).
The specifications of the multiple beam acquisition and guiding camera have been defined as a trade-off between the beam guiding requirements (see Table 1) for the key Galactic Centre astrometry program of GRAVITY and the technical constraints (Amorim et al., 2012). The camera is designed to work in H-band wavelengths (1.45-1.85 ) for the following reasons: a) the Galactic Centre is situated behind 30 magnitudes of visible extinction (Genzel et al., 2010) and is brighter in the near infrared; b) the VLTI throughput is optimized in the infrared as most of the visible light is fed into the visible wavefront sensors at the transmitted Coudé focus (Arsenault et al., 2003); c) the H-band is as close as possible to the science wavelengths (K-band). To increase stability and to reduce thermally emitted backgrounds, the camera operates at cryogenic temperatures (the detector at 80 K, the beam analyser at K, the external folding optics at 240 K). The core optical functions of the camera are manufactured with a single optical material (fused silica, the coefficient of thermal expansion ) to minimize stresses when it is cooled down to the cryogenic temperature. The optical functions are imaged on a pixel Hawaii-2RG detector (Finger et al., 2008; Mehrgan et al., 2016). The detector is operated in correlated double sampling readout mode with the frame rate of 0.7 s and the readout noise of RMS error. The optical functions of the beam analyser are detailed in the following sections.
| Parameter | Value (RMS) | |
|---|---|---|
| Lateral pupil guiding | mm | |
| Longitudinal pupil guiding | km | |
| Field guiding | mas | |
| Wavefront accuracy | nm |
2.2 Pupil tracker
The VLTI pupils are re-imaged via delay lines in the GRAVITY beam combiner instrument. In between the telescope pupil and the GRAVITY fibre-fed beam combiner there exist several optical pupils including the delay lines. The pupils move laterally and longitudinally, due to the optical train vibrations, while tracking the object of interest. The GRAVITY beam combiner obtains the effective pupil, i.e. the barycentric mean of all these randomly positioned pupil apertures in the whole optical train from the telescope to the beam combiner. The effective pupil is different from the telescope pupil. The typical maximum lateral pupil error is around % of the pupil ( m for an 8 m pupil), much larger than the 40 mm required to achieve as astrometry (see Table 1).
While equalizing the optical paths of the telescopes with the delay lines, the longitudinal pupil position (or pupil defocus) has to be adjusted constantly using the delay line variable curvature mirrors to preserve the field of the VLTI (, Ferrari et al., 2003). The variable curvature mirror corrects the longitudinal pupil positions (pupil defocus) by adjusting its curvature based on a calibration pointing model. Limitations in the pointing model introduce residual longitudinal pupil drifts. The typical maximum longitudinal pupil error is around 30 km at the UT. Whereas the requirement for the as astrometry is 10 km (see Table 1). In order to measure these pupil shifts, the pupil tracker was designed (Pfuhl et al., 2012; Amorim et al., 2012).
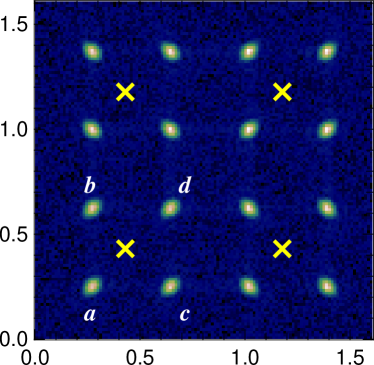
To detect the pupil motions, the telescope pupil is imaged by a lenslet. Telescope pupil reference laser beacons (1.2 ) are used. For each telescope, four beacons are mounted on the four symmetric spider arms (cf. left of Figure 6). The barycentre of these four laser beacon positions gives the centre of the pupil. These telescope pupil reference laser beacons are separated by 1.6 m and 0.4 m diagonally on the UTs and ATs, respectively (cf. Table 2).
Figure 4 (a) and (b) illustrate a case of a laterally shifted pupil, i.e., the 2 2 lenslet formed spots are laterally shifted from the reference telescope pupil formed spots. Figure 4 (c) and (d) illustrate a case of longitudinally shifted pupil, i.e., the lenslet formed spots have either converged () or diverged () with respect to the reference spots depending on the direction of the longitudinal displacement.
| Parameter | Value | |
|---|---|---|
| Wavelength | 1.2 µm | |
| lenslet | on mm | |
| Focal length () | 14 mm | |
| Reference beacons separation | 1.6 m | |
| Field of view | 11.2 m | |
| Pixel scale | 59.86 mm pixel-1 | |
| Detector pixel size ( | 18 µm | |
| Field stop |
2.3 Pupil imager
The pupil imager is designed to verify the pupil image quality visually (e.g. to identify pupil vignetting or pupil shifts). It is used to align GRAVITY with the VLTI during the commissioning/installation and visually monitor the telescope pupil during observations. It images the telescope pupils using telecentric lenses. Its specifications are presented in Table 3.
| Parameter | Value | |
|---|---|---|
| Wavelength | H-band (1.45-1.85 µm) | |
| Field of view | 11.2 m | |
| Pixel scale | 54 mm pixel-1 | |
| Flux for mag | ||
| Field stop |
2.4 Field imager
The UTs are equipped with near infrared wavefront sensors based adaptive optics (CIAO, Scheithauer et al., 2016). The ATs, currently are only equipped with tip-tilt sensors and they will have adaptive optics modules in the near future (NAOMI, Gonté et al., 2016). In both cases, GRAVITY experiences slow field drifts greater than 10 mas due to its correction residuals and the VLTI tunnel seeing effects. The field imager aims to track these slow field motions. Its specifications are presented Table 4. The slow field tracking (with a frequency of 1 Hz) is to be complemented by a fast tip-tilt monitoring system. This system works by injecting the visible tip-tilt laser beacon beams before the VLTI tunnel and by imaging them inside GRAVITY, using the position sensitive diodes (Pfuhl et al., 2014). It will measure the field motions between the telescopes and GRAVITY.
| Parameter | Value | |
|---|---|---|
| Wavelength | H-band (1.45-1.85 µm) | |
| Field of view | ||
| Pixel scale | 17.78 mas pixel-1 | |
| Flux for mag star |
In GRAVITY, single-mode fibres feed light into the integrated optics (Jocou et al., 2014; GRAVITY collaboration et al., 2017A), which implements the actual beams combination. The light injection into these fibres is stabilized by using the field imager measured field drifts (cf. Figure 5). The accurate position of star is detected by the field imager using the H-band beam. Using this position, the single-mode fibre is aligned to the parabola focus with the fibre positioner (Pfuhl et al., 2014). Also using this position, the star light injection into the single-mode fibre is stabilized using the tip-tilt mirror located in front of the incoming beam.
2.5 Aberration sensor
The aberration sensor is designed to detect the quasi-static residuals of the UTs adaptive optics system (Scheithauer et al., 2016). For the ATs, it measures the telescope static aberrations as the ATs are not equipped with the adaptive optics yet. The measured quasi-static aberrations are used, once in a while, to focus the ATs or to correct the non-common path aberrations between the UTs adaptive optics system and GRAVITY. It consists of four Shack-Hartmann sensors, each with sub-apertures. Its specifications are presented in Table 5.
| Parameter | Value |
|---|---|
| Wavelength | H-band (1.45-1.85 µm) |
| Lenslet | |
| Field of view per sub-aperture | 4′′ |
| Pixel scale | 250 mas pixel-1 |
| Sub-aperture size | pixel2 |
| Maximum Zernike order measured | 28 |
| Sub-aperture flux for an mag star | |
| Field stop |
The pixel scale magnification in the field between the UTs and the ATs is , i.e. the field imager 17.78 mas/pixel scale at the UTs becomes 79 mas for the ATs. The pixel scale de-magnification in between the UTs and ATs for the lateral pupil and longitudinal pupil is and , respectively.
3 Methods for beam guiding parameters extraction
3.1 Image acquisition and analysis software
A dedicated real-time software extracts the beams stabilization parameters from the detector images. The software is implemented within the ESO control software framework. It is written in C and C++ using mainly the ESO standard Common Library for Image Processing (CLIP, Ballester et al., 2008) and Common Pipeline Library (CPL, McKay et al., 2004) and installed in the VLT common software. It works on a Linux operating system based instrument workstation and does the image analysis in three steps. Firstly, every 0.7 s it integrates the multiple beam acquisition and guiding camera detector image and stores it in the instrument workstation shared memory. Secondly, it copies the detector image from the instrument shared memory and by analysing the input detector image it evaluates beams tip-tilts, pupil shifts and beam aberrations. These parameters are written to the instrument database and used for the beam stabilization in the closed loop. The multiple beam acquisition and guiding are carried out in real-time on the instrument in parallel to the observations, for all four telescopes.
3.2 Pupil tracking
meter
meter
The lateral and longitudinal shifts of the telescope pupils are translated as tip-tilt and defocus aberrations when imaged on the 2 2 lenslet. The pupil shifts are evaluated by analysing the pupil tracker image in three steps. First, the reference sub-aperture spots are generated by illuminating an internal reference laser source, which is implemented by the calibration unit (Blind et al., 2014). Next, each sub-aperture position () is computed by applying Gaussian fits. Second, the telescope pupil reference laser beacons spots in the detector image (see Figure 6) are identified using a flux threshold ( above background) and their full-width-half-maximum (FWHM) thresholds. Next, their positions are computed. From the spot positions, the centre of each sub-aperture () is determined by taking the average of the telescope reference laser beacon positions. Finally, the spot shifts () are computed by comparing them with the internal reference sub-aperture positions ()
The telescope lateral pupil shifts are evaluated by taking the average of these spot shifts along the and directions
| (2) |
The longitudinal pupil shifts are evaluated by computing the amount of convergence or divergence (in radians) of the spot shifts (Eq. 3, Salas-Peimbert et al., 2005)
| (3) |
where is the focal length of the lenslet and the detector pixel size (cf. Table 2).
3.3 Pupil imaging
The pupil imager is used to visually monitor the telescope pupils for their quality during the preparation for observations and also while observing. However, it can also be used, in future, for the lateral pupil tracking in the presence of a bright astrophysical source. A cross-correlation algorithm (Poyneer, 2003) allows computing the pupil shift from a shifted pupil image by correlating it with the reference pupil image.444The reference pupil image is the pupil image where one wants to lock the pupil during observations. It can be a long exposure image of the telescope pupil.
3.4 Object tracking with the field imager
The field imager measures these field drifts by tracking the brightest object in the user-specified region (window) of interest. Windowing is important in crowded regions such as the Galactic Centre. The position of the brightest object is computed in two steps. Firstly, stars in the field are scanned using a flux threshold above background and a predetermined FWHM. Next, the detected stars are sorted in decreasing flux order. Secondly, the accurate position of the brightest object is computed with a Gaussian fit in a window size of pixel2 centred on the object. To track binaries where both stars are of comparable magnitude, the position of the second brightest object within the window is also measured, the tracking reference is chosen by the instrument operator.
The atmospheric differential refraction effects are of relevance because the H-band photo-centre is used to estimate the fibre coordinates to inject the K-band beam into the fibre. The shift () caused by the atmospheric differential refraction (e.g. Roe, 2002) is
| (4) |
with and the field imager (H-band) and the fibre (K-band) accepting wavelengths, and the corresponding refractive indices and is the object zenith distance. The refractive index for a given wavelength and in function of the observing conditions (temperature, pressure and humidity) is computed using Eq. 1 in Roe (2002).
Since the effective wavelength of the field imager, , changes with the colour of the object, its value is modelled (Stone, 2002) as a function of the H-K colour considering the atmospheric transmission and the instrument transmission555Product of all filters transmission, reflection of mirrors and efficiency of the detector as a function wavelength..
The atmospheric differential refraction object offset () correction is applied in real time given the H-K object colour inserted by the observer in the observing block.
3.5 Beam wavefront sensing with the aberration sensor
The reconstruction of the aberrated wavefront is done by comparing the reference Shack-Hartmann spot locations with the aberrated spot locations. The reference spots were obtained as part of the calibration procedure using a collimated beam. During the observations, the spots of incoming telescope beams are acquired. The centroids of these spots are computed by applying Gaussian fits. When an extended scene is observed, the centroids are computed using a cross-correlation algorithm (Poyneer, 2003). Slopes of the spot shifts are computed by taking differences between the target and the reference spot positions. These slopes are normalized by the focal length of the lenslet. Using these slopes, higher order aberrations of the input beams are evaluated in terms of Noll’s Zernike coefficients (Dai, 1996) up to 28 in number.
3.6 End-to-end simulations
A meticulous numerical modelling of the multiple beam acquisition and guiding camera is carried out to verify the beam analysing methods. These simulations are implemented in the Yorick666http://yorick.sourceforge.net/ programming language for an easy interpretation, debugging and plotting. The LightPipes (Vdovin et al., 1997) ANSI C library was ported to Yorick and the adaptive optics yao (Rigaut et al., 2013) library was used.
The multiple beam acquisition and guiding camera detector images are generated using the optomechanical model parameters (in Zemax, Amorim et al., 2012) and by applying the VLTI laboratory experimentally measured field motions, pupil motions (lateral and longitudinal) and higher order wavefront aberrations. Finally, the input beam aberrations are reconstructed back and characterised the multiple beam acquisition and guiding camera performance in terms of its accuracy in the presence of adverse imaging conditions and sensitivity towards the faint stars. Table 6 presents the numerical analysis of the accuracy of the multiple beam acquisition and guiding camera.
| Parameter | Requirement | Simulation |
|---|---|---|
| (RMS) | (RMS) | |
| Lateral pupil guiding | mm | mm |
| Longitudinal pupil guiding | km | m |
| Field guiding | mas | mas |
| Wavefront measurement | nm | nm |
4 Laboratory characterization
meter
arcsec
meter meter
 arcsec arcsec
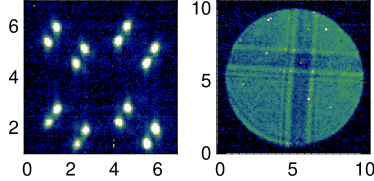
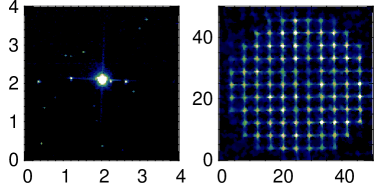
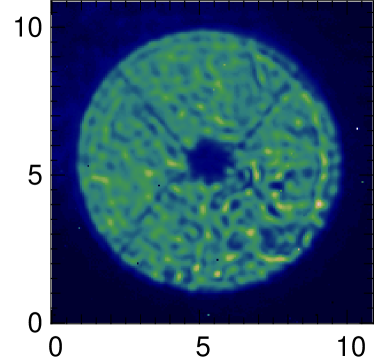
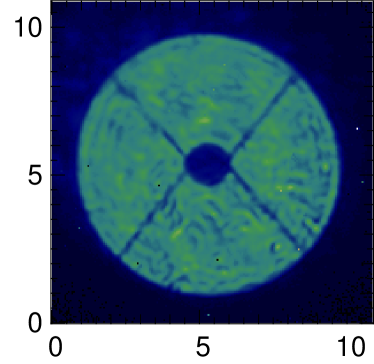
The multiple beam acquisition and guiding camera is characterized using the GRAVITY calibration unit in the MPE laboratory (Blind et al., 2014). The calibration unit simulates an artificial launch telescope designed by a parabolic mirror and two artificial stars with 95% Strehl ratio by illuminating two single-mode fibres. The four telescope pupil reference laser beacon beams are generated by four multi-mode fibres inserted in a pupil plane. Figure 7 presents the imaging modes of the camera, for one telescope, when illuminated by the calibration unit.
The field of view (FoV) of the pupil tracker, pupil imager and aberration sensor are estimated by scanning (applying tilts) a star target over their field of view. During the scanning, the flux and position of the target are recorded in each window. Figure 8 presents the flux in the pupil tracker, pupil imager and aberration sensor windows as a function of star target position. The field stop of each optical function is apparent in the width of the curves in Figure 8, being . The field stops as built matched the design values (cf. Tables 2,3 and 5).
Normalized flux


FoV(′′) FoV (′′) FoV (′′)
(mm)

4.1 Pupil tracking performance
The pupil tracker pixel scale is measured by equating the separation of telescope pupil reference laser beacons observed on the detector to the separation of those beacons installed on the telescope of the calibration unit. The measured value is within 5% of the design value of (Table 2).
The lateral pupil tracking performance is characterized in the laboratory by manipulating the pupil lateral correcting actuators. This experiment is carried out in two steps. First, known lateral pupil shifts are applied to the incoming beams by actuating the pupil lateral correcting actuators. Second, the input pupil shifts are estimated from the pupil tracker images as explained in Section 3.2. Figure 9 shows that the lateral pupil position measurement performance is in agreement with the end-to-end simulations and 10 better than the requirement. The longitudinal pupil tracking performance could not be characterised at the MPE laboratory, because of the unavailability of longitudinal pupil actuators inside the GRAVITY instrument. It is tested at the VLTI laboratory using the variable curvature mirrors available in the delay lines (cf. Section 5).
4.2 Field tracking performance
To characterize the performance of the field tracker, a known tip-tilts values are applied to the incoming beams and measured them back using the field tracker as explained in Section 3.4. The tip-tilts to the incoming beams are applied using the tip-tilt actuators. Figure 10 left panel presents the absolute error of the object position as a function of a known input tilt. The error is less than 2 mas. These measurements are done at high signal-to-noise conditions, i.e., negligible readout noise centroid error contribution. Figure 10 right panel presents the absolute RMS error as a function of the magnitude of a star. An absolute RMS error of 1 mas is observed for the equivalent of a mag star.
(mas)

(mas)

(arcsec) Magnitude,
Injection performance
Figure 11 shows how the injection of star light into the fibre drops with unwanted tilts. From the figure, it can also be seen that the size of the fibre core is around 60 mas. Using the field tracker enabled field stabilization the coupling efficiency of the fibre is maintained around 75%.
Normalized flux

Tilt (′′)
Atmospheric differential refraction
The atmospheric differential refraction offset (Eq. 4) importance can be computed using the effective wavelengths and a zenith angle . It is mas (which corresponds pixel shift) and corresponds to a % loss of injection of light into the fibre.
4.3 Beam aberration sensing and performance
The aberration sensor wavefront estimation performance test is carried out in two steps. First, the focal lengths of the Shack-Hartmann lenslet are calibrated by applying series of tilts to the incoming plane wavefront (Kumar et al., 2013). Second, to measure the accuracy of the aberration sensor, known tip-tilt and defocus wavefront aberrations are applied to the incoming beams and measured them back using the aberration sensor function as explained in Section 3.5. Figure 12 presents the RMS wavefront error observed as a function of an input wavefront (tip, tilt and defocus RMS errors). It can be seen that the wavefront accuracy is at the UT scale. In this experiment a sub-aperture flux equivalent to a mag star () is used.
RMS wavefront error (nm)

Input wavefront error (at )
5 On-sky characterization
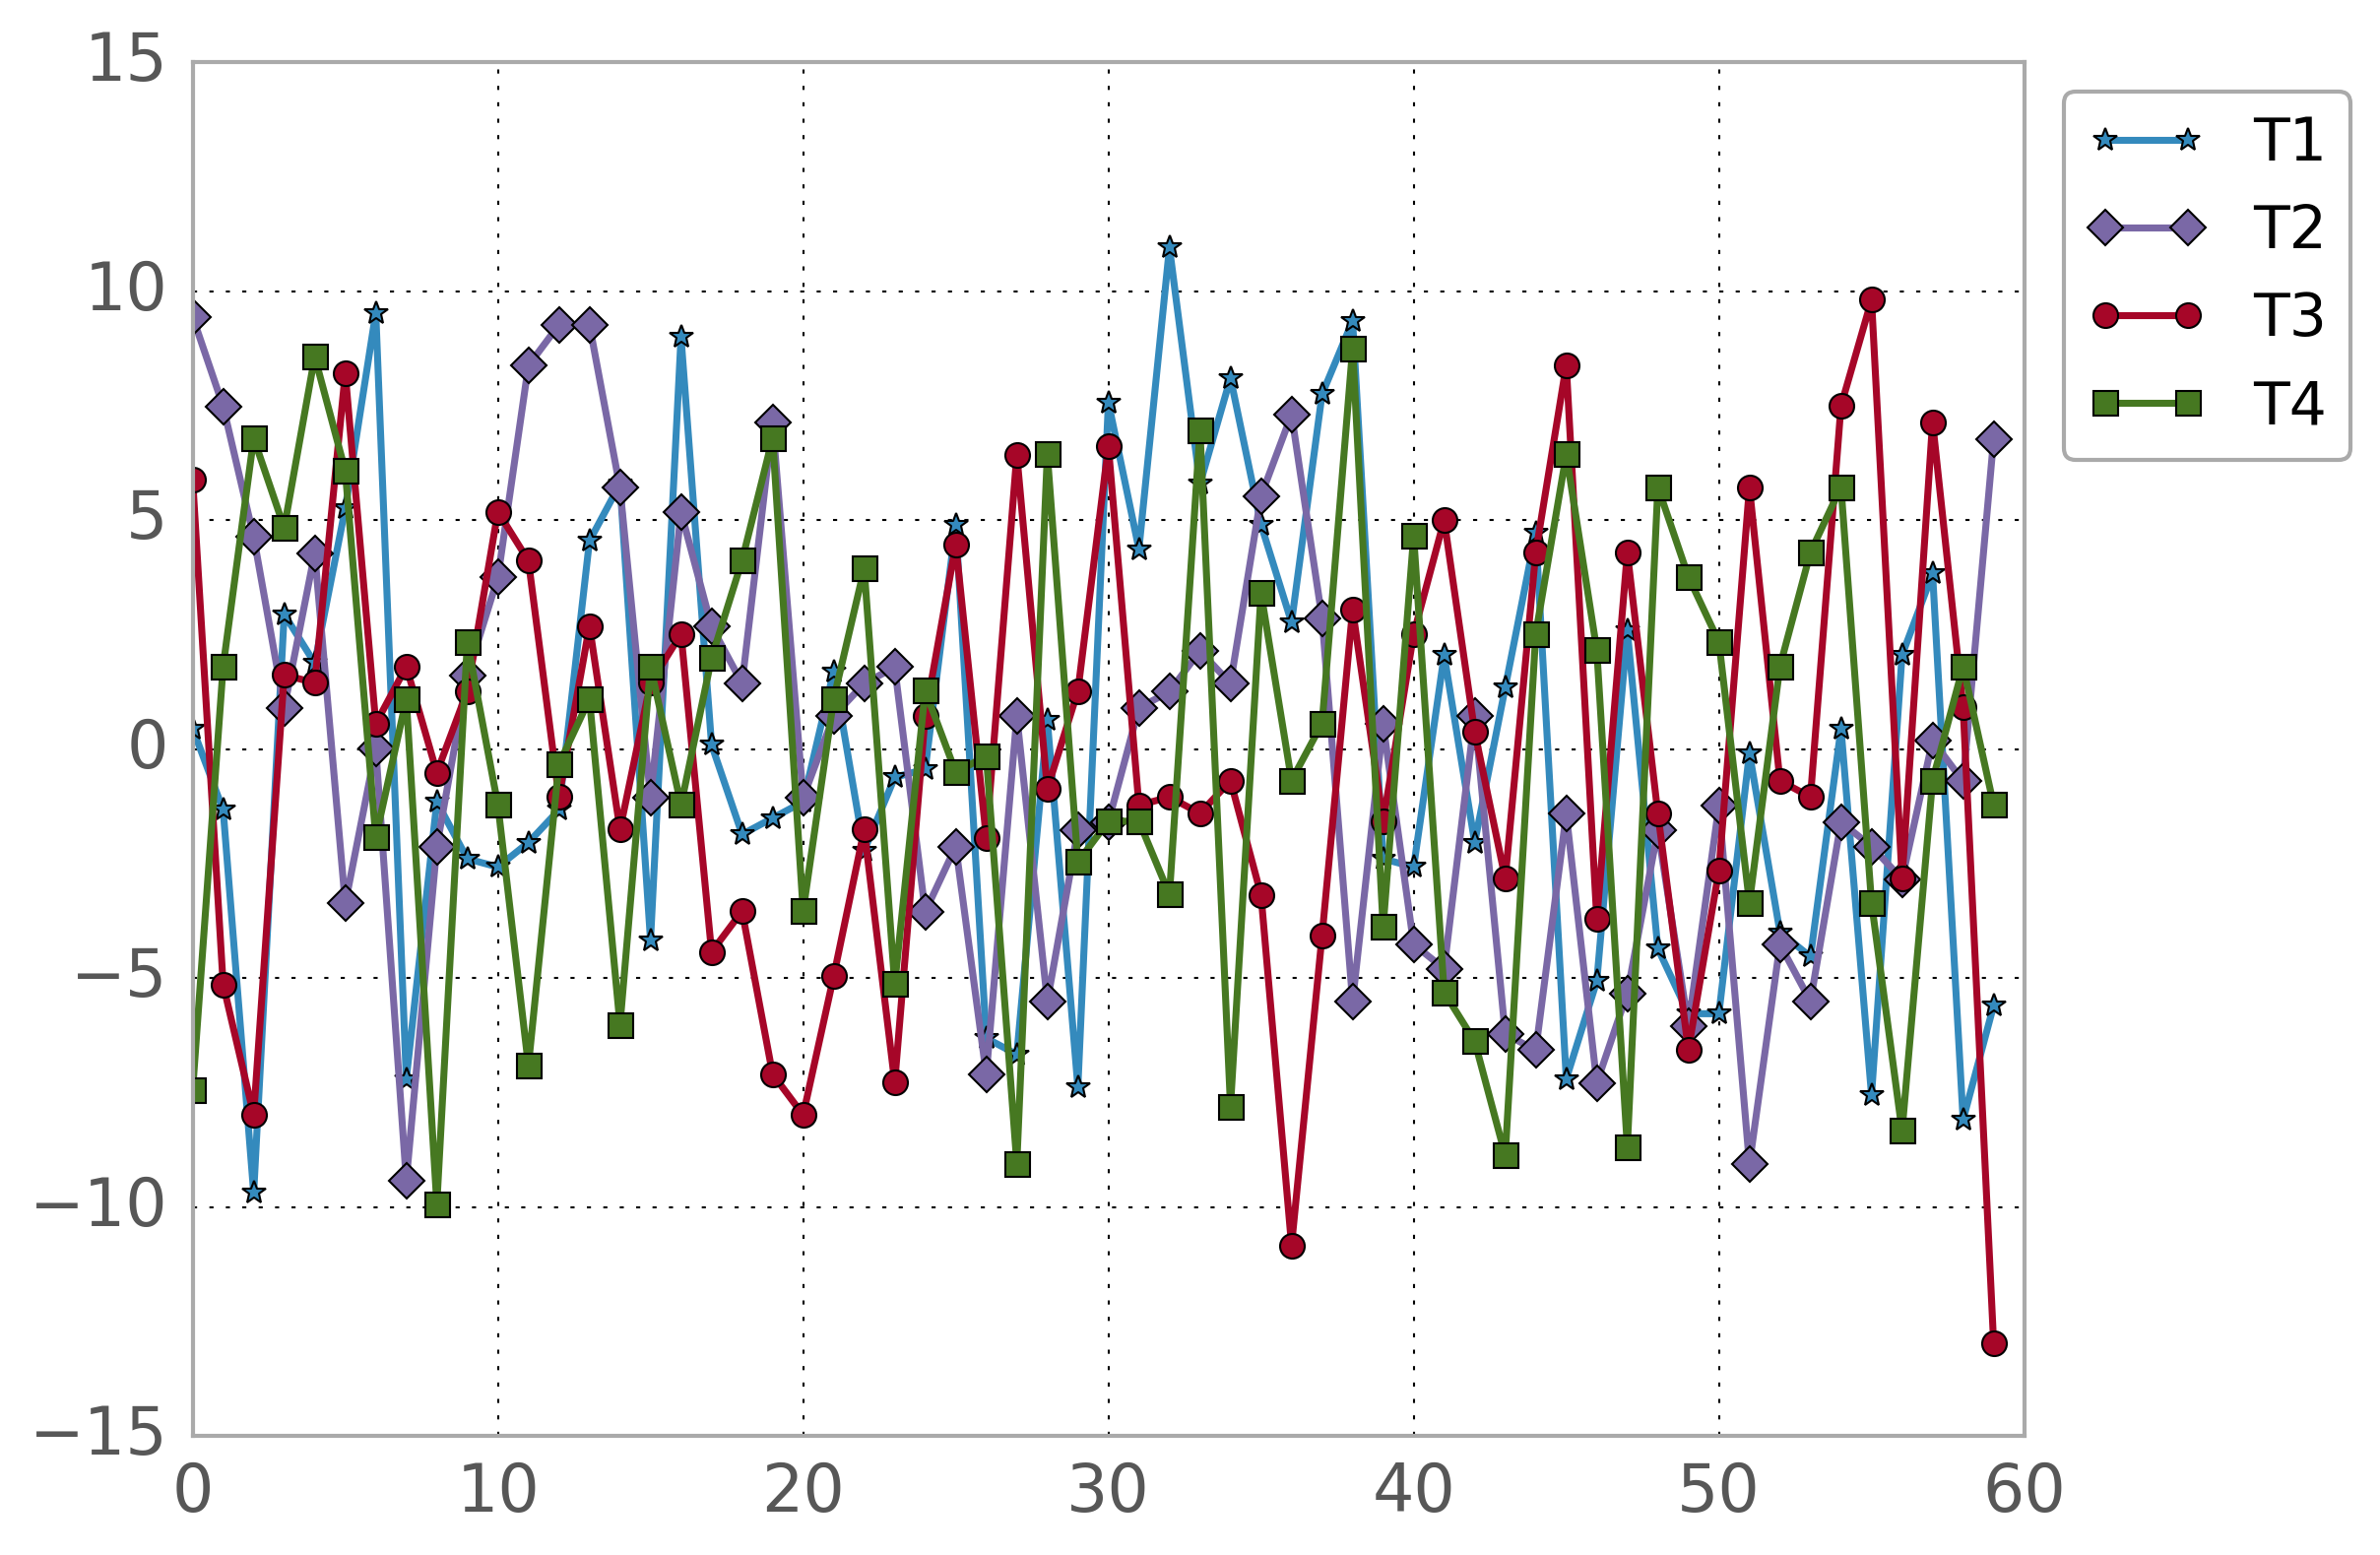
5.1 Image quality characterisation
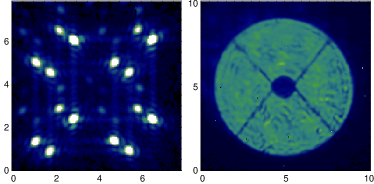
Based on verification tests at MPE, the GRAVITY instrument passed Preliminary Acceptance Europe (PAE) in May 2015. The instrument was then deployed at the Paranal Observatory, Chile and got its first light in November 2015. Figure 13 presents the multiple beam acquisition and guiding camera detector image acquired on-sky with the UTs. Table 7 presents the Strehl ratio and the star FWHM at the camera when it was illuminated using the calibration unit. Also, the pixel scale which is measured, at the laboratory and at the Paranal Observatory on-sky, are presented.
meter
arcsec
meter meter
arcsec arcsec
| Telescope | Strehl | FWHM | Pixel scale | Pixel scale |
|---|---|---|---|---|
| arm | ratio lab | at lab | at lab | on-sky |
| (pixel) | (mas pixel-1) | (mas pixel-1) | ||
| T1 | 0.90 | 2.65 | 18.23 | 17.77 |
| T2 | 0.85 | 3.12 | 18.51 | 18.00 |
| T3 | 0.70 | 3.18 | 18.20 | 17.64 |
| T4 | 0.63 | 3.51 | 18.76 | 19.53 |

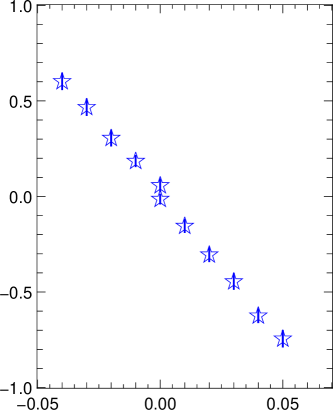
The sky field of view of the camera is larger than the nominal VLTI field of view (). This is confirmed by imaging (long exposures) the sky on the field imager and by moving the VLTI star separator tip-tilt mirrors (FSM, Delplancke et al., 2004) in several steps. Figure 14 presents the VLTI field of view and is around at the UTs. This value is less than the design value (cf. Table 4).
5.2 The pupil tracker characterisation
(mm)

(m)
Longitudinal pupil tracking performance is characterized at the VLTI laboratory by injecting artificial light source beams into the GRAVITY instrument via the delay lines, using the ARAL facility (Morel et al., 2004). The longitudinal pupil shifts are simulated by manipulating the delay line variable curvature positions. Known longitudinal pupil shifts () are applied to the beam by moving the variable curvature mirror and the input shifts are measured back () using the pupil tracker function as explained in Section 3.2. The longitudinal pupil accuracy (see Figure 15) is better than 400 m (i.e., magnification between the 8 m telescope and 80 mm beam inside the lab). Figure 16 presents the UT pupil, before and after closing the pupil guiding loop. After closing the pupil guiding loop, an improvement of pupil focus can be seen.
meter
meter
meter meter
Bright target performance
The pupil tracker experiences high backgrounds from bright astrophysical targets observed in the J and H-bands due to: a) the closeness of the operating wavelengths of the pupil tracker (1.2 ) and the field imager; b) because of no adequate filter is available for the pupil tracker. The best operation of the pupil guiding is possible when: a) the flux of the telescope pupil reference laser beacons is high; b) imaging a lower magnitude or red coloured astrophysical target (with low flux at 1.2 ). The background problem is solved to a certain extent on two fronts: a) using the neutral density attenuation filters777In order to not saturate the camera detector in bright astrophysical targets, GRAVITY is equipped with H-band neutral density attenuation filters (10 and 5 magnitudes) in front of the camera.; b) using the BLINK mode. This mode removes the background by taking two frames with the laser beacons on and off. The exposure with the beacons on is subtracted from an exposure with the beacons off. This effectively removes the background caused by the astrophysical target. With this mode, the performance of the pupil guiding is improved additionally by 2 magnitudes. The performance of the pupil guiding as a function of target magnitude is presented in Figure 17. The pupil tracker performance degrades significantly for targets brighter than mag.
or (cm)

(m)

Magnitude, Magnitude,
5.3 The pupil imager
The pupil imager is, currently, used to visually monitor the telescope pupils for their quality during the preparation for observations and also while observing. However, it can also be used for the lateral pupil tracking in the presence of a bright astrophysical source to complement the problem of the pupil tracker (see Section 3.3).
5.4 The aberration sensor focus calibration
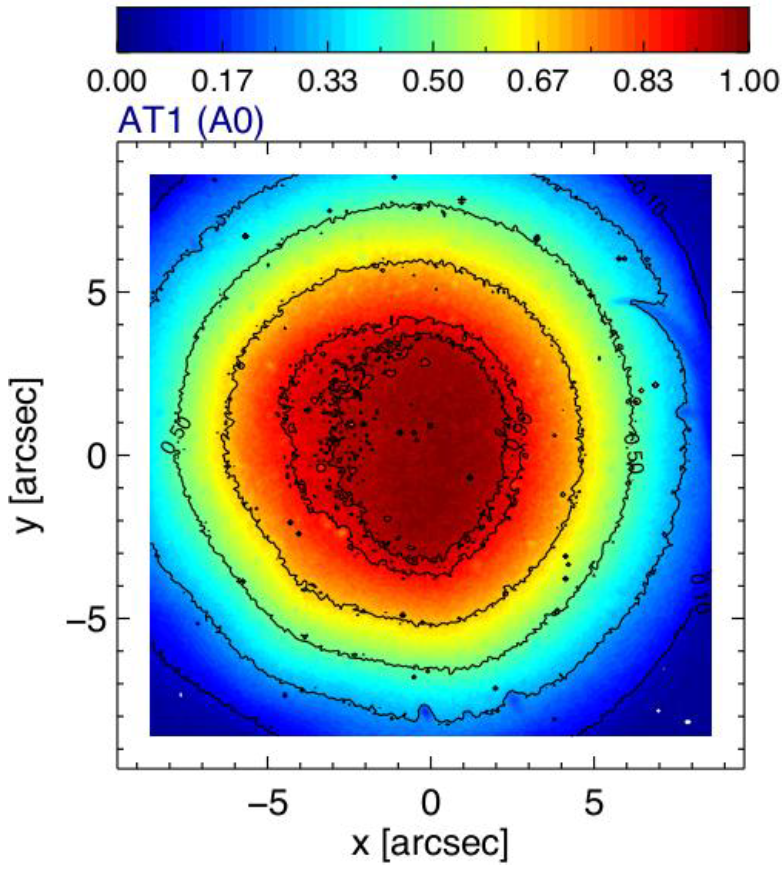
The aberration sensor is used for the focus correction for ATs. Figure 18 shows the aberration sensor focus measurement calibration as a function of the secondary mirror (M2) position (in arbitrary units). The right panel presents the corresponding star FWHM measured in the field imager.
RMS defocus (in
FWHM of star (pixel)
M2 position (a.u.) M2 position (a.u.)
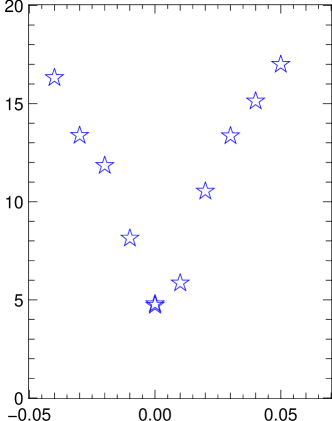
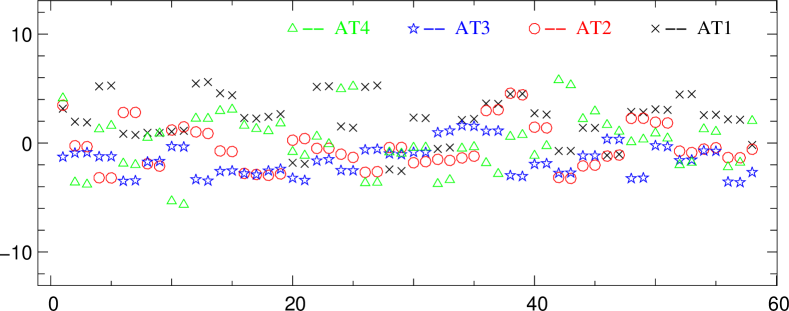
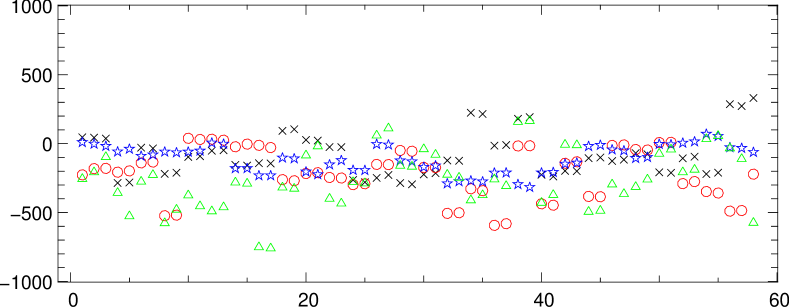
5.5 The field and pupil guiding residuals
The field and pupil beam stabilizations are achieved with two types of actuators. The smaller field and pupil offsets occurring during interferometric observations are corrected in the closed loop using the GRAVITY internal actuators for speed and accuracy. Larger field and pupil offsets, which usually occur during the initial alignment of GRAVITY, are corrected using the VLTI based star separator actuators and delay line variable curvature mirror. If when operating in closed loop the offsets are larger than internal actuators range, they are offloaded to the VLTI star separator actuators.
Often, GRAVITY experiences optical misalignments with the VLTI, in the worst case, the field offsets of mas RMS and lateral pupil offsets of 5% (0.4 m RMS) in the UT pupil. With the multiple beam acquisition and guiding camera enabled beam guiding, the field, lateral pupil and longitudinal pupil guiding are implemented with standard deviation residuals smaller than pixels RMS (10 mas RMS), pixels RMS (12 mm RMS) and m RMS at the UT respectively. Figures 19 and 20 present the field and pupil guiding residuals.
Field residuals (mas)
Continuous frames
Lat. residuals (mm)
Number of measurements (for each second frame)
Long. residuals (m)
Number of measurements (for each second frame)
5.6 Astrometric residuals study
| Residual | One | Four | |
|---|---|---|---|
| errors | telescope | telescopes | |
| Without beam guiding residuals | km | as | as |
| Beam guiding requirements | 4 as | as | |
| Laboratory beam guiding residuals | – | – | |
| On-sky beam guiding residuals | 1.2 as | as |
The total astrometric error produced by the four telescopes (ref Eq. 1) adds to
| (5) |
The astrometric error caused by the field and the pupil motions is around 633.3 as and 2.4 as before and after closing the beam guiding loop, respectively, at the UT and for the baseline of 100 m. Table 8 gives the summary of the guiding requirements and the achieved beam guiding is several conditions. The on-sky residuals are larger than the laboratory characterization (using the calibration unit generated beams) results because the multiple beam acquisition and guiding camera frame rate (0.7 s) is not quick enough to correct them.
A GRAVITY observation is described in detail in GRAVITY collaboration et al. (2017A). An animation of starlight tracing through the GRAVITY instrument is available elsewhere888http://www.eso.org/public/videos/eso1622b/.
Operation of GRAVITY with the multiple beam acquisition and guiding camera started with the ATs in October 2016 and with the UTs in April 2017. GRAVITY first light and science verification results are published in, e.g., GRAVITY collaboration et al. (2017A, B, C, D); Le Bouquin et al. (2017); Kraus et al. (2017). The first verification of the narrow-angle astrometry of GRAVITY is done with an M-dwarf binary, GJ 65 and estimated the binary separation with residuals of 50 as (GRAVITY collaboration et al., 2017A). However, the astrometric residual errors can be reduced further by computing the guiding residual errors carefully from the multiple beam acquisition and guiding camera images in off-line in the data reduction pipeline and inputting them into the astrometric calculations. There are also other possible error contributors in the GRAVITY measurements but they are out of the scope of this paper to describe in detail: a) uncertainty in the calibration of the narrow-angle astrometric baseline and wavelength; b) dispersion in the single-mode fibres and integrated optics.
6 Summary and conclusions
Accurate beam acquisition and guiding camera methods for phase referencing optical/infrared interferometry are presented. These methods offer advances in near-infrared imaging and optical/infrared long-baseline interferometry: a) accurate and active pupil and field guiding required for sensitivity and astrometry; b) the characterization of the input telescope beams quality, the focus correction for the ATs and the possibility of correcting the non-common path aberration errors between the adaptive optics system and GRAVITY.
The beam acquisition and guiding camera performance is verified using laboratory-generated telescope beams and on-sky at the VLTI. The characterization results show that it is able to analyse the telescope beams: a) field tracking in a crowded field with mas RMS residuals translates in a 75% coupling efficiency of near-infrared starlight into single-mode fibres b) lateral pupil tracking with residuals less than 12 mm RMS; c) longitudinal pupil tracking with residuals less than 400 m RMS; d) quasi-static higher order wavefront aberration measurements with 80 nm RMS. The multiple beam acquisition and guiding camera measured beam parameters are used in the stabilization of the field, pupil and the ATs focus correction. The pupil imager is used to visually monitor the telescope pupils for their quality during the preparation for observations and also while observing. In overall, the performance of the camera is in agreement with the requirements of the GRAVITY science programs, although some work is still needed to push the residual errors further down by implementing the post-processing of the multiple beam acquisition and guiding camera images in the data reduction pipeline and also by correcting the non-common path aberration errors between adaptive optics and GRAVITY.
The adaptive optics assisted camera imaging is an asset for the GRAVITY science observations as it provides H-band images of the target using four different telescopes, simultaneously, in parallel to the interferometric observations in the K-band. This imaging can be useful in three ways: a) to extend wavelength coverage in the H-band (1.45-1.85 ); b) to extend spatial resolution coverage (low resolution images from the field imager and the high resolution images from the interferometric large baselines); c) to solve the interferometric phase wrapping ambiguity999If the two stars separated more than , they suffer phase wrapping ambiguity. using the multiple beam acquisition and guiding camera field images, provided that the camera is astrometrically calibrated (e.g. Yelda et al., 2010).
Although the multiple beam acquisition and guiding camera is a subsystem of GRAVITY, it can be used for other interferometric beam combiner instruments available at the VLTI (e.g. MATISSE, Lopez et al., 2014) for the purpose of an automated alignment with the VLTI and for closed loop tip-tilt guiding. Furthermore, the accurate pupil guiding developed here is of relevance: a) to high-contrast imaging as it requires pupil stabilization enabled extreme adaptive optics (e.g. SPHERE, Montagnier et al., 2007); b) to correct the misregistration of pupils in between the wavefront sensor and the deformable mirror, where they have moving optics in between101010e.g., the case where the deformable mirror placed at the telescope or the Coudé focus and the wavefront sensor placed inside the beam combiner laboratory.; c) to the accurate alignment of pupil mask to match the telescope pupil in order to limit the background radiation coming into the spectrographs (e.g. HARMONI, Hernandez et al., 2014). The pupil tracker allows both the telescope pupil rotation and the lateral shifts estimation accurately.
Acknowledgements
We thank the technical, administrative and scientific staff of the participating institutes and the observatory for their extraordinary support during the development, installation and commissioning of GRAVITY. We thank the referee for her/his constructive and insightful report. Anugu acknowledges FCT and IDPASC-Portugal for his PhD grant SFRH/BD/52066/2012. The research leading to these results received funding from PTDC/CTE-AST/116561/2010, COMPETE FCOMP-01-0124-FEDER-019965, UID/FIS/00099/2013. This research was partially funded by European Commission Seventh Framework Programme, under Grant Agreements 226604 and 312430 (OPTICON Fizeau Programme).
References
- Amorim et al. (2012) Amorim A., Lima J., Anugu N., et al., 2012,Proc. SPIE, 8445, 844534, 2012
- Arsenault et al. (2003) Arsenault R., et al., 2003, Proc. SPIE, 4839
- Ballester et al. (2008) Ballester P., et al., 2008,ADASS XVII, ASP Conference Series, 394
- Benisty et al. (2009) Benisty M., et al., 2009,A&A, 498, 2, 601-613
- Blind et al. (2014) Blind N., et al., 2014, Proc. SPIE, 9146, 91461U
- Colavita et al. (1999) Colavita M. M., Wallace J. K., Hines B. E., et al., 1999, ApJ, 510, 1, 505-521
- Colavita (2009) Colavita M. M., 2009, New Astronomy Reviews, 53, 344-352
- Dai (1996) Dai G. M., 1996, Journal of the Optical Society A, 13, 6, 1218-1225
- Delplancke et al. (2004) Delplancke F., et al., 2004, Proc. SPIE, 5491, 1528
- Derie (2000) Derie F., 2000, Proc. SPIE, 4006, 25-31
- Eisenhauer et al. (2011) Eisenhauer F., et al., 2014, The Messenger, 143, 16-24
- Ferrari et al. (2003) Ferrari M., et al., 2003, Proc. SPIE, 4838
- Finger et al. (2008) Finger G., et al., 2008, Proc. SPIE, 70210
- Genzel et al. (2010) Genzel R., Eisenhauer F., Gillessen S., 2010, Reviews of Modern Physics, 82, 4, 3121
- Gonté et al. (2016) Gonté, F. Y. J., et al., 2016, Proc. SPIE, 9907, 990720
- GRAVITY collaboration et al. (2017A) GRAVITY collaboration, et al., 2017, A&A, 602, A94
- GRAVITY collaboration et al. (2017D) GRAVITY collaboration, Lopez R. G., et al., 2017, A&A, arXiv preprint arXiv:1709.01348
- GRAVITY collaboration et al. (2017C) GRAVITY collaboration, Petrucciet P.-O., et al., 2017, A&A, 602, L11
- GRAVITY collaboration et al. (2017B) GRAVITY collaboration, Waisberg I., et al., 2017, ApJ, 844
- Hernandez et al. (2014) Hernández E., et al., 2014, Proc. SPIE, 91513F, 9151.
- Jocou et al. (2014) Jocou L., et al., 2014, Proc. SPIE, 9146, 91461J
- Kraus et al. (2017) Kraus S., et al., 2017, ApJ, 835, 1, L5
- Kumar et al. (2013) Kumar M. S., Narayanamurthy C. S., Kumar AS. K., 2013, Optical Engineering, 52, 12
- Lacour et al. (2014) Lacour S., et al., 2014, A&A, 7
- Le Bouquin et al. (2017) Le Bouquin J.-B., et al., 2017, A&A, 601, A34
- Lippa et al. (2016) Lippa M., et al., 2016, Proc. SPIE, 9907, 990722
- Lopez et al. (2014) Lopez B., et al., 2014, The Messenger, 157, 5
- McKay et al. (2004) McKay D. J., et al., 2004, Proc. SPIE, 5493, 444-452
- Mehrgan et al. (2016) Mehrgan L. H., Finger. G., Eisenhauer F., Panduro J., 2016, Proc. SPIE, 9907, 99072F
- Montagnier et al. (2007) Montagnier G., et al., 2007, Optics Express, 15, 23
- Morel et al. (2004) Morel S., et al., 2004, Proc. SPIE,5491
- Pfuhl et al. (2012) Pfuhl O., et al., 2012, Proc. SPIE, 84451U, 8445
- Pfuhl et al. (2014) Pfuhl O., et al., 2014, Proc. SPIE, 9146, 914623
- Poyneer (2003) Poyneer L. A., 2003, Applied Optics, 42, 29, 5807-5815
- Rigaut et al. (2013) Rigaut F., et al., 2013, Proc. AO4ELT 3, 2013
- Roe (2002) Roe H. G., 2002, PASP, 114, 794, 450-461
- Salas-Peimbert et al. (2005) Salas-Peimbert D. P., et al., 2005 Appl. Opt., 44, 20, 4228-4238
- Scheithauer et al. (2016) Scheithauer S., et al., 2016, Proc. SPIE, 99092L , 99092L
- Stone (2002) Stone R., 2002, PASP, 114, 800, 1070-1086
- Vdovin et al. (1997) Vdovin G., et al., 1997, Proc. SPIE, 3190, 1997
- Yelda et al. (2010) Yelda S., et al., 2010, ApJ, 725, 1, 331
- Woillez & Lacour (2013) Woillez J., Lacour S., 2013, ApJ, 764, 1, 109