Evolution of the Unidentified Infrared Bands in the Nucleus of the Starburst Galaxy NGC 1097
Abstract
We present the analysis of the Unidentified Infrared Bands (UIB) in the starburst galaxy NGC 1097. We have combined spectral maps observed with the AKARI/IRC and Spitzer/IRS instruments, in order to study all of the most prominent UIBs, from 3 to 20. Such a complete spectral coverage is crucial to remove the common degeneracies between the effects of the variations of the size distribution and of the charge state of the grains. By studying several UIB ratios, we show evidence that the average size of the UIB carriers is larger in the central region than in the circumnuclear ring. We interpret this result as the selective destruction of the smallest grains by the hard radiation from the central active galactic nucleus.
keywords:
infrared: galaxies – galaxies: ISM – dust, extinction – galaxies individual (NGC1097)Frédéric Galliano
1 INTRODUCTION: UNDERSTANDING INTERSTELLAR DUST EVOLUTION
The knowledge of the properties of interstellar dust grains and their variations throughout different environments is a crucial challenge in modern astrophysics (Draine, 2003; Jones et al., 2017; Galliano et al., 2018, for reviews). A lack of precise understanding of these properties and their evolution currently hampers our ability to properly unredden UV-to-mid-IR observations. In addition, such a knowledge could provide invaluable diagnostic tools of deeply embedded regions. It could also refine the prescriptions of dust-dependent physical processes that are used in photodissociation models (e.g. Le Petit et al., 2006), such as the photoelectric heating (e.g. Kimura, 2016) or the H2 formation rate on grains (e.g. Bron et al., 2014).
Among the dust observables, Unidentified Infrared Bands (UIB) are very informative features. In comparison, the thermal dust continuum emission constitutes a rather degenerate tracer, as it does not contain unambiguous information on the composition of its carriers. The UIBs are emitted by vibrational modes in a hydrocarbon species. The most consensual carriers of these bands are Polycyclic Aromatic Hydrocarbons (PAH; Tielens, 2008, for a review). However, partially hydrogenated amorphous carbons are also serious candidates (a-C(:H); e.g. Jones et al., 2017).
Numerous studies have attempted to understand the origin of the variations of the UIB spectra in galaxies (e.g. Hony et al., 2001; Vermeij et al., 2002; Smith et al., 2007; Galliano et al., 2008; Lebouteiller et al., 2011; Mori et al., 2012; Whelan et al., 2013). Despite several breakthroughs, these studies were mostly limited to a sub-sample of the UIBs, due to the spectral coverage of the observations. In particular, the feature (Figure 1; right) has not been as extensively studied as it could be. As we will demonstrate it in this paper, the addition of this feature can remove some degeneracies in the interpretation of the process at the origin of the variation of the UIB spectrum.
2 AKARI AND SPITZER MID-IR SPECTRA OF NGC 1097
2.1 The EMPIRE Sample
We have initiated a study extending the common wavelength coverage to the full UIB spetrum, by combining Spitzer/IRS () and AKARI/IRC (down to ) spectra of the same regions. As part of our EMPIRE project (Evolution of Molecular gas and Pahs in Interstellar REgions), we have built a catalog of 160 nearby galaxies, observed with AKARI IRC slit mode. It includes M 51, M 82, M 83, M 87, Cen A, IC 10, NGC 253, among others. of these observations overlap with Spitzer IRS footprints. At least 20 galaxies in our sample have been well spatially resolved by both AKARI/IRC and Spitzer/IRS. of the sources also have overlap with Herschel/PACS observations.
2.2 Spectral Cubes of NGC 1097
 |
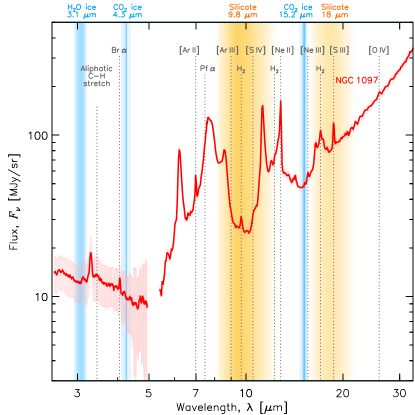 |
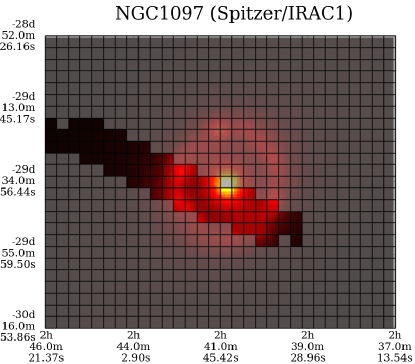
The present paper focuses on one source of the EMPIRE catalog, the starburst galaxy NGC 1097. It is a Seyfert 1 galaxy of SB(s)b type with a distance of 19.1 Mpc (Willick et al., 1997). Its mid-IR morphology (Figure 1; left) exhibits a circumnuclear star forming ring, and a central active galactic nucleus (AGN). The Spitzer/IRS spectrum of NGC 1097 has been studied by Smith et al. (2007) and Beirão et al. (2012), and its AKARI/IRC spectrum by Kondo et al. (2012). The integrated mid-IR spectrum of the overalp or IRC and IRS footprints is shown in Figure 1 (right). All the main UIBs, between 3 and 20 , are well detected, as well as several molecular Hydrogen and ionic lines. The steeply rising continuum in the 20-30 range, likely coming from hot equilibrium grains in compact H ii regions, is a sign of sustained star formation activity.
3 BAND RATIO VARIATIONS AS A SIGN OF GRAIN EVOLUTION
3.1 Observed Band Ratio Correlations
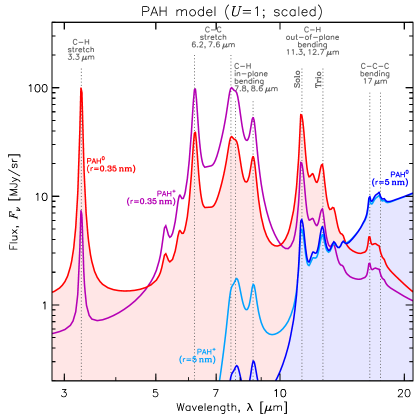
We have performed a decomposition of the spectrum of each pixel, in order to extract the intensity of the main features. The observed relation between select band ratios provides qualitative insights on the physical process driving the intensity variations. The top-left panel of Figure 2 shows the classic PAH7.7/PAH11.3 ratio as a function of PAH6.2/PAH11.3. We can see, on the bottom-right panel of Figure 2, that if only the PAH ionization fraction varies, then these two ratios should be perfectly correlated. Indeed, the top-left panel of Figure 2 shows strong correlation of these ratios, with a factor of in dynamical range. However, this correlation plot is degenerate with other effects, such as the variation of the size distribution.
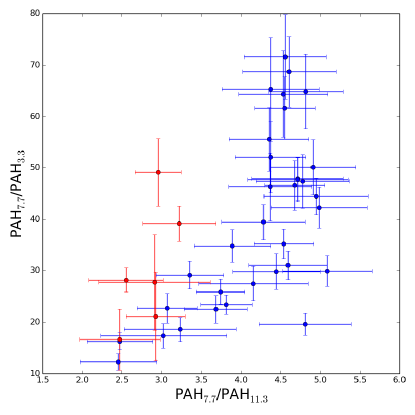
As stated in Section 1, the feature is a good size indicator. We can see, on the bottom-right panel of Figure 2, that the to feature ratio is higher for PAH mixtures with a smaller average size. The top-right panel of Figure 2 shows the same PAH3.3/PAH11.3 ratio as a function of PAH7.7/PAH3.3. If the charge state was the only factor, these two ratios should be perfectly anticorrelated, which is not the case.
3.2 Interpretation in Terms on Environmental Variations
In the two top panels of Figure 2, we have highlighted in red the pixels corresponding to the central region. These pixels stand out in the top right plot. We have investigated the nature of these pixels, in the bottom-left plot of Figure 2, by comparing the UIB intensity to the [Ne iii]/[Ne ii] ratio. The [Ne iii]/[Ne ii] ratio is known to correlate well with the hardness of the radiation field (e.g. Madden et al., 2006). This plot shows a clear segregation between the central region and the rest of the galaxy. The radiation field is harder in the center. Although there appears to be a variation of the mean PAH size throughout the galaxy (as probed by the dynamics of the PAH3.3/PAH11.3 ratio), there is a hint that the central region could harbor larger PAHs, as PAH3.3/PAH11.3 is lower than average. This can be easily understood in terms of the selective destruction of the smallest PAHs by the hard radiation field bathing the central region. Such a selective destruction process was previously discussed by Smith et al. (2007) and Sales et al. (2010), comparing integrated spectra of galaxies. Our present data brings new evidence of this effect, within a spatially resolved object.
 |
 |
 |
 |
4 SUMMARY AND PROSPECTIVES
We have presented preliminary results of a study scrutinizing the variations of the UIBs in the starburst galaxy NGC 1097. The originality of our approach consists in combining AKARI/IRC and Spitzer/IRS spectra, in order to probe the full spectral range covered by UIB features. We find evidence that the smallest PAHs are destroyed by the hard radiation field in the central regions.
This study is part of a larger project including nearby resolved galaxies. The comparison of the UIB ratio trends between objects will provide stronger constraints on the origin of the processes controlling the UIB spectrum. It might also provide constraints allowing us to favor one of the candidate carriers (PAH, a-C(:H), etc.). From a methodological point of view, we plan to implement a more rigorous, Bayesian, spectral decomposition method, in order to better characterize the spread of the trends. Finally, this study is a good test case for the JWST (launch in 2019).
Acknowledgments
We ackowledge support from the PRC 1311 between France (CNRS) and Japan (JSPS). R.W. and F.G. acknowledge support by the Agence Nationale pour la Recherche through the program SYMPATICO (Projet ANR-11-BS56-0023). F.G. acknowledges support from the EU FP7 project DustPedia (Grant No. 606847).
References
- Beirão et al. (2012) Beirão, P., Armus, L., Helou, G., et al. 2012, ApJ, 751, 144
- Bron et al. (2014) Bron, E., Le Bourlot, J., & Le Petit, F. 2014, A&A, 569, A100
- Draine (2003) Draine, B. T. 2003, ARA&A, 41, 241
- Draine & Li (2007) Draine, B. T. & Li, A. 2007, ApJ, 657, 810
- Galliano et al. (2018) Galliano, F., Galametz, M., & Jones, A. P. 2018, ARA&A, arXiv:1711:07434
- Galliano et al. (2008) Galliano, F., Madden, S. C., Tielens, A. G. G. M., Peeters, E., & Jones, A. P. 2008, ApJ, 679, 310
- Hony et al. (2001) Hony, S., Van Kerckhoven, C., Peeters, E., et al. 2001, A&A, 370, 1030
- Jones et al. (2017) Jones, A. P., Köhler, M., Ysard, N., Bocchio, M., & Verstraete, L. 2017, A&A, 602, A46
- Kimura (2016) Kimura, H. 2016, MNRAS, 459, 2751
- Kondo et al. (2012) Kondo, T., Kaneda, H., Oyabu, S., et al. 2012, ApJ, 751, L18
- Le Petit et al. (2006) Le Petit, F., Nehmé, C., Le Bourlot, J., & Roueff, E. 2006, ApJS, 164, 506
- Lebouteiller et al. (2011) Lebouteiller, V., Bernard-Salas, J., Whelan, D. G., et al. 2011, ApJ, 728, 45
- Madden et al. (2006) Madden, S. C., Galliano, F., Jones, A. P., & Sauvage, M. 2006, A&A, 446, 877
- Mori et al. (2012) Mori, T. I., Sakon, I., Onaka, T., et al. 2012, ApJ, 744, 68
- Sales et al. (2010) Sales, D. A., Pastoriza, M. G., & Riffel, R. 2010, ApJ, 725, 605
- Smith et al. (2007) Smith, J. D. T., Draine, B. T., Dale, D. A., et al. 2007, ApJ, 656, 770
- Tielens (2008) Tielens, A. G. G. M. 2008, ARA&A, 46, 289
- Vermeij et al. (2002) Vermeij, R., Peeters, E., Tielens, A. G. G. M., & van der Hulst, J. M. 2002, A&A, 382, 1042
- Whelan et al. (2013) Whelan, D. G., Lebouteiller, V., Galliano, F., et al. 2013, ApJ, 771, 16
- Willick et al. (1997) Willick, J. A., Courteau, S., Faber, S. M., et al. 1997, ApJS, 109, 333