Antiferromagnetic rare region effect in Pr0.5Ca0.5MnO3
Abstract
We present evidence of coexistence of electron paramagnetic resonance signal and anti-ferromagnetic resonance signals above the antiferromagnetic (AFM) transition () in . We identify the latter with AFM rare regions within the ‘Griffiths-like’ phase scenario with the associated temperature scale T∗ extending above room temperature.
After going through several decades of intense experimental and theoretical scrutiny, there is a general acceptance of certain features which are near universal in mixed-valent manganites Dagotto ; Tokura0 with far reaching implications for complex systems in general Dagotto1 : 1) Prevalence of the nanoscale phase separation; 2) Existence of a higher temperature scale T∗, where short range ‘clustering’ sets in, in addition to the long range ordering temperature. However, the underlying physical model that describes such a scenario and consequently the origin of colossal magnetoresistance (CMR) in manganites is still intensely debated Souza ; Dagotto . At present there are primarily two hypotheses: 1) The existence of Griffiths-like phase with percolation type metal-insulator (MI) transition Salamon ; Krivoruchko1 ; Krivoruchko2 ; 2) Alternatively, that the Griffiths phase (GP) in itself is insufficient to cause CMR, and the formation of ferromagnetic polarons just above the long range ordering temperature needs to be taken into account Souza ; Jiyu ; Ivanshin . However, for low band width systems near half doping, the debate is mainly centered around the following competing pictures of charge ordering Tokura : 1) CE type charge and magnetic ordering, originally proposed by Goodenough Goodenough ; 2) Zener polaron (ZP) ordering with antiferromagnetic interaction between strong ferromagnetically coupled dimers Aladine ; 3) Coexistence of both CE type and ZP type ordering Khomskii or between correlated and uncorrelated polarons Jooss . The last two frameworks have the additional advantage of being able to explain away the emergence of ferroelectricity in charge-ordered manganites Yamauchi ; Khomskii ; Shukla1 ; Shukla2 .
The existence of a phase similar to the Griffiths phase in manganites is confirmed by the following experimental signatures: 1) Presence of a weak, usually ferromagnetic resonance (FMR) signal above TC against the background of an electron paramagnetic resonance signal Deisenhofer1 ; 2) Deviation from typical behavior predicted by the standard theory of second order phase transitions so far as the critical indices in the temperature dependence of the magnetic susceptibility in the paramagnetic region is concerned Krivoruchko1 , 3) The downturn in the inverse susceptibility as compared to the paramagnetic Curie background is suppressed by increasing the magnetic field due to the increased magnetization of the paramagnetic matrix enclosing the rare region.
Quenched disorder is a prerequisite for the formation of the GP, although the physical picture of short-range-correlated disorder creating large scale spin and charge inhomogeneities in manganites is only applicable to a narrow window at low doping and should be absent near half doping Bouzerar . However, recently there have been a few experimental studies which claim existence of GP in half doped systems with intermediate band width Pramanik1 ; Pramanik2 . It has been predicted that the coexistence of two competing phases separated by a first order transition enhances the formation of a ‘Griffiths-like’ clustered phase below a characteristic temperature T∗ Burgy1 . The coexistence of ferromagnetic metallic (FM) and antiferromagnetic (AFM) insulating phase is ubiquitous in manganites soumik1 ; soumik2 with AFM phase dominating close to half doping Brink . Given such a scenario, it is surprising that occurrence of AFM rare regions in manganites has not been reported so far. In this letter, we provide experimental evidence of AFM rare regions in a narrow band width manganite at half doping, namely, Pr0.5Ca0.5MnO3.
Pr1-xCaxMnO3 () in bulk form shows transition from paramagnetic (PM) to AFM phase at low temperature (TN) intermediated by the onset of charge ordering at a higher temperature (). Poly-crystalline Pr1-xCaxMnO3 (PCMO) samples with were prepared by the standard method described elsewhere Shukla1 . The structural characterization of all the samples were done by x-ray diffraction - 2 scans at room temperature using PANalytical X’pert diffractometer with radiation having wavelength of 1.54 Å. The Rietveld refinement analysis done by using full prof suite reveals that the room temperature phase of all the samples has orthorhombic structure having Pbnm space group symmetry. The microstructure, crystallite size and its distribution were studied by field emission scanning electron microscope (FE-SEM, Jeol, JSM-7100F). The chemical composition of all the samples were confirmed by energy dispersive spectroscopy (EDS) and the x-ray photoemission spectroscopy using PHI 5000 Versa Prob II, FEI Inc. See Ref. SM for details of structural and chemical characterization. The magnetic measurements were carried out in a Quantum Design PPMS. The temperature dependent EPR spectroscopy was done done using Bruker EPR EMX spectrometer in the X-band.
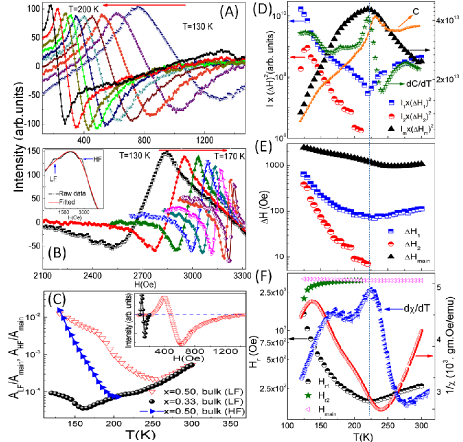
The differential EPR signals were recorded at different temperatures from 120 K up to room temperature for the PCMO samples. The samples were exposed to microwave radiation at constant frequency of 9.46 GHz (X-band) and external magnetic field was varied from 0 to 8000 Gauss. The power (P) absorbed by the sample from the transverse magnetic microwave field is captured in the form of its first derivative (dP/dH) by the standard lock-in technique Poole ; John . Fig. 1A shows the EPR signals of at some representative temperatures between 120-300 K. In general, the line-shape is symmetric Lorentzian. The origin of EPR signals in these systems is generally attributed to the combined effect of and states (which are coupled through double exchange interaction) and the lattice Lofland ; Causa ; Shengelaya1 ; Shengelaya2 . Strikingly, we observe the appearance of a pair of additional resonance peaks as shown in Fig. 1B. It is clear that the low field (LF) and high field (HF) resonance positions approach each other with lowering of temperature (Fig. 1C, D). In order to understand the nature of these resonance peaks and to accurately calculate corresponding intensities, linewidth and resonance fields, we have fitted the ESR signals by the following equation Ivanshin1 ; Liu1 -
| (1) |
where is the resonance field and is the linewidth. The resonance peaks are extracted by subtracting the main PM resonance signal described by the Lorentzian in equation 1 from the raw data. As a result, we obtain two sets of peaks, namely, LF and HF peaks on either side of the positive half maximum (around H2180 Oe) of the main resonance peak (Fig. 2A,B). The intensity, linewidth and resonance fields of LF and HF signals have been calculated by integrating the LF and HF spectra and fitting the integrated signals with Lorentzian line shape function given in the equation 1. The product of intensities and linewidth squared () for the LF and HF spectra and main resonance peak are shown in Fig. 2D. While the for the LF resonance shows a sharp anomaly near K, the signal for HF resonance is not observable beyond K with the corresponding resonance field merging with the paramagnetic backbone. Curiously, the intensity for main resonance shows a maximum again at the same temperature. The temperature dependence of line-width, resonance fields for the three signals along with the temperature derivative of dc susceptibility () in the same temperature range are plotted in Fig. 2E, F. Strikingly, the maximum in , too, appears at K (Fig. 2F). We plot the temperature derivative of total heat capacity (), calculated from the standard literature data Hardy , in Fig. 2D where the global maximum in again appears around K, serving as further evidence of a thermodynamic phase transition. We observe similar resonance signals in the EPR spectra for other PCMO samples (x=0.45,0.4,0.33) as well. However, the signals are weaker compared to that observed in Pr0.5Ca0.5MnO3. For PCMO (x=0.4, bulk), we can precisely determine the temperature dependence of H and intensities only for the LF signal although the Hr values of the LF as well as the HF peaks can be estimated. The temperature dependence of and Hr for the LF peak of PCMO (x=0.40, bulk) and PCMO (x=0.33, bulk) as well as the anomalies observed in the temperature dependence of linewidth are similar to that of the half doped PCMO (Fig. 3). The striking correlation between the temperature dependence of Hr, H and Imax on one hand and the macroscopic dc susceptibility data on the other observed for the half doped system (Fig. 2), is missing away from half doping (Fig. 3E). Moreover, for , the HF signal is completely suppressed.
The coexistence of LF and HF signal in the intermediate temperature regime with the former extending up to the room temperature suggests existence of a complex magnetic phase unlike ever reported before in manganites. To the best of our knowledge, in existing reports on manganites, the number of additional resonance signal observed other than the PM signal is restricted to one and that, too, for low doped systems Deisenhofer1 . We shall take up the issue of emergence of these signals in a more elaborate manner shortly hereafter. Let us, for the moment, turn our attention to the dc susceptibility data above (Fig. 4A). Generally one expects a downturn in the temperature dependence of inverse susceptibility due to the growth of ferromagnetic clusters with lowering of temperature in the Griffiths phase. However we observe that the downturn above is only marginal which is followed by a sharp upturn just below . The marginal downturn above is completely suppressed at slightly higher magnetic field eventually leading to an upward deviation over the paramagnetic Curie background. Prima facie, this suggests existence of AFM rare regions above as the AFM susceptibility for the rare regions should be less than or comparable to the paramagnetic susceptibility such that when they add up, the downturn is not so pronounced as observed in case of FM Griffiths phase. Moreover, it is difficult to envisage a finite FM rare region, since half doped PCMO is known to exhibit electronic phase separation with a spatial distribution of hole concentration only, without introducing any FM phase Brink ; Tomioka .
The identification of the LF and HF signals with AFM cluster phase is supported by the following observations: 1) The coexistence of two symmetrically placed resonances typical of AFM resonance spectra where application of external field increases the effective field of one component while decreasing the same for the other. In the present case, the two resonance fields have opposite temperature dependence (Fig. 1, Fig. 2F); 2) For the LF signal in EPR spectra, the resonance field (Hr) decreases marginally with lowering of temperature with concomitant sharp reduction in LF signal intensity down to K. The corresponding line-width for the LF signal shows a minimum at the same temperature suggesting exchange narrowing effect. 3) Although it is rare to observe AFM resonance signal in the X band, for small clusters, the anisotropy field could be low enough to push the AFM resonance towards the X-band. Indeed, multiple resonance signals, excluding the paramagnetic one in the X-band, have been associated with short range AFM correlations Gareth ; Yang . Below K, a sharp increase in the LF and HF signal intensity is observed (Fig. 2D), which suggests some canting instability in the AFM phase. The effect of canting instability is stronger at low temperature as supported by the gradual reduction in the difference between values in the two spectra with lowering of temperature accompanied by an increase in the linewidth. If we look at the ratio of area under the LF signal to that of the main signal (Fig. 2C), the ratio first slowly decreases with lowering of temperature followed by a significant upturn below TCO, suggesting the growing contribution of the LF signal at the expense of the main PM signal with lowering of temperature in this temperature regime. The HF signal, too, grows at the expense of PM signal, eventually catching up with the LF signal at low temperature. Away from half doping, however, the contribution of LF signal vis--vis PM signal is considerably reduced (Fig. 2C). A rough estimation by comparing LF/HF signals with PM signal gives the fraction of spins contributing to LF signal for half doped PCMO to be 1.3%, whereas the fraction of spins contributing to HF signals is 1.6%. Away from half doping, the corresponding fraction of LF signals to the main signals are estimated to be 0.15% for and 0.05% for , respectively. This is consistent with our observation that rare regions are not dominant away from half doping.
In order to check whether the macroscopic susceptibility is influenced by cluster effects so clearly observed in the EPR spectra, one needs to correlate the temperature dependence of various parameters obtained from the resonance signals with the temperature dependence of macroscopic inverse susceptibility. The marginal downturn in the temperature dependence of inverse susceptibility above TCO is suppressed at higher magnetic field due to the growth of PM signal. Below , the strengthening of the AFM contribution at the expense of the PM signal leads to the upturn in inverse susceptibility. That there is a strengthening of AFM cluster phase is further supported by the fact that the linewidth decreases as temperature is lowered towards K. Interestingly, the first order derivative of inverse susceptibility with respect to the temperature is completely insensitive to the application of magnetic field only at TCO whereas above TCO, shows a local maximum at low field reaffirming the downturn of inverse susceptibility which is progressively suppressed at higher magnetic field (Fig. 4B). Moreover, as discussed earlier, the global maxima in the temperature dependence of and coincide exactly with the sharp anomaly in the LF signal intensity, the minima in and the maximum and minimum in and respectively suggesting strong influence of the AFM rare region on the macroscopic susceptibility and a phase transition at K associated with the rare region. Although the LF and HF signals lie below the PM signal, the LF and HF resonance fields should ideally be compared with the PM signal above T∗ which is outside the temperature range for EPR measurements. Since the HF signal is very close to the PM signal in the same temperature range, it is possible that resonance field for HF signal might actually be higher than that for the PM signal above T∗. There could be an alternative scenario as the total number of AFMR signals might be more than two as observed for orthorhombic symmetry before Yamauchi1 . In that case the two observable AFMR signals can lie below the resonance field for the paramagnetic signal.
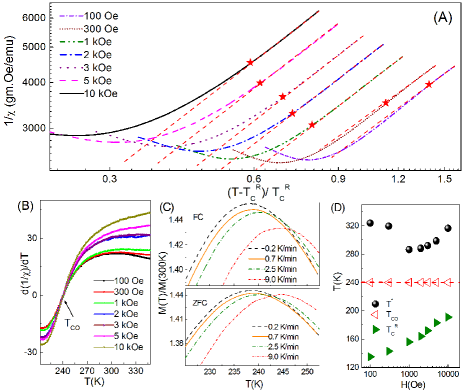
We further analyze the data by fitting the temperature dependence of inverse dc magnetic susceptibility using the relation Griffiths ; Bray1 ; Castro ; Bray2 ; Jiang
| (2) |
where lies between 0 and 1. The temperature below which there is deviation from the Curie-Weiss fit determines the temperature scale for cluster formation as shown in the log-log plots of 1/ against the reduced temperature (T-)/ for different magnetic fields in Fig. 4A. We identify the value of for which the slope (1-) of fitted data above T∗ is unity (i.e. ). Once we obtain the value of , the value of can be extracted from the slope of low temperature side of the data below T∗. However we do not find any distinct power law behavior in that regime. The extracted parameters , TCO and are plotted with respect to the magnetic field in Fig. 4D. While is independent of the magnetic field, the value of T∗ initially decreases at low magnetic field before increasing at higher H.
To distinguish between conventional second order magnetic transition described by the polaron picture and the Griffith’s like scenario, we study the time relaxation of zero field cooled (ZFC) and field cooled (FC) magnetization, since Griffith’s like state is prone to exhibiting out-of-equilibrium features due to anomalously slow relaxation of magnetization Vazquez . The temperature dependence of dc magnetization (FC and ZFC) is shown for different sweep rates ranging from 0.2 K/min to 9.0. K/min in Fig. 4C. With increasing the temperature sweep rate from 0.2 K/min to 9.0 K/min, the magnetic anomaly associated with charge ordering shifts towards higher temperature for both FC and ZFC magnetization. Such sensitivity of FC magnetization to the temperature sweep rate is not expected for a conventional second order magnetic transition. Interestingly, for FM Griffiths phase, we should expect the anomaly to shift to lower temperature with increasing sweep rate Krivoruchko3 ; Krivoruchko4 , exactly opposite to our observation. Although, a theoretical treatment is lacking, we emphasize that such a response could be due to the AFM nature of the rare region.
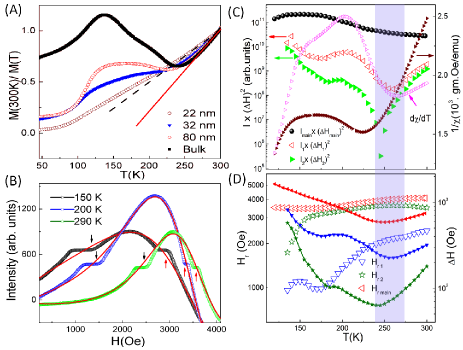
In the end, an important point remains to be addressed. If the LF and HF signals are attributed to the AFM rare region, then one should expect a common temperature range for both, which is clearly not the case for the bulk half-doped PCMO. One possibility is that as the HF signal shifts towards higher resonance field with increasing temperature, it eventually approaches the main resonance asymptotically, thus making it impossible to distinguish between the two. Fig. 5A shows the inverse susceptibility data for poly-crystalline PCMO with different average grain size along with the bulk. Except for the lowest grain size, the magnetic anomaly related to charge ordering survives in all other samples. And indeed, as the average grain size is lowered to 80 nm, we find that both LF and HF signals extend at least up to room temperature (Fig. 5B,C,D). On further reduction of grain size, the additional resonance signals disappear altogether (not shown in Figure). The variation of different parameters extracted from the LF and HF signal is similar to the bulk poly-crystalline sample although the striking correlation with is missing (Fig. 5C,D). The anomalies in , , etc are instead confined within a broad temperature region around the minima in . A comparison of the LF/HF signals and PM signals shows that the fraction of spins contributing to the LF and HF resonances are and , respectively, which are slightly higher than the corresponding bulk sample. The mismatch of the anomalies in the macroscopic susceptibility and the LF/HF signal parameters can be attributed to the increased FM correlation in the main signal due to reduction in grain size Vinay as well as the distribution of the grain size in the nanocrystalline sample.
To conclude, we present direct experimental evidence of AFM rare region effects above TN in half doped narrow band width PCMO with the associated temperature scale extending above room temperature. In a nutshell, the various findings are as follows: 1) Observation of a pair of resonance signals (extending at least up to room temperature) other than the main paramagnetic resonance; 2) Marginal downward deviation at low magnetic field from the Curie background in the inverse susceptibility, which is suppressed at higher magnetic field with showing strong non-monotonic magnetic field dependence; 3) Slow time relaxation in the field cooled magnetization even far above the AFM ordering temperature; 4) Although we fail to ascertain any power law behaviour well below , there is a strong correlation between the temperature evolution of the independently measured AFM resonance signals and the macroscopic susceptibility. It seems highly probable that the physics of AFM rare regions within the Griffiths phase scenario is applicable to other low and intermediate bandwidth manganites near half doping as well, something which needs to be verified experimentally in future.
References
- (1) E. Dagotto, New J. Phys. 7, 67 (2005).
- (2) Y. Tokura, Rep. Prog. Phys. 69, 797 (2006).
- (3) E. Dagotto, Science 309, 257 (2005).
- (4) J. A. Souza, J. J. Neumeier, and Yi-Kuo Yu, Phys. Rev. B 78, 014436 (2008).
- (5) M. B. Salamon, P. Lin, and S. H. Chun, Phys. Rev. lett. 88, 197203 (2002).
- (6) V. N. Krivoruchko, Low Temperature Physics 40, 586 (2014).
- (7) V. N. Krivoruchko and M. A. Marchenko, J. Exp. Theor. Phys. 115, 125 (2012).
- (8) Jiyu Fan, Li Pi, Yan He, Langsheng Ling, Jixia Dai, and Yuheng Zhang, J. Appl. Phys. 101, 123910 (2007).
- (9) V.A. Ivanshin, J. Deisenhofer, H.-A. Krug von Nidda, and A. Loidl, J. Magn. Magn. Mater. 310, 1966 (2007).
- (10) R. A. Ewings, T. G. Perring, O. Sikora, D. L. Abernathy, Y. Tomioka, and Y. Tokura, Phys. Rev. B 94, 014405 (2016).
- (11) J. S. Zhou and J. B. Goodenough, Phys. Rev. B 62, 3834 (2000).
- (12) A. Daoud-Aladine, J. Rodriguez-Carvajal, L. Pinsard-Gaudart, M. T. Fernandez-Diaz, and A. Revcolevschi, Phys. Rev. Lett. 89, 097205 (2002).
- (13) D. V. Efremov, J. Van den Brink, and D. I. Khomskii, Nat. Mater. 3, 853 (2004).
- (14) Ch. Jooss, et al., Proc. Natl. Acad. Sci. 104, 13597 (2007).
- (15) K. Yamauchi, and S. Picozzi, J. Phys. Soc. Jpn. 82, 113703 (2013).
- (16) V. K. Shukla, S. Mukhopadhyay, K. Das, A. Sarma, and I. Das, Phys. Rev. B 90, 245126 (2014).
- (17) V. K. Shukla, and S. Mukhopadhyay, RSC Adv. 6, 93130 (2016).
- (18) J. Deisenhofer, et al., Phys. Rev. Lett. 95, 257202 (2005).
- (19) G. Bouzerar and O. Cepas Phys. Rev. B 76, 020401(R) (2007).
- (20) A. K. Pramanik and A. Banerjee, Phys. Rev. B 81, 024431 (2010).
- (21) A. K. Pramanik and A Banerjee, J. Phys.: Condens. Matter 28, 35LT02 (2016).
- (22) J. Burgy, M. Mayr, V. Martin-Mayor, A. Moreo, and E. Dagotto, Phys. Rev. Lett. 87, 277202 (2001).
- (23) S. Mukhopadhyay and I. Das Europhys. Lett. 83, 27003 (2008).
- (24) S. Mukhopadhyay, I. Das and S. Banerjee J. of Phys.: Condens. Matter 21, 026017 (2008).
- (25) J. van den Brink, G. Khaliullin, and D. Khomskii, Phys. Rev. Lett. 83, 5118 (1999).
- (26) See supplementary material.
- (27) Charles P. Poole, Electron Spin Resonance: A comprehensive treatise on experimental techniques, (Dover, New York, 1983), Ed..
- (28) John A. Weil and James R. Bolton, Electron Paramagnetic Resonance: Elementary theory and Practical applications,(Wiley, New Jersey, 2007), Ed..
- (29) M. T. Causa, et al., Phys. Rev. B 58, 3233 (1998).
- (30) A. Shengelaya, Guo-meng Zhao, H. Keller, and K. A. Muller, Phys. Rev. Lett. 77, 5296 (1996).
- (31) A. Shengelaya, Guo-meng Zhao, H. Keller, K. A. Muller, and B. I. Kochelaev, Phys. Rev. B 61, 5888 (2000).
- (32) S. E. Lofland, et al., Phys. Lett. A 233, 476 (1997).
- (33) V. A. Ivanshin, J. Deisenhofer, H.-A. Krug von Nidda, A. Loidl, A. A. Mukhin, A. M. Balbashov, and M. V. Eremin, Phys. Rev. B 61, 6213 (2000).
- (34) Y. Liu, S.L. Wan, and X.G. Li, J.Phys.:Condens. Matter. 19, 196213 (2007).
- (35) V. Hardy, A. Maignan, S. Hebert, and C. Martin, Phys. Rev. B 67, 024401 (2003).
- (36) Y. Tomioka, A. Asamitsu, H. Kuwahara, and Y. Moritomo, and Y. Tokura Phys. Rev. B 53, R1689 (1996).
- (37) Gareth R. Eaton, Sandra S.Eaton and Kev M. Salikhov, Foundations of Modern EPR, (World Scientific, Singapore, 1998).
- (38) J. Yang, et al., Phys. Rev. B 86, 104410 (2012).
- (39) J. Yamauchi, J. Chem. Phys. 67, 2850 (1977).
- (40) R.B. Griffiths, Phys. Rev. Lett. 23, 17(1969).
- (41) A.J. Bray, Phys. Rev. Lett. 59, 586 (1987).
- (42) A.H. Castro Neto, G. Castilla and B.A. Jones, Phys. Rev. Lett. 81, 3531 (1998).
- (43) A.J. Bray and M.A. Moore, J. Phys. C 15, L765 (1982).
- (44) W. Jiang, X. Zhou, and G. Williams, Euro Phys. Lett. 84, 47009 (2008).
- (45) F. Vazquez, J. A. Bonachela, C. Lopez, and M. A. Munoz Phys. Rev. Lett. 106, 235702 (2011).
- (46) V. N. Krivoruchko, and M. A. Marchenko, J. Magn. Magn. Mater. 412, 30 (2016).
- (47) V. N. Krivoruchko, M. A.Marchenko, and Y. Melikhov, Phys. Rev. B 82, 064419 (2010).
- (48) V. K. Shukla, and S. Mukhopadhyay, J. Appl. Phys. 121, 093901 (2017).