Etymo: A New Discovery Engine for AI Research
Abstract.
We present Etymo (https://etymo.io), a discovery engine to facilitate artificial intelligence (AI) research and development. It aims to help readers navigate a large number of AI-related papers published every week by using a novel form of search that finds relevant papers and displays related papers in a graphical interface. Etymo constructs and maintains an adaptive similarity-based network of research papers as an all-purpose knowledge graph for ranking, recommendation, and visualisation. The network is constantly evolving and can learn from user feedback to adjust itself.
1. Introduction
The rapid growth of global scientific output creates new challenges for information retrieval. The problem is particularly acute in AI (artificial intelligence) research. ArXiv (https://arxiv.og), for example, gains around 500 new AI-related papers every week and the number is growing. As a result, it is difficult for researchers to keep up-to-date with the latest developments in AI research. We have built a new discovery engine for scholarly research called Etymo that addresses this challenge.
Citations of scientific papers are generally considered an important indicator of a paper’s impact (Hirsch, 2005). Google Scholar’s ranking algorithm is not publicly known, but research (Beel and Gipp, 2009) has shown that citation counts have the highest weighting in its ranking algorithm. However, recent publications have few or no citations so it is difficult to use citations to judge the importance of very recent papers; thus, recent insightful publications are difficult to rank. Our idea is to build a similarity-based network and use this information for information retrieval tasks.
How can we obtain links in a non-hypertext setting? Our approach is to infer links from the distributed vector representation of the full-text papers, i.e., if the cosine similarity between the vector representations is large, we link these two papers. It turns out that inferred links are similar to the citation network because papers talking about the same subject tend to cite one another. However, the analogy between hyperlinks and generated links is not perfect. In particular, auto-generated links are a noisier source of information and much more prone to spam.
He et al. (He et al., 2017) proposed a meta-approach called HICODE (HIdden COmmunity DEtection) for discovering the hidden community structure in a network. By removing certain edges from the network (weakening the strength of certain structures), one can uncover other structures in the network. Similarly, we can strengthen and weaken the connectivity of the network structure so as to improve our ranking algorithm and filter out unwanted papers. We do this by exploiting papers’ social media activities (such as the number of retweets on Twitter) and certain information from user feedback. The resulting graph is used for ranking, recommendation, and visualisation. Note also that inferred links can be generated faster than citations (papers may take 1 year to be cited, but inferred links can be generated almost instantly).
We use a combination of PageRank and Reverse PageRank for ranking papers, which we find gives better search results than pure PageRank or HITS (Kleinberg, 1999). In Reverse PageRank, we compute PageRank on the graph with reversed direction, i.e., reverse the direction of each edge to . Fogaras (Fogaras, 2003) shows that Reversed Page Rank scores express hub quality. We have also designed and implemented a new search interface where we display search results as a combination of a list and relationship visualisation. This new interface allows readers to quickly locate relevant and related papers.
Our Etymo discovery engine provides a way to evaluate new research papers by exploiting the full-text of research papers. It challenges the traditional list-based search interface by combining an item list with item relationship visualisation. Etymo updates its database on a daily basis and is free to use for all (demo available at https://etymo.io). Registered users can also write notes and receive recommendations.
2. Related Works
Recently, researchers have realised that the full text of scientific papers is an important resource for search and other applications. Indeed, Salatino et al. (Salatino and Motta, 2016) use the semantic enhanced topic network (where nodes are topics and edges are their co-occurrences in a sample of publications) to identify the appearance of new topics. Sateli et al. (Sateli et al., 2017) analyze full-text research articles to generate semantic user profiles. Semantic Scholar (https://www.semanticscholar.org) 111https://techcrunch.com/2016/11/11/scientists-gain-a-versatile-modern-search-engine-with-the-ai-powered-semantic-scholar/ is a search engine for scholarly research that analyzes and links key information from the full text of research papers for improving search results. Similarly, Etymo makes use of the full text of papers to generate a similarity-based network, which is then used for information retrieval tasks.
3. Architecture Overview
The dependency graph of Etymo is shown in Figure 1. Etymo has several crawlers for downloading research papers from different journal websites. For each paper in our database, we store both the PDF version of the paper and the metadata, including author name, journal name, paper abstract, and the date of publication.
In the Analysis stage, we convert all the PDFs to text using pdftotext 222https://en.wikipedia.org/wiki/Pdftotext. We then apply Doc2Vec (Le and Mikolov, 2014) and TF-IDF (Manning et al., 2008, Chap 6) to represent a document as numeric vectors and respectively. Both algorithms represent a paper by a numeric vector such that papers with similar content are close to each other in the vector space. This content similarity information is then used for building a similarity-based network of all the papers in the database. We generate two networks using the two alorithms and find in practice a combination of the two networks can product better results than just using one of the two. We use t-SNE (Maaten and Hinton, 2008) to find the paper locations and network centrality algorithms for the paper ranking. We also generate a lexicon from the TF-IDF’s global term weights, which is later used in search. The main components of Etymo consist of a search engine and a feed engine. Results from both engines are displayed as a list and graph visualisation.
4. System Features
Etymo has two important features that help it produce useful search results. First, it uses a document vector representation of the full-text papers to build a similarity-based network, where papers are nodes and similar papers are linked. This network is adaptive because of a user feedback mechanism: users’ stars, clicks and Twitter mentions are used to reinforce the ‘correct’ connections and weaken the ‘unimportant’ ones. The resulting network is then used for ranking and recommendation. Second, we have designed and implemented a novel search interface, with results presented both in a traditional item list and with a visualisation showing paper relationships in order to help users quickly find related papers and have a general idea of a research area.
4.1. Similarity-based Network
To construct the similarity-based network, one first needs to represent documents using numeric vectors. We use a distributed representation of the documents called Doc2Vec (Le and Mikolov, 2014) and a bag of words model called TF-IDF. We then construct the similarity-based network using the cosine similarity measure. One potential problem with this similarity-based network approach is that it does not distinguish a high quality paper from a bad one. We argue that we can use user feedback to adjust the network structure in order to give important papers higher weights.
4.1.1. Adaptive Network and Ranking
Each paper is a node in the network and similar papers are linked together. We compute the cosine similarity of every pair of paper vectors in the database. If the cosine similarity score of two papers’ vector representations is larger than a given threshold, we link these two papers. In other words, if and (where in practice) are the vector representation of two papers and , we define
where . If , where is a threshold, we link paper and by an edge with weight .
Calculating the similarity scores of two papers has a time complexity . Adding a new paper when there are already papers in the network therefore costs , which is clearly prohibitive for large . One potential solution is to calculate a new paper’s similarity on a representative subset of the existing papers, i.e., find top high quality papers, where . Since our graph centrality ranking provides a measure of paper quality, we use the top high ranking papers as a representative subset. Then for a new paper, we only calculate its similarity with these papers.
Similarity-based networks are vulnerable to spam. For example, if a paper contains a large number of important key words in AI research, it may have a high connectivity on the network hence a high score in the ranking. We use authors’ votes to adjust the structure of the network in three main ways:
-
(1)
We use user stars to increase the edge weights to a node, this increases the number of edges to that node. In other words, a paper with many user stars connects to more papers than a paper with few.
-
(2)
We use user libraries to infer connectivities: increasing edge weights between the papers in a user’s library.
-
(3)
We weaken the connectivities of a highly ranking paper if it has poor click rates.
Finally, we turn the undirected similarity-based network into a directed network using the temporal information from the paper published date. As a result, a new paper on this network ‘recommends’ a old paper if they have similar content or user data suggests that they are related. Intuitively we attempt to predict the citation network structure of new research papers when their citations are not available.
4.2. Go Beyond List: Relationship Visualisation
A few recent scholar engines incorporate some form of visualisation in displaying their search results. AMiner (https://aminer.org/)(Tang et al., 2008) shows similar authors and the ego network, which consists of a centre node (“ego”) and the nodes to whom the ego node is directly connected to. AceMap (Tan et al., 2016) displays the citation relationships between academic papers on a map, in a similar way to Google Maps. What we do differently is that we provide a combination of the traditional list of results with a content similarity-based relationship visualisation. Figure 2 shows the web interface of Etymo.
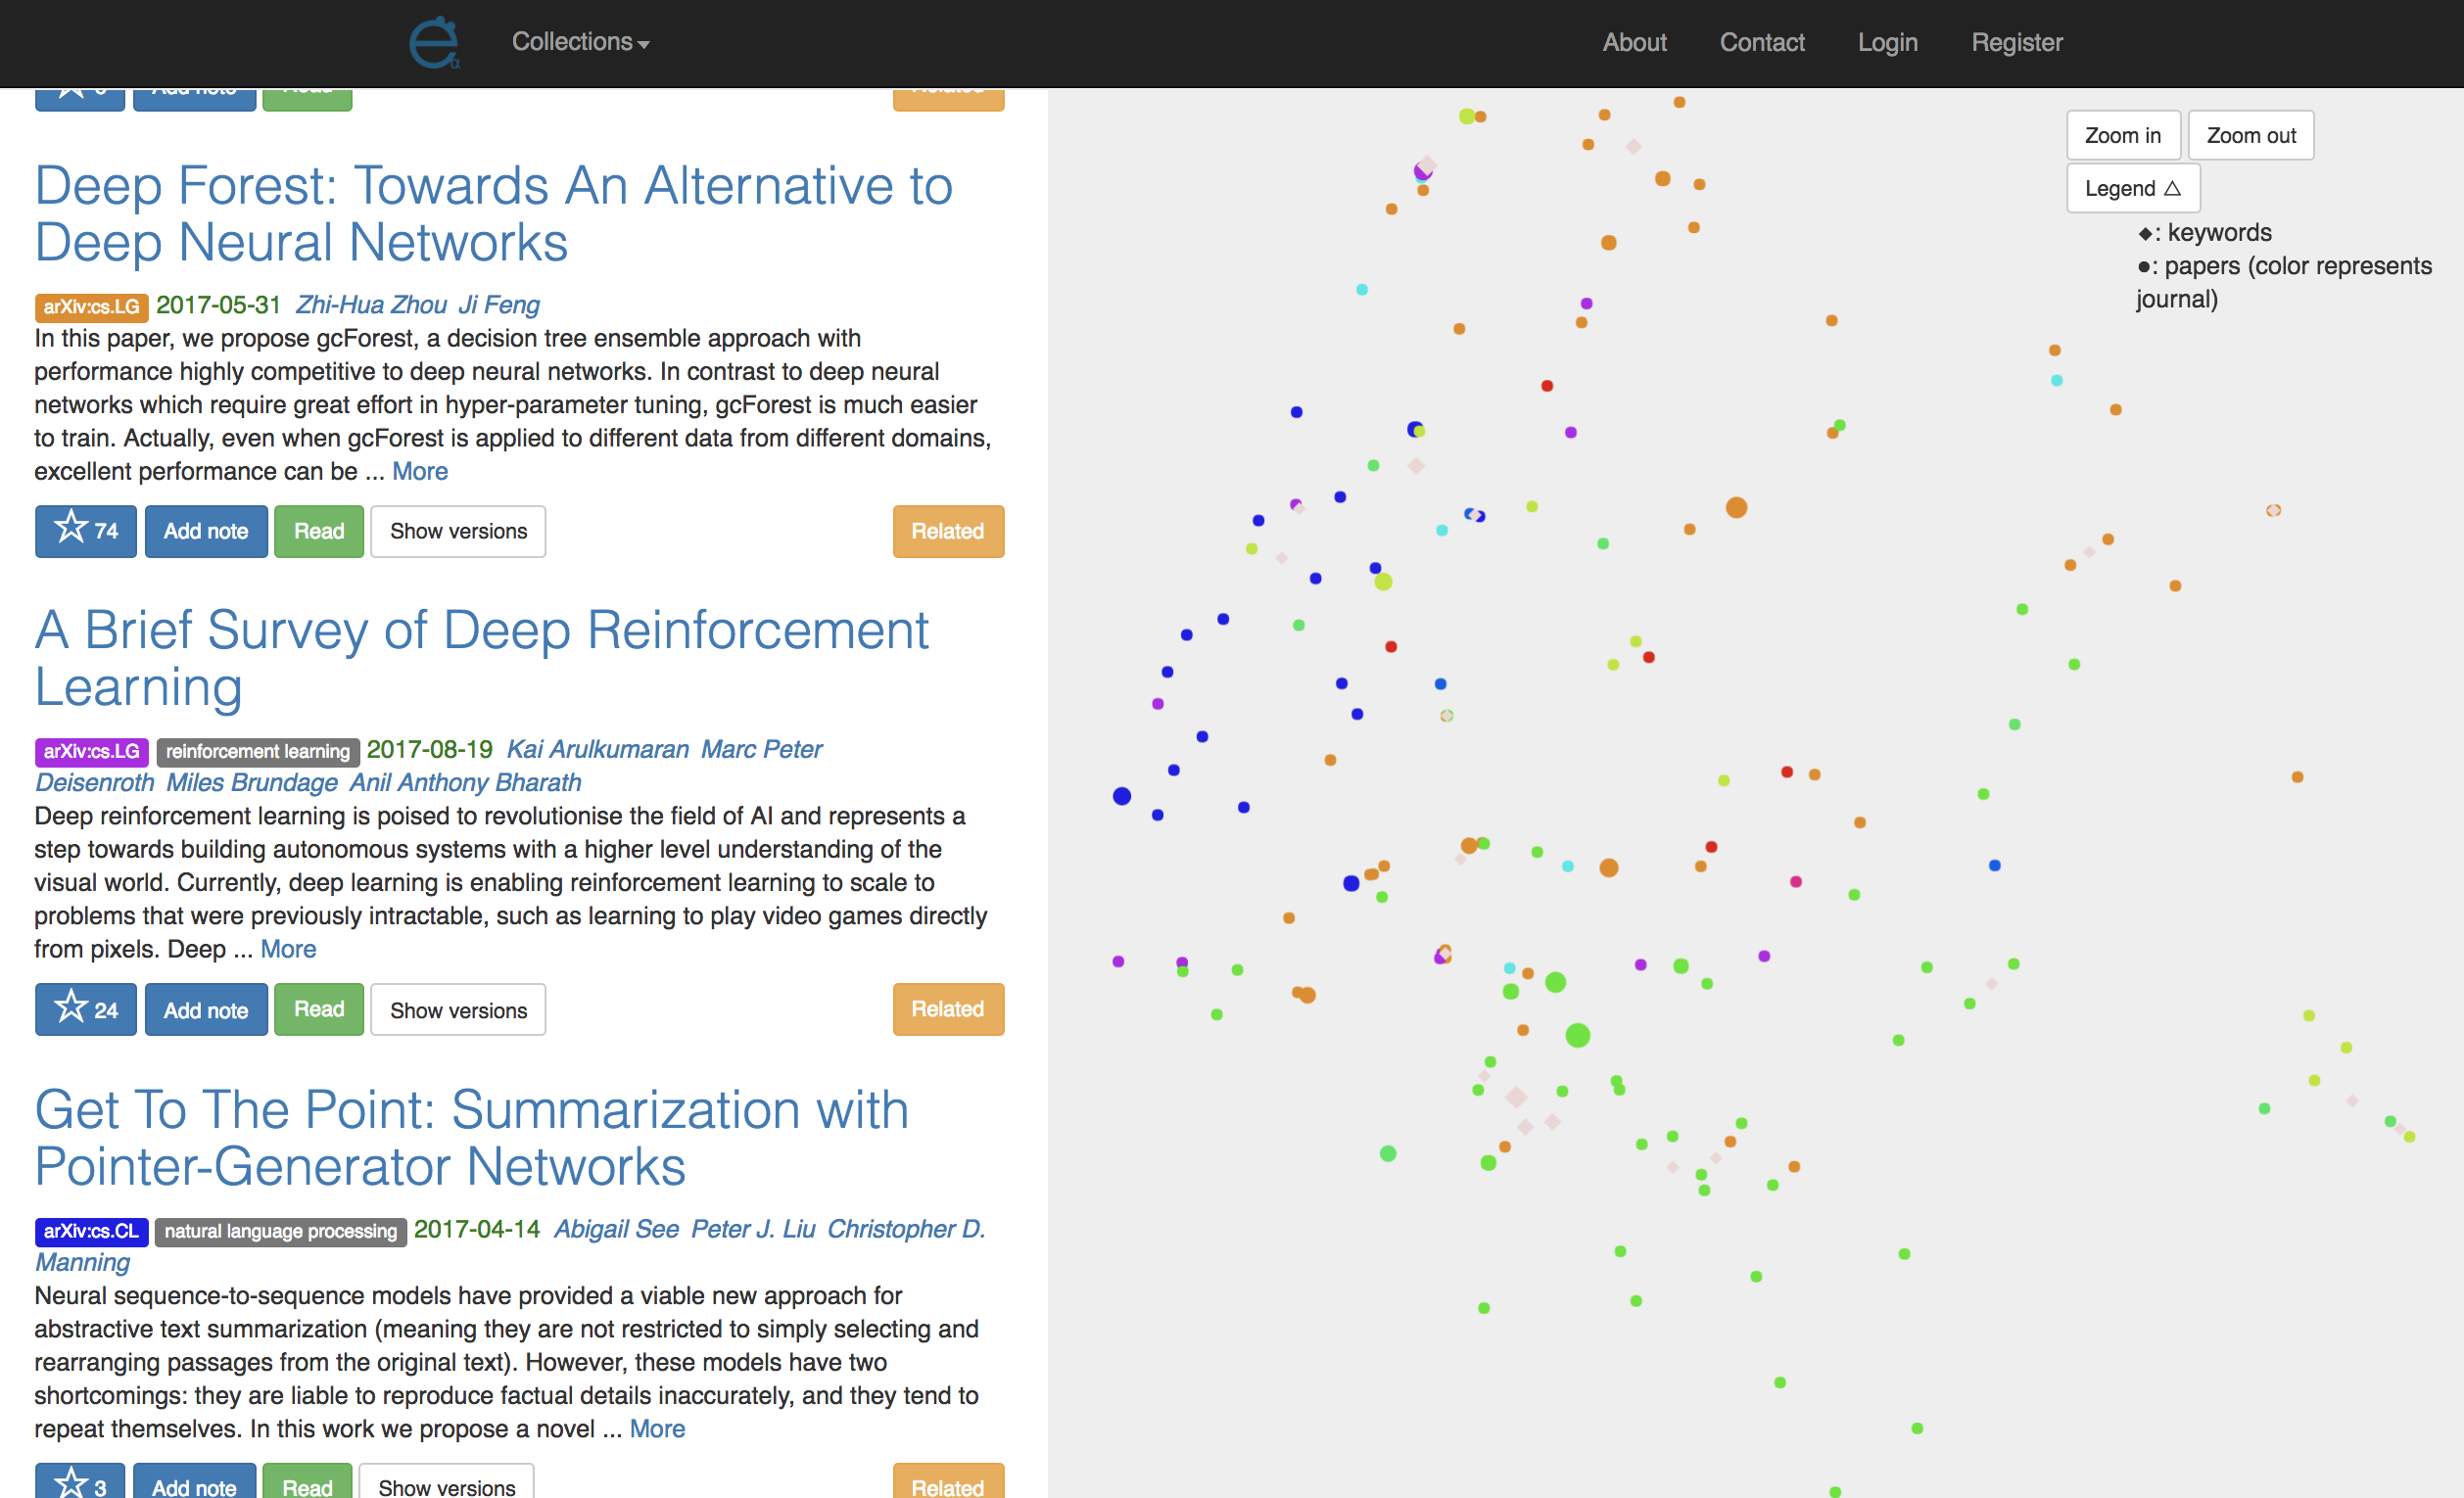
Why do we need a new interface? The most important reason is that it saves our time in finding interesting research papers. The information we usually need is the top ten papers from the search results and the papers related to them, but there is no easy way to access all of that information at once using the traditional list interface. For example, to see related papers of the current search result in Google Scholar, a user needs to click on multiple ’related article’ links. In Etymo, a user can check the top ten rated papers on the list and locate all the related papers on the graph at the same time.
5. Experiments
Etymo has over papers in the database and we typically add new papers every week. The Analysis uses an instance of Amazon Elastic Compute Cloud (Amazon EC2) m4.xlarge, which has vCPUs and GB memory.
We update our database on a daily basis. During each update, we need to first find two sets of vector representations for all the newly added papers using Doc2Vec and TF-IDF. Training of both models are done on a weekly basis. We then use t-SNE to find the x,y location of all the papers, i.e., reduce these dimensional vectors to dimensional vectors. The computation of t-SNE can be done in and requires memory (Van Der Maaten, 2014), which makes it possible to learn embedding of data sets with millions of objects. The number of nodes in our similarity-based network is equal to the number of papers in our database. We apply PageRank and Reverse PageRank on this network. The predominant method for computing the PageRank is the power method. At each iteration, we do a sparse matrix vector multiplication, which has complexity , where is the average number of non-zero elements on every row of the matrix and is the dimension of the matrix. Usually iterations can produce a good approximate ranking (Langville and Meyer, 2011, Chap 8.2).
In general, we found that network-based ratings can improve search results by highlighting historically important papers. For the query “t-sne” (a popular machine learning algorithm for dimensionality reduction) we show the top search results in the tables below. Table 1 shows the results which include the PageRank and Reverse PageRank ratings on the similarity-based network, while Table 2 does not. We noticed that the one with network-based ratings gives more weight to important papers. Note that Maaten and Hinton’s ”Visualizing Data using t-SNE” is the original t-SNE paper. Comparing with Google Scholar’s search results in Table 3, Etymo’s top search results include more recent publications.
| Authors | Year | Title |
|---|---|---|
| Laurens van der Maaten, Geoffrey Hinton | 2008 | Visualizing Data using t-SNE |
| Laurens van der Maaten | 2014 | Accelerating t-SNE using Tree-Based Algorithms |
| Yanshuai Cao, Luyu Wang | 2017 | Automatic Selection of t-SNE Perplexity |
| George C. Linderman, Manas Rachh, Jeremy G. Hoskins, Stefan Steinerberger, Yuval Kluger | 2017 | Efficient Algorithms for t-distributed Stochastic Neighborhood Embedding |
| Yukun Chen, Jianbo Ye, Jia Li | 2017 | Aggregated Wasserstein Metric and State Registration for Hidden Markov Models |
| Authors | Year | Title |
|---|---|---|
| Yanshuai Cao, Luyu Wang | 2017 | Automatic Selection of t-SNE Perplexity |
| Laurens van der Maaten | 2014 | Accelerating t-SNE using Tree-Based Algorithms |
| Maaten, Laurens van der, Hinton, Geoffrey | 2008 | Visualizing Data using t-SNE |
| Richard R. Yang, Mike Borowczak | 2017 | Assessing Retail Employee Risk Through Unsupervised Learning Techniques |
| Martin Renqiang Min, Hongyu Guo, Dinghan Shen | 2017 | Parametric t-Distributed Stochastic Exemplar-centered Embedding |
| Authors | Year | Title |
|---|---|---|
| Maaten, Laurens van der, Hinton, Geoffrey | 2008 | Visualizing Data using t-SNE |
| Laurens van der Maaten | 2014 | Accelerating t-SNE using Tree-Based Algorithms |
| AR Jamieson ML Giger, K Drukker, H Li | 2010 | Exploring nonlinear feature space dimension reduction and data representation in breast CADx with Laplacian eigenmaps and t-SNE |
| K Bunte, S Hasse, M Biehl, T Villmann | 2012 | Stochastic neighbor embedding (SNE) for dimension reduction and visualization using arbitrary divergences |
| Maaten, Laurens van der, Hinton, Geoffrey | 2008 | [PDF] Visualizing Data using t-SNE |
6. Conclusion
It is hard to quantify new things. In research, the value of a newly published work is usually unknown until citations become available. The value of this work is to provide a new approach to improve search results on new papers by exploiting the paper full text content and social media data. Our user interface combines the item list with item relationship visualisation, which saves researchers time in finding interesting research papers.
References
- (1)
- Beel and Gipp (2009) Jöran Beel and Bela Gipp. 2009. Google Scholar’s Ranking Algorithm: An Introductory Overview. In Proceedings of the 12th International Conference on Scientometrics and Informetrics (ISSI’09), Vol. 1. ISSI, Rio de Janeiro (Brazil), 230–241.
- Fogaras (2003) Dániel Fogaras. 2003. Where to start browsing the web?. In International Workshop on Innovative Internet Community Systems. Springer, 65–79.
- He et al. (2017) Kun He, Yingru Li, Sucheta Soundarajan, and John E. Hopcroft. 2017. Hidden Community Detection in Social Networks. (Feb. 2017). https://arxiv.org/abs/1702.07462 ArXiv preprint arXiv:1702.07462.
- Hirsch (2005) Jorge E. Hirsch. 2005. An Index to Quantify An Individual’s Scientific Research Output. Proceedings of the National Academy of Sciences of the United States of America 102, 46 (2005), 16569. https://doi.org/10.1073/pnas.0507655102
- Kleinberg (1999) Jon M. Kleinberg. 1999. Authoritative Sources in a Hyperlinked Environment. J. Assoc. Comput. Mach. 46, 5 (Sept. 1999), 604–632. https://doi.org/10.1145/324133.324140
- Langville and Meyer (2011) Amy N Langville and Carl D Meyer. 2011. Google’s PageRank and beyond: The science of search engine rankings. Princeton University Press.
- Le and Mikolov (2014) Quoc Le and Tomas Mikolov. 2014. Distributed Representations of Sentences and Documents. In Proceedings of the 31st International Conference on Machine Learning (ICML-14). 1188–1196. http://www.jmlr.org/proceedings/papers/v32/le14.pdf
- Maaten and Hinton (2008) Laurens van der Maaten and Geoffrey Hinton. 2008. Visualizing data using t-SNE. Journal of Machine Learning Research 9, Nov (2008), 2579–2605.
- Manning et al. (2008) Christopher D. Manning, Prabhakar Raghavan, and Hinrich Schutze. 2008. Introduction to Information Retrieval. Cambridge University Press, Cambridge.
- Salatino and Motta (2016) Angelo Antonio Salatino and Enrico Motta. 2016. Detection of Embryonic Research Topics by Analysing Semantic Topic Networks. In International Workshop on Semantic, Analytics, Visualization. Springer, 131–146.
- Sateli et al. (2017) Bahar Sateli, Felicitas Löffler, Birgitta König-Ries, and René Witte. 2017. ScholarLens: Extracting Competences from Research Publications for the Automatic Generation of Semantic User Profiles. PeerJ Computer Science 3 (July 2017), e121. https://doi.org/10.7717/peerj-cs.121
- Tan et al. (2016) Zhaowei Tan, Changfeng Liu, Yuning Mao, Yunqi Guo, Jiaming Shen, and Xinbing Wang. 2016. AceMap: A Novel Approach Towards Displaying Relationship Among Academic Literatures. In Proceedings of the 25th International Conference Companion on World Wide Web (WWW ’16 Companion). International World Wide Web Conferences Steering Committee, Republic and Canton of Geneva, Switzerland, 437–442. https://doi.org/10.1145/2872518.2890514
- Tang et al. (2008) Jie Tang, Jing Zhang, Limin Yao, Juanzi Li, Li Zhang, and Zhong Su. 2008. Arnetminer: extraction and mining of academic social networks. In Proceedings of the 14th ACM SIGKDD international conference on Knowledge discovery and data mining. ACM, 990–998.
- Van Der Maaten (2014) Laurens Van Der Maaten. 2014. Accelerating t-SNE using tree-based algorithms. Journal of machine learning research 15, 1 (2014), 3221–3245.