Cool DZ white dwarfs II: Compositions and evolution of old remnant planetary systems
Abstract
In a previous study, we analysed the spectra of 230 cool ( K) white dwarfs exhibiting strong metal contamination, measuring abundances for Ca, Mg, Fe and in some cases Na, Cr, Ti, or Ni. Here we interpret these abundances in terms of the accretion of debris from extrasolar planetesimals, and infer parent body compositions ranging from crust-like (rich in Ca and Ti) to core-like (rich in Fe and Ni). In particular, two white dwarfs, SDSS J08230546 and SDSS J07413146, which show dex, and Fe to Ni ratios similar to the bulk Earth, have accreted by far the most core-like exoplanetesimals discovered to date. With cooling ages in the range 1–8 Gyr, these white dwarfs are among the oldest stellar remnants in the Milky Way, making it possible to probe the long-term evolution of their ancient planetary systems. From the decrease in maximum abundances as a function of cooling age, we find evidence that the arrival rate of material on to the white dwarfs decreases by 3 orders of magnitude over a Gyr span in white dwarf cooling ages, indicating that the mass-reservoirs of post-main sequence planetary systems are depleted on a Gyr e-folding time-scale. Finally, we find that two white dwarfs in our sample are members of wide binaries, and both exhibit atypically high abundances, thus providing strong evidence that distant binary companions can dynamically perturb white dwarf planetary systems.
keywords:
(stars:) white dwarfs – planets and satellites: composition – (stars:) atmospheres – (stars:) abundances1 Introduction
Over the last two decades the study of extrasolar planetary systems has revealed that worlds around other stars exhibit an unexpected level of diversity, including system architecture, masses, and orbital parameters. Using the method of transmission spectroscopy, it is now also possible to explore the chemistry of exoplanet atmospheres. These have been found to contain atomic (e.g. Charbonneau et al., 2002) and molecular species (Swain et al., 2008), including multiple detections of water, e.g. Kreidberg et al. (2014b), and in some cases clouds (Kreidberg et al., 2014a). However, at the present, the study of bulk exoplanetary properties is mostly limited to measuring their masses and radii, and hence their bulk density. Exoplanet structures and compositions based on the comparison of these measurements with planet formation models, (e.g. Lissauer et al., 2011) are subject to two sources of uncertainty. Firstly, mass and radius measurement errors are typically large, and secondly the internal make-up of planets is degenerate with respect to their bulk densities (Rogers & Seager, 2010). While mass/radius measurements do not directly yield information on internal chemistry, they can be used for the broad classification of exoplanets. However, during the last two decades it has become apparent that white dwarfs can be employed as more direct probes of exoplanetary material compositions (Zuckerman et al., 2007), which we outline throughout the remainder of this introduction.
All known main-sequence exoplanet-hosts have masses well below 8 (NASA exoplanets archive, accessed 22/02/2018) and are thus destined to become white dwarfs. While any close-in (1 au) planetary bodies will be engulfed on the giant branch during the post-main sequence evolution of their host star, a large fraction of the outer planetary system will survive (Burleigh et al., 2002; Debes & Sigurdsson, 2002), albeit on wider orbits due to stellar mass-loss. This scenario has been considered for the Solar system (Sackmann et al., 1993; Duncan & Lissauer, 1998), with engulfment expected to occur for objects out to au (Schröder & Connon Smith, 2008). Mars, the asteroid belt, the gas planets, and the Kuiper belt will continue in their motion around the white dwarf Sun, but with their semi-major axes approximately doubled. Furthermore, Duncan & Lissauer (1998) found that surviving terrestrial planets and gas giants will remain stable for Gyr and Gyr respectively. Full-lifetime simulations of multi-planet systems indicate that exoplanets can remain on bound orbits for Gyr after joining the white dwarf cooling-track (Veras et al., 2016).
During the long-lasting evolution along the white dwarf cooling track, the reduced dynamical stability can cause bodies on previously stable orbits to be scattered (Debes & Sigurdsson, 2002), where the least massive bodies such as minor planets or asteroids are most susceptible. A planetesimal whose orbit is severely perturbed can be ejected from the system, but in some cases its periastron may instead venture sufficiently close to the white dwarf that tidal forces will be capable of disrupting it (Jura, 2003; Veras et al., 2014).
Circularisation of the resulting dust forms a circumstellar debris disc. Such a disc was first observed at the white dwarf G 29-38 (Zuckerman & Becklin, 1987; Graham et al., 1990) via the detection of an infra-red excess of flux. Since this discovery, discs have been observed at more than forty other white dwarfs (Kilic et al., 2005; Becklin et al., 2005; Gänsicke et al., 2006; von Hippel et al., 2007; Jura et al., 2007; Farihi et al., 2008; Farihi, 2009; Brinkworth et al., 2009; Farihi et al., 2010b; Melis et al., 2010; Debes et al., 2011; Kilic et al., 2012; Farihi et al., 2012; Brinkworth et al., 2012; Bergfors et al., 2014; Rocchetto et al., 2015; Dennihy et al., 2016; Barber et al., 2016). Within the disc, dust grains lose angular-momentum through a variety of mechanisms including the Poynting-Robertson and YORP effects (Rafikov, 2011; Veras et al., 2015) and are eventually sublimated and subsequently accreted onto the white dwarf, resulting in the appearance of metal lines in the stellar spectrum (Jura, 2003; Debes et al., 2012)111Historically, metals in the atmospheres of some white dwarfs were attributed to accretion from the interstellar-medium (ISM) (Wesemael, 1979; Aannestad & Sion, 1985). However, the ISM hypothesis suffered from two major inconsistencies. Firstly, the hydrogen-rich composition of the ISM (Wilson & Matteucci, 1992) was at odds with the existence of metal-polluted white dwarfs with hydrogen deficient, but helium dominated atmospheres (Dupuis et al., 1993; Friedrich et al., 2004). Secondly, in their study of the kinematic history of 15 metal-polluted white dwarfs, Aannestad et al. (1993) found no correlation between atmospheric metals and dense regions of the ISM (see also Farihi et al., 2010a). Accretion of metals from remnants of planetary systems (Jura, 2003; Debes et al., 2012) naturally resolved these issues.. Because white dwarfs possess extremely high surface gravities (), these heavy elements sink below the atmosphere on short timescales compared with the white dwarf age (Schatzman, 1947; Paquette et al., 1986; Koester, 2009), reverting the stellar atmosphere to pure hydrogen or helium. Thus observations of white dwarfs exhibiting metal lines in their photospheric spectra imply ongoing or recent accretion from tidally disrupted planetesimals.
The most direct confirmation of the remnant planetary system framework has been the detection of periodic transits in the light curve of WD1145+017 that vary in depth, blocking at times up to 60 per cent of the light of the star (Vanderburg et al., 2015; Gänsicke et al., 2016; Gary et al., 2017), caused by gas and dust from the breakup of an exoplanetesimal orbiting near the Roche limit. WD 1145+017 also shows both an infra-red excess characteristic of a dust disc, as well as metallic lines in its spectrum demonstrating a photosphere contaminated with rocky debris (Xu et al., 2016; Redfield et al., 2017). While only one transiting system and tens of circumstellar debris discs are known at present, metal contamination of varying degrees is observed at more than 25 percent of white dwarfs (Zuckerman et al., 2003; Koester et al., 2014), and thus white dwarf spectroscopy is the most observationally accesible method used to identify and study remnant planetary systems.
Following the first detailed study convincingly arguing that white dwarfs with metal lines have accreted debris from their remnant planetary systems (Jura, 2003), it was soon realised that spectral analysis of a white dwarf, which yields atmospheric abundances, could be used to infer the composition of the accreted parent bodies. The first anaylsis of this nature was performed by Zuckerman et al. (2007) in their study of the metal-rich atmosphere of GD 362. Since then many metal-polluted white dwarfs have been analysed by a number of authors in order to infer the compositions of the disrupted parent bodies (Koester, 2009; Klein et al., 2010; Zuckerman et al., 2010; Melis et al., 2011; Koester et al., 2011; Klein et al., 2011; Gänsicke et al., 2012; Dufour et al., 2012; Jura et al., 2012; Xu et al., 2013; Vennes & Kawka, 2013; Farihi et al., 2013). In some cases the derived abundances are consistent with the accretion of material from planetesimals having undergone differentiation, with lithospheric or core-like compositions (Zuckerman et al., 2011; Wilson et al., 2015; Kawka & Vennes, 2016). At the two white dwarfs GD 61 and SDSS J124231.07522626.6 the photospheric abundances suggest that the accreted material is extremely oxygen rich in comparison to the other metals, significantly exceeding the abundance expected from the accretion of metal oxides only (Farihi et al., 2011; Farihi et al., 2013; Raddi et al., 2015). The most plausible explanation for the detected oxygen excesses are high water fractions in the disrupted planetesimals, much like the large Solar system asteroid Ceres. Until recently all metal-polluted white dwarfs have shown abundance-patterns consistent with an origin from within the snow line. However, Xu et al. (2017) recently demonstrated that WD 1425+540 has an atmosphere enriched in the volatile elements C, N, and S, and an abundance pattern that is overall consistent with a Kuiper-belt like object. In summary, the planetary systems around stellar remnants are found to be as diverse as those around main-sequence stars, including our own Solar system222Recent review articles on the planetary systems of white dwarfs by Jura & Young (2014), Farihi (2016), and Veras (2016) provide thorough introductions to the field..
These detailed studies of individual white dwarfs have been instrumental in increasing our understanding of the formation and evolution of exoplanetary systems. To date, there have been only limited attempts at the abundance analysis of large samples of metal-rich white dwarfs, which have been typically restricted to the measurement of Ca abundances (Koester et al., 2005; Dufour et al., 2007; Kepler et al., 2015, 2016).
In Hollands et al. (2017) (hereafter Paper I), we presented a large sample of 231 cool white dwarfs with strong metal lines where a full abundance analysis was performed for each object. In Paper I, we gave particular emphasis to our methods developed to identify these cool white dwarfs, their atmospheric analysis, and some global properties of our sample. Here we further investigate the detailed bulk compositions of the accreted planetesimals derived in Paper I and discuss the evolution of planetary systems far beyond the main-sequence. In Section 2, we briefly describe our white dwarfs sample. In Section 3, we present our compositional analysis of exoplanetesimals, and discuss in detail a few unique systems in Section 4. Section 5 makes use of the wide range of white dwarf ages to investigate the evolution of remnant planetary systems. Finally, we present our conclusions in Section 6.
2 The DZ white dwarf sample
DZ white dwarfs are characterised by having only metal lines in their spectra (Sion et al., 1983). Most known DZ stars have atmospheres dominated by helium, as helium lines become negligible below K, and as the low opacity of helium results in metal lines that are both deep and broad even at low abundances of dex. In hydrogen-dominated atmospheres with K the Balmer also lines vanish, and, if contaminated by metals, they too may be classed as DZs. In practice these are rarely observed, as the higher opacity of hydrogen atmospheres requires larger metal abundances to form detectable spectral lines. Regardless of background element, DZ white dwarfs are cool objects by definition. Because white dwarf cooling is relatively well understood (Fontaine et al., 2001; Salaris, 2009), their effective temperatures can be used to estimate the white dwarf ages.
In Paper I, we identified 231 DZ white dwarfs, primarily making use of the spectroscopy available in DR12 of the Sloan Digital Sky Survey (SDSS) (York et al., 2000; Alam et al., 2015). All objects in this sample exhibit strong metallic features in their spectra with spanning 4500 to 9000 K. The relation between and white dwarf age is non-linear with these corresponding to cooling ages of – Gyr. This sample offers a unique opportunity to investigate remnant planetary systems for a wide range of system ages, from Gyr up to nearly the age of the Galactic disc, providing insight into the late-time evolution of planetary systems.
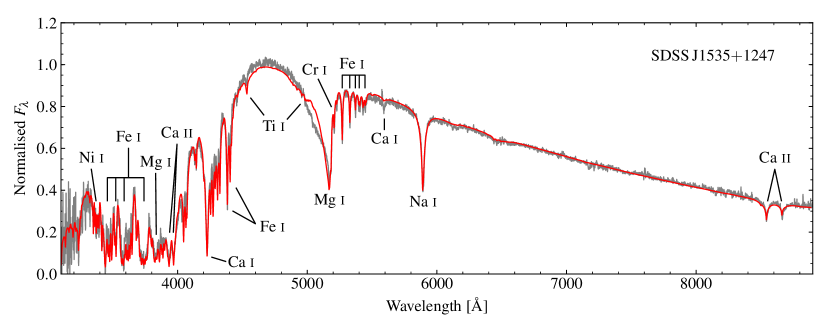
In Fig. 1 we show the spectrum of the DZ white dwarf SDSS J15351247 with the major metal transitions labelled (see Paper I, Table 3 for the full precision SDSS names). As the closest member of our sample to the Sun ( pc, Paper I), it is sufficiently bright to allow the detection of lines from all elements we encounter across the entire sample. The strongest features in the DZ spectra are almost always the Ca ii H+K resonance lines which are visible over the full range of in our sample. Ca is therefore the most reliably measured element with abundances spanning to dex. Other strong Ca features include the 4227 Å Ca i resonance line, and the infra-red Ca ii triplet (although its bluest component is rarely strong enough to be visible). The next most easily detected elements are Mg and Fe, whose lines have lower oscillator strengths, but are typically dex higher in abundance than for Ca. Fe is constrained mostly by a forest of unresolved lines in the 3400–3900 Å region, but also by multiplets near 4400 Å and 5400 Å. The Mg i-b triplet, centred on Å, is the most prominent Mg feature, especially because of its asymmetric profile which results from a satellite line formed in high density helium atmospheres (Allard et al. 2016, Paper I). For 101 stars in our sample, Na is detected via the D-doublet centred on 5893 Å, although the two components are unresolved in our spectra due to pressure broadening by the Stark effect and neutral He atoms. Cr and Ti are detected in only 60 and 27 systems respectively due to their typically low mass fractions within the accreted material. Finally, Ni is only detected for eight objects where we have William Herschel Telescope (WHT) follow-up spectra333A full description of our WHT spectra and their reduction are given in Paper I.. These WHT observations go as blue as 3100 Å, and reveal, in some cases, a set of Ni lines centred on 3390 Å.
Around 10 percent of our sample have magnetic fields, detected via Zeeman splitting, which if exceeding 1 MG reduce the accuracy of our spectral fits (which use non-magnetic models). These objects are tabulated in Paper I. One of the 231 DZ stars was sufficiently magnetic ( MG) to prohibit a meaningful fit to its spectrum. Thus, the following sections of this paper discuss the remaining 230 systems.
3 Compositions of exoplanetesimals
Relative metal abundances, obtained through spectral fitting, inform us on the bulk compositions of the accreted planetesimals. As described in the previous section, we are able to measure the abundances of multiple elements for 230 white dwarfs, allowing us to probe the composition of a large sample of planetesimals formed many Gyr ago. We were able to estimate Ca, Mg, and Fe abundances for all 230 stars in our sample, providing a common set of elements to work with. Conveniently Ca, Mg, and Fe can be used as tracers of crust-, mantle-, and core-like material respectively. Therefore systems that are overly abundant in one of these elements compared to the mean, can be presumed to have accreted material from (fragments of) differentiated planetesimals.
As mentioned in Section 2, Na, Cr, Ti, and Ni are not detected at every system. However we show, particularly throughout Section 4, that these elements serve as important diagnostics for confirming the nature of material in the most extreme outliers in the Ca/Mg/Fe abundance parameter space.
3.1 Relative diffusion
An important caveat that must be acknowledged before further discussion on parent body compositions, is the relative diffusion of elements. In white dwarfs with radiative atmospheres, i.e. warm DA stars, the sinking time-scales can be as short as days to years. As this is significantly shorter than the estimated duration of an accretion episode ( to yrs, Girven et al. 2012), the assumption of accretion-diffusion equilibrium in the analysis of the accreted debris abundances is fully justified. Diffusion time-scales vary by element with a (non-trivial) dependence on elemental weights, meaning that the atmospheric abundance ratios do not directly represent the composition of the accreted material (Paquette et al., 1986). However, with calculated gravitational settling time-scales in hand, this is simple to correct for (Koester & Wilken, 2006; Koester, 2009).
In contrast, in the cool, dense helium atmospheres of DZs discussed here, the assumption of diffusion-accretion equilibrium does not hold true, as the envelopes of these stars are unstable to convection. The outer convection zones (CVZs) extend deep below the stellar atmosphere, and for the objects under consideration here, contain to of the total white dwarf mass. The material, once accreted into the photosphere, is diluted by convective mixing throughout the envelope, and settles out into the core on the diffusion time-scale at the base of the CVZ. Consequently, the depletion of metals from the photosphere is strongly impeded. For our sample of cool white dwarfs, these diffusion times span several to a few yr (Table 7 of Paper I), comparable to, or longer than the estimated duration of the accretion phase (Girven et al., 2012)444For an intuitive illustration of the very different sinking time-scales in DAs and non-DAs as a function of white dwarf age, see Fig. 1 of Wyatt et al. (2014)..
For the majority of DZs it is likely the case that accretion has ceased by the time we observe them, with spectroscopic metals serving as an indicator of at least one accretion event having occurred in the last few Myr. Optically thick discs with sufficient inclination ought to be detectable around the nearest and brightest DZs. However, so far only one DZ is known to possess an infra-red excess indicative of a dust disc (Bergfors et al., 2014). This suggests that many or most of the objects in our sample are not currently accreting, but merely preserve the remains of former planetesimals in their photospheres for a few Myr.
Once accretion has stopped, elements heavier than helium continue their slow diffusion out of the CVZ, remaining spectroscopically visible for several sinking time-scales. However the differences in diffusion velocity for each element leads to the abundance ratios changing over time. This process is discussed by Koester (2009) in the context of GD 362, which is well demonstrated by their figures 2 and 3.
In the absence of accretion, the rate of change in the abundance ratio between two elements has a simple dependence on their diffusion time-scales. For an element with diffusion time-scale , its atmospheric abundance (with respect to He) proceeds with time, , as
| (1) |
or in logarithmic form (base 10)
| (2) |
If we consider two elements, and , with respective diffusion time-scales, and , manipulation of either equation (1) or (2), leads to the relation
| (3) |
The two important cases we consider for the remainder of this paper are Fe vs. Ca, and Mg vs. Ca. In the first case, we find from our envelope calculations (Paper I) that is usually within percent of , and so effectively remains constant with decreasing , i.e. with increasing time since the end of an accretion episode. In the latter case, we find is typically a factor larger than for the white dwarfs in our sample. Therefore, equation (3) shows that for every one dex decrease in , the value of increases by dex, i.e. a factor four. Kawka & Vennes (2016) present a similar expression to equation (3), although defined in terms of time since the end of accretion rather than one of the absolute abundances as we do here.
3.2 Abundance analysis of Ca, Mg, and Fe
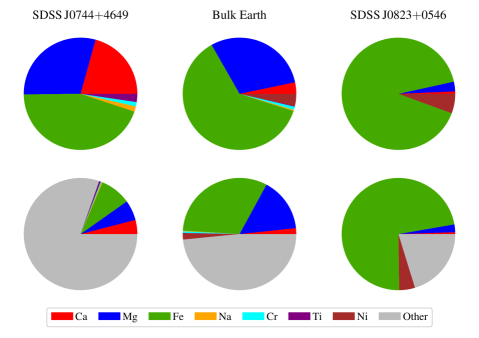
Since it is not possible to know how long ago accretion may have stopped we, at least initially, treat the observed abundances as representative of the parent bodies. For the three elements whose abundances we most reliably measure (Ca, Mg, and Fe), their combined composition has two degrees of freedom, and is thus amenable to being displayed graphically. When dealing with atomic abundances, a typical approach is the comparison of the log-abundance ratios, e.g. vs. . As one element (Mg in the example) appears twice, the resulting distribution is guaranteed to contain a strong correlation, making the positions of chemically intriguing outliers less obvious. For this reason we display our compositions using a ternary diagram in Fig. 2, where we use absolute abundances rather than the logarithmic ratios. Because Ca is typically much less abundant than either Mg or Fe, we rescale Ca by a factor 15 to centre the distribution within the plot (otherwise the data appear compressed within a stripe along the right edge). Our model atmosphere fitting method leads to some minor quantisation which is visually distracting, we therefore initially re-sample the atmospheric abundances with normally distributed deviates with standard deviation 0.01 dex (smaller than the estimated uncertainties which are at best 0.05 dex) to remove this artefact.
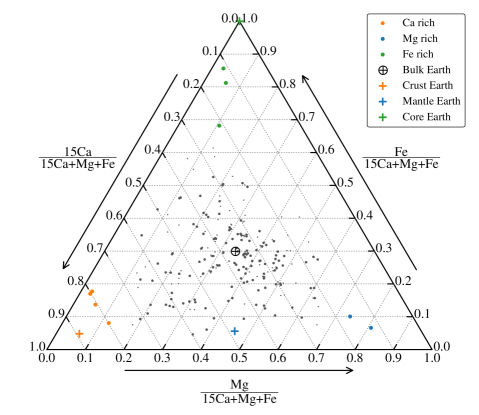
The bulk Earth composition (McDonough, 2000), , is located close to the mean of our sample (, , ). This suggests that Gyr-old exoplanetesimals are overall similar in composition to the bulk Earth as found in the analyses of younger metal-polluted white dwarfs (Klein et al., 2010, 2011; Gänsicke et al., 2012; Xu et al., 2014).
Typical uncertainties for the photospheric abundances measured from fitting the white dwarf spectra are estimated to be in the range – dex. For the poorest quality fits (low signal-to-noise spectra and low abundances), this can translate to large scatter within Fig. 2, with its extent amplified at the centre of the plot. For uncorrelated and identical Ca/Mg/Fe uncertainties, the error in the position in dimensionless plot units is approximately half that of the abundance errors in dex at the centre of the diagram. For example, 0.2 dex uncertainties on Ca/Mg/Fe abundances translates to a positional error of 0.1 at the centre of the figure. Due to the non-linear mapping between abundances and coordinates in the ternary diagram, the positional errors are vastly decreased towards the corners, and therefore systems located in these three regions represent compositionally unusual objects even if their abundance uncertainties are large and statistically independent. As the spectral signal-to-noise ratio is increased, the abundance errors of Ca/Mg/Fe become positively correlated and so the uncertainties in relative abundances, e.g. , become smaller still, translating to positional uncertainties of a few even at the centre of the diagram.
To increase the visual weight of the systems within Fig. 2 with more precise spectral fits, they are displayed by the larger points, with the smaller points corresponding to poorer measurements. We set the threshold for a “good-quality” fit as a median spectral signal-to-noise ratio larger than five, and a geometric mean abundance, defined as , of at least dex.
The most extreme systems found towards the corners of Fig. 2 exhibit atmospheric compositions that are Ca-rich (red), Mg-rich (blue), and Fe-rich (green). As mentioned above, these three elements are convenient proxies for crust-like, mantle-like and core-like material respectively. We therefore also indicate with coloured crosses the abundance ratios of Earth’s continental-crust, mantle, and core. The interior region bounded by these three points represents Ca/Mg/Fe values that can be decomposed into crust/mantle/core fractions assuming Earth-like compositions for each structural layer.
It is apparent from the diagram that such a decomposition is impossible for almost half of the DZ white dwarfs in our sample as they lie exterior to the triangle formed by the Earth’s crust/mantle/core points. However, it is crucial to notice that most of these are clustered towards the Mg-rich corner (particular for values of ). We take this as evidence for Mg enhancement related to relative diffusion as discussed in Section 3.1.
It is therefore clear that for most DZ white dwarfs, the effects of relative diffusion have to be considered when discussing the parent body compositions. The exception to this rule is when the Mg fraction is particularly low, i.e. the extremely Ca-rich and Fe-rich systems highlighted in red and green respectively in Fig. 2.
Ignoring Mg for a moment, we are able to make some statements about the distribution of exoplanetesimal compositions by considering only the Fe to Ca ratio. As described in Section 3.1, our envelope calculations show Ca and Fe to have similar diffusion time-scales. Therefore over the few (no more than about 10) diffusion time-scales that the material can remain visible, the ratio of Fe to Ca changes only by a small amount compared to our measurement errors.
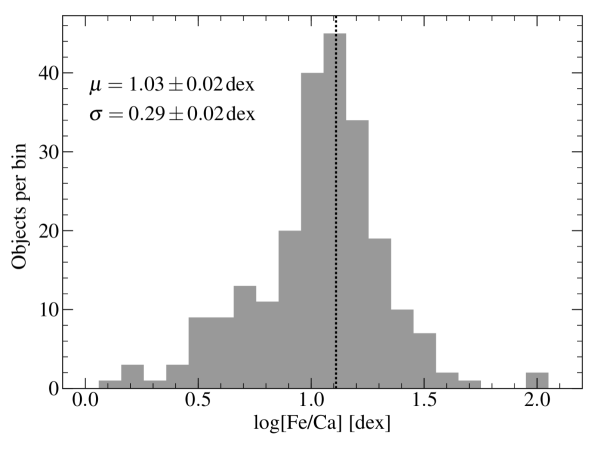
The distribution of spans two orders of magnitude (Fig. 3), and is approximately Gaussian in shape, although with a possible excess of systems in the low Fe/Ca wing. The mean and standard deviation of the distribution are found to be dex and dex respectively, where the errors are estimated from bootstrapping the data.
While it is tempting to interpret this distribution as directly representative of exoplanetesimal compositions, this is unlikely to be true. The wings of the distribution, where the Fe/Ca ratio is most extreme, indicate white dwarfs which have almost certainly accreted material from a single large parent body with an extreme composition. The atmospheric Fe/Ca ratios of white dwarfs located near the centre of the distribution can be explained through several different accretion histories. While accretion of single large asteroids with dex could be true for some of the stars, other possibilities include accretion of multiple smaller asteroids with a bulk Earth composition, or even multiple planetesimals with wildly different compositions which average to a near bulk Earth Fe/Ca value. This means that our observed distribution must be narrower than the true distribution of planetesimal compositions. How much narrower depends not only on the underlying distribution but also on the planetesimal mass distribution (which may itself be a function of ), which will determine how the averaging of compositions from multiple planetesimals is statistically weighted. Nevertheless, the distribution we derive is likely to have a mean close to that of the underlying distribution, which Fig. 3 suggests is close to the bulk Earth ratio Furthermore, the distribution in Fig. 3 highlights the sample size required to detect systems with ratios of dex from the mean.
3.3 Structural interpretation of planetary material
In Fig. 2, we have highlighted several white dwarfs that have accreted material with atypically high Ca- and Fe-rich compositions, which we have qualitatively described as being crust- and core-like, respectively. These descriptions are justified by the proximity to the locations of the Earth’s crust and core within Fig. 2. In Fig. 3 these same objects are found in the bins at both ends of the distribution, spanning two orders of magnitude in their Fe to Ca ratios.
Here we demonstrate that we can be far more quantitative in assessing the crust- and core-like nature of the accreted Ca- and Fe-rich material if we make the assumptions that (1) that rocky planetesimals can generally be described as a mixture, i.e. linear combination, of crust, mantle and core, and (2) the abundances of the Earth’s crust/mantle/core are typical for differentiated planet(esimals). The first assumption is not strictly true if applied to primitive planetesimals, i.e. chondrites, which are homogenous in their composition, lacking the distinct geological layers that result from differentiation. Instead we can consider chondrites as a linear combination of potential crust/mantle/core had they undergone differentiation. The second assumption appears to be justified as none of the stars we analysed indicate planetary debris more Ca-rich than the Earth’s crust nor more Fe-rich than the Earth’s core (Fig. 2).
To apply the above reasoning to the white dwarfs analysed in our sample, we first consider an exoplanetesimal whose total mass is the linear sum of its crust, mantle, and core components, denoted as , , and , respectively (assumption 1). Applying assumption 2, that the atomic compositions of these three geological components are identical to those of the Earth, we then know each of their mass-fractions of Ca, Mg, and Fe. For instance 5.2 percent of Earth’s crust is comprised of Fe, which can be written as a matrix element . Thus the elemental masses , , and for the entire asteroid are calculated via
| (4) |
where, using values obtained from Rudnick & Gao (2003), Palme & O’Neill (2003), and McDonough (2000) for the Earth’s bulk continental crust, mantle, and core respectively, the complete set of matrix elements are
| (5) |
For the interpretation of the debris abundances determined from the spectroscopic analysis of our white dwarf sample, we approach the problem from the opposite direction, i.e. having measured Ca, Mg, and Fe abundances but wishing to determine the relative contributions of the three structural components. Since (5) is a non-degenerate square matrix, this is easily achieved through inversion of equation (4). Note that while equation (4) is defined in terms of masses, mass accretion rates (which are commonly found in the literature for systems assumed to be in accretion/diffusion equilibrium) can equally be used in their place. Since our goal is to determine structural component fractions, this simply means normalising such that they sum to one, and so no specific normalisation of Ca/Mg/Fe is required beforehand. A point worth mentioning is that so far we have been referring to atomic abundances, which is the standard convention in atomic spectroscopy. Here we require mass abundances, and so each of the Ca/Mg/Fe atomic abundances requires rescaling by its atomic mass.
| Name | Crust | Mantle | Core | Ref. |
| SDSS J0741+3146 | 1 | |||
| SDSS J0744+4649 | 1 | |||
| SDSS J0823+0546 | 1 | |||
| SDSS J1033+1809 | 1 | |||
| SDSS J1043+3516 | 1 | |||
| SDSS J1055+3725 | 1 | |||
| SDSS J1351+2645 | 1 | |||
| GD 16 | 2 | |||
| GD 17 | 2 | |||
| GD 40 | 3,4 | |||
| GD 61 | 5 | |||
| SDSS J0738+1835 | 6 | |||
| NLTT 19868 | 7 | |||
| SDSS J0845+2257 | 8 | |||
| PG 1015+161 | 9 | |||
| SDSS J1043+0855 | 10 | |||
| NLTT 25792 | 11 | |||
| WD 1145+017 | 12 | |||
| PG 1225079 | 4 | |||
| SDSS J1228+1040 | 9 | |||
| SDSS J1242+5226 | 13 | |||
| G 14928 | 14 | |||
| WD 1536+520 | 15 | |||
| NLTT 43806 | 14 | |||
| GD 362 | 4 | |||
| GALEX J1931+0117 | 16,17 | |||
| G 2416 | 3,4 | |||
| HS 2253+8023 | 18 | |||
| G 2938 | 19 |
References: (1) This work/Paper I, (2) Gentile Fusillo et al. (2017), (3) Jura et al. (2012), (4) Xu et al. (2013), (5) Farihi et al. (2013), (6) Dufour et al. (2012), (7) Kawka & Vennes (2016), (8) Wilson et al. (2015), (9) Gänsicke et al. (2012), (10) Melis & Dufour (2017), (11) Vennes & Kawka (2013), (12) Xu et al. (2016), (13) Raddi et al. (2015), (14) Zuckerman et al. (2011), (15) Farihi et al. (2016), (16) Vennes et al. (2011), (17) Melis et al. (2011), (18) Klein et al. (2011), (19) Xu et al. (2014).
Because of the effects of relative diffusion on Mg abundances (Section 3.1), we restrict our application of this approach to the seven Ca- and Fe-rich systems in our sample (Fig. 2) where the calculated crust/mantle/core values are largely insensitive to the low Mg fractions. For the other white dwarfs where abundances are strongly affected by relative diffusion, application of equation (4) yields nonsensical negative crust fractions and/or and mantle fractions exceeding 100 percent. We instead complement these seven Ca- and Fe-rich DZ white dwarfs with detailed abundance studies of 22 warmer and younger debris-polluted white dwarfs which are often assumed to be in accretion-diffusion equilibrium. This means their atmospheric abundances can be corrected for the different sinking times of the individual elements and hence the bulk compositions of the parent bodies from the accretion rate of each element. We present the results of our structural decomposition in Table 1 and graphically in Fig. 4. The additional systems were all selected with the requirement that all of Ca, Mg, and Fe had spectroscopic detections with calculated accretion rates. Therefore potentially interesting white dwarfs such as PG 0843+225 (Gänsicke et al., 2012), and GD 133 (Xu et al., 2014) could not be included at this time, as one of Ca/Mg/Fe had only an upper limit available. We also exclude WD 1425+540 (Xu et al., 2017) as it would be senseless to try and explain cometary material in terms of rocky geology.
For eight systems, application of equation (4) resulted in a negative value for one structural component. For display purposes, we set the negative values to 0, and renormalised the other two components such that they appear on the boundary of Fig. 4. For six of these the effect is only minor (only a few or less), but for SDSS J07381835 and GALEX J19310117 the calculated crust values are (displayed in grey in Fig. 4). This issue can be resolved if the parent body mantles were relatively Ca-poor compared to the Earth’s, suggesting our second assumption (above) is not universally applicable. We find that reducing in equation (5) by a factor of 2.5 is sufficient to move both SDSS J0738183 and GALEX J1931+0117 within the bounds of Fig. 4, and thus with compositions consistent with combinations of mantle and core material. Additionally, it is suggested by Dufour et al. (2012) for SDSS J0738183 and Melis et al. (2011) for GALEX J1931+0117, that their compositions may be indicative of stripping of their outer layers, including part of its mantle for GALEX J1931+0117.
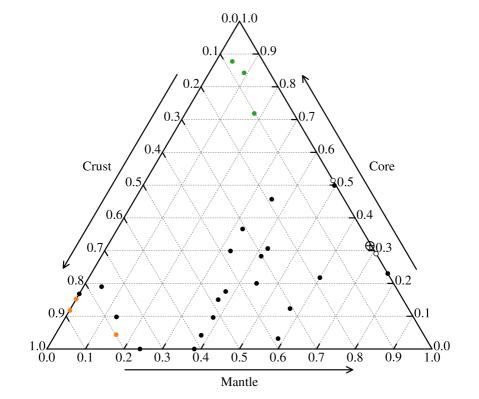
We find the majority of objects from published analyses (black points in Fig. 4) are consistent with crust-like material or a mixture of crust and mantle rather than the bulk Earth (although, we note that WD 1536520 is only fractional plot units away). For instance the accreted material at NLTT 43806 is described as being in best agreement with “a mixture of terrestrial crust and upper mantle material” by Zuckerman et al. (2011), whose analysis also included the detection of Al accretion. The crust/mantle/core mass fractions we calculated (Table 1) corroborate this assertion. Similarly, we find that among the previously published analyses (Table 1), SDSS J08452257 has the highest core mass fraction, in good agreement with the more detailed study of Wilson et al. (2015) who detected large abundances of Fe and Ni. Furthermore, Wilson et al. (2015) argued for a mantle/core mixture, but mantle depleted with respect to the Earth. We reach the same conclusion from our analysis, where we find a mantle/core mixture of 50/50 for SDSS J08452257 versus 70/30 for the Earth. These comparisons demonstrate the effectiveness of our relatively simple approach to classifying exoplanetesimal compositions, which only requires abundance measurements of Ca, Mg, and Fe.
The overall banana-shaped distribution in Fig. 4 may initially come as a surprise, however it is simple to see that this is indeed the expected distribution of crust, mantle, core combinations. The dearth of points along the right edge of the plot corresponds to the absence of parent bodies made of a crust+core mixture but lacking a mantle, which is consistent with the expectation that planetary objects undergoing differentiation will form with a significant mantle component, in addition to their core and crust. Finally there are no points in Fig. 4 corresponding to more than 80 percent mantle, whereas multiple objects are seen with more than 80 percent crust or core compositions. While it may be possible to create mantle-dominated asteroids via stripping of a larger body, the absence of points in this region potentially indicates that such a process rarely occurs.
The distribution of points in Fig. 4 makes it clear that rocky material accreted by white dwarfs often originates from highly differentiated parent bodies. In particular, the prevalence of crust-dominated and crust+mantle points suggests parent bodies originating from collisional fragments of the upper layers of (minor-)planets as proposed by Zuckerman et al. (2011) for NLTT 43806. This argument becomes especially appealing on consideration that the Earth’s crust contributes less than 1 percent of its mass, yet for most of the objects in Fig. 4/Table 1 the associated crust fractions are in range 15–90 percent.
4 Extreme abundance ratios
Instantaneous accretion can not be assumed for DZ white dwarfs due to the long time-scales for metals to diffuse out of the base of their CVZs (Section 3.1). Therefore in the general case, it is not possible to establish whether the observed metal contamination arises from the accretion of a single large object, or from multiple accretion episodes involving smaller parent bodies. However several systems in our sample show compositions consistent with the accretion of highly differentiated parent bodies in particular those that are rich in Ca or Fe as discussed in Section 3. These white dwarfs have very likely accreted single large parent bodies because subsequent accretion episodes of many small planetesimals (that were not previously part of a single larger object) are expected to average out to a less extreme abundance pattern, e.g. more similar to the bulk Earth.
4.1 Ca-rich objects
The four Ca-rich DZ white dwarfs we have identified are SDSS J07444649, SDSS J10331809, SDSS J10553725, and SDSS J13512645555 SDSS J10331809 and SDSS J13512645, have degenerate crust/mantle/core values and so are indistinguishable in Fig. 4., which are shown by the red points in Fig. 2/4. These are contenders for the most crust-like in nature with similar values to GD 40 (Jura et al., 2012; Xu et al., 2013), NLTT 19868 (Kawka & Vennes, 2016), PG 1225079 (Xu et al., 2013), and GD 362 (Xu et al., 2013). The most striking spectral feature of these DZs (Fig. 6) is their huge increase in opacity bluewards of Å, resulting in the suppression of flux at shorter wavelengths. This arises from the extremely pressure-broadened wings of the Ca ii H+K lines.
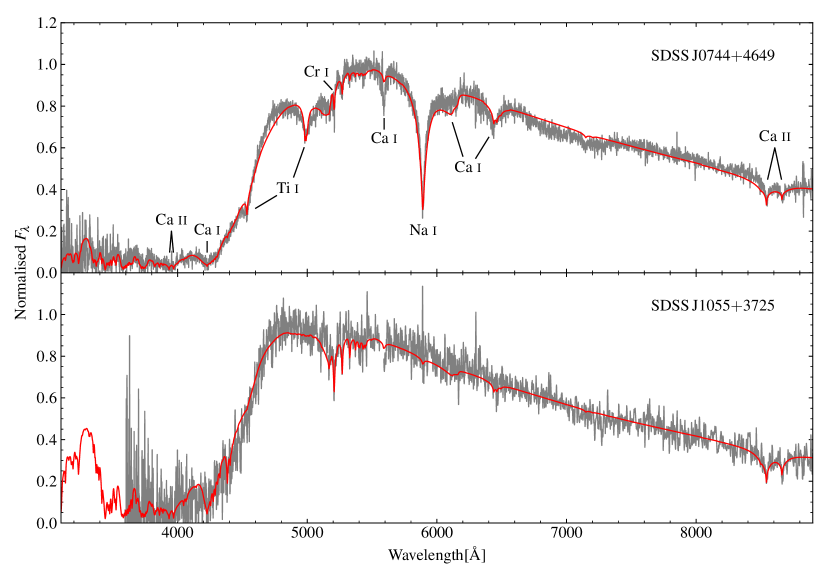
The most noteworthy of the Ca-rich systems is SDSS J07444649. The spectrum of this white dwarf is unique with no similar looking stars known. Compared to calcium, both magnesium and iron are depleted with Fe/Ca and Mg/Ca ratios dex lower than those of the bulk Earth. The spectrum of this star also exhibits strong lines of Ti and Na which are typically not seen for other DZs with K. The abundance ratios are dex and dex, where the respective abundances are and dex for the bulk Earth (McDonough, 2000), and and dex for the Earth’s crust (Rudnick & Gao, 2003). The Ti/Ca ratio for SDSS J07444649 is much closer to the Earth’s crust value than the bulk Earth ratio, and as both elements are refractory lithophiles, this reinforces the crust-like interpretation of the accreted planetesimal. On the other hand, the Na/Ca ratio is more similar to the bulk Earth ratio. However we note that while Na is a lithophile, it is also a volatile element and so is not expected to condense at the same temperature as Ca or Ti. Like Ca and Ti, Al is also a refractory lithophile and thus is likely to be present at an abundance of dex (Rudnick & Gao, 2003). However, the only strong optical Al i transitions are located at 3944 Å and 3961 Å, between the already saturated Ca H+K lines. As there is so little emergent flux in this wavelength region (Fig. 6) detecting Al at SDSS J07444649 would be extremely challenging even with improved instrumentation. We also detect the moderately refractory lithophile Cr at relative abundance of dex, much higher than the trace dex for the Earth’s crust (Rudnick & Gao, 2003). The mass fractions for each element including presumed unseen elements are demonstrated by the left-hand pie charts in Fig. 5. If the material accreted by SDSS J07444649 is indeed lithospheric, then Fig. 5 indicates that the unseen elements make up 80 percent of the total mass of the parent body, with most of this comprised of O, followed by Si and then Al (Rudnick & Gao, 2003). Note that the optical transitions of O and Si become extremely weak for the range of our sample, thus prohibiting their detection in DZ white dwarfs.
For the other three Ca-rich objects, we are not able to offer an analysis as detailed as for SDSS J07444649, however they are worthy of discussion none the less. All three stars have qualitatively similar spectra, with SDSS J10553725 shown in Fig. 6 (spectra for all DZs in our sample are shown in Paper I). As their SDSS spectra are of much lower in quality than that of SDSS J07444649, Ti is only detected for SDSS J13512645 at a relative abundance of dex, again supporting a crust-like interpretation of the accreted parent body. At both SDSS J10553725 and SDSS J13512645 we also detect Cr at relative abundances of and dex respectively. In all three detections of Cr (including SDSS J07444649), the Cr/Ca ratios are found to be greatly enhanced relative to the Earth’s crust ( dex), with potential implications for their planetary formation conditions. McDonough (2000) notes that while regarded as a lithophile, under high pressure, Cr exhibits siderophile behaviour, and thus for the Earth is concentrated into the core (Moynier et al., 2011), where the bulk Earth value is dex. Therefore the parent bodies accreted by SDSS J07444649, SDSS J10553725, and SDSS J13512645 were likely of much lower mass than the Earth and thus formed under lower pressure conditions where Cr exhibits lithophile behaviour.
4.2 Fe-rich objects
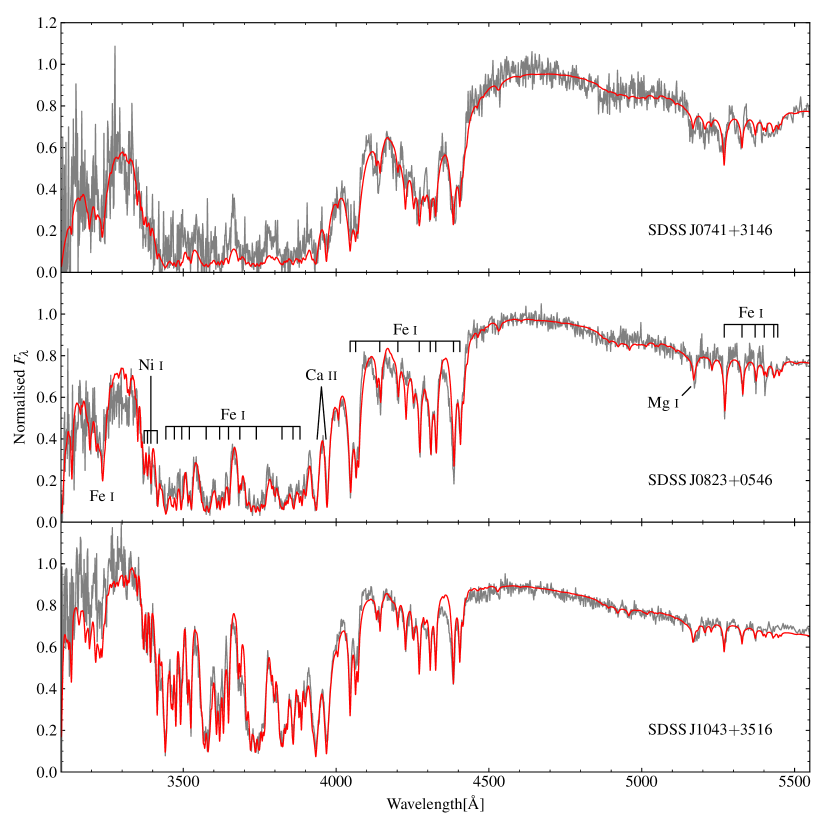
The inferred compositions for the material accreted by SDSS J07413146 and SDSS J08230546 are both extremely Fe-rich with dex, the highest ratio known for any metal polluted white dwarfs (see Gänsicke et al. (2012), Kawka & Vennes (2016) and Wilson et al. (2015) for additional Fe-rich systems). The spectra of both stars are quite similar (Fig. 7) showing a dense forest of blended Fe i lines in the range 3400–3900 Å. Other notable Fe features include the strong triplet near 4400 Å, and the multiplet between 5250–5500 Å which provide additional constraints on the Fe abundance and . While Fe is the dominant contaminant in the atmospheres of these two stars, the intrinsic strengths of the Ca H+K resonance lines result in the low Ca abundances remaining well constrained. SDSS J10433516, is the next most Fe-rich in our sample with = 1.68 dex. Its spectrum is qualitatively similar to those of SDSS J07413146 and SDSS J08230546, however the Fe lines are slightly weaker and H+K lines slightly stronger.
From our structural analysis in Section 3.3, SDSS J07413146 and SDSS J08230546 appear to be the most core-like exoplanetesimals discovered to date. We note that the Fe-rich system NLTT 888 comes close with of 1.76 dex (Kawka & Vennes, 2014, 2016), however the lack of firm Mg measurement precludes it from being placed on Fig. 4, i.e. using either the quoted upper limit or precisely 0 for the Mg abundance yield wildly different results for the crust/mantle/core decomposition. Using the upper limit of dex leads to a negative crust-value, however by setting to dex places NLTT 888 at the edge of Fig. 4 with a mantle fraction of 30 percent and core fraction of 70 percent.
For all three Fe-rich systems we obtained spectra using the Intermediate dispersion Spectrograph and Imaging System (ISIS) on the William Herschel Telescope (WHT). For SDSS J08230546, which we identified as a DZ candidate from its SDSS colours and its relatively high proper motion, this is the only available spectrum. Details on the observations and reduction of the WHT spectra are summarised in Paper I. Because the WHT spectra extend as far blue as 3100 Å, we are also able to constrain Ni abundances for all three stars using a set of Ni i lines at Å, and measure as 1.59, 1.23, and 1.35 dex for SDSS J07413146, SDSS J08230546, and SDSS J10433516 respectively666Note that for SDSS J07413146, the relative flux errors around 3400 Å are quite large and a weak magnetic field of MG appears to be present (identified after publication of Paper I). Therefore, the Ni abundance of SDSS J07413146 is probably not as well constrained as the other two systems.. For the bulk Earth and the Earth’s core, is about 1.24 and 1.20 dex respectively (McDonough, 2000) which is particularly close to the 1.23 dex measured for SDSS J08230546 – the most precisely analysed Fe-rich object in our sample due to the exceptional quality of the WHT spectrum (Fig. 7). We note that these Fe/Ni ratios are consistent with the metallic alloy kamacite which is predominantly Fe with a few percent Ni, and is found in metallic meteorites. In contrast Wilson et al. (2015) find a much higher Ni content consistent with taenite or a taenite/kamacite mixture.
Our structural decomposition of these systems combined with the Fe/Ni ratios leave little ambiguity that the accreted planetesimals underwent differentiation during their formation. The differentiated bodies must then have undergone stripping of their crust and mantle, resulting in exoplanetesimals comprised primarily of core material, which were subsequently accreted on to these white dwarfs.
For both SDSS J07413146 and SDSS J10433516 Cr is also detected via the 5207 Å Cr i line, but is notably absent from the spectrum of SDSS J08230546 (despite the high signal-to-noise ratio of the spectrum). Recalling that Cr is a generally regarded a lithophile but exhibits siderophile behaviour at high pressure (McDonough, 2000), this may also suggest different formation environments for the core material observed across these systems. For SDSS J07413146 and SDSS J10433516 the atomic Cr/Fe ratio is measured to be and dex respectively, where McDonough (2000) quote a value of dex for the Earth’s core. Therefore we speculate that the parent bodies accreted by SDSS J07413146 and SDSS J10433516 may have originated from planetary mass objects, whereas for SDSS J08230546 the accreted planetesimal formed within a lower mass body such as a minor planet.
Under the hypothesis that the Fe currently residing in the CVZ originates from a single accretion episode, we can deduce a lower limit on the mass of the parent body. In the following, we assume , as the mass of the CVZ depends on the white dwarf mass. This results in g and g for SDSS J07413146 and SDSS J08230546, respectively777Many other white dwarfs in our sample exhibit larger abundances of Fe, but their unremarkable compositions are consistent with the accumulation of material from multiple accretion episodes or single large bodies with Earth-like compositions.. These are, in fact, conservative lower limits, as the planetary cores are not purely composed of Fe, and as the debris composition suggests that the planetesimals were not entirely made up of core-material. Furthermore some of the Fe/Ni may have already sunk out of the base of convection zone depending on how long ago the accretion events occurred. Application of equation (4) on the crust/mantle/core fractions (Table 1) implies Fe alone comprised percent of the total parent body mass at SDSS J08230546. If we consider Ni as well as Fe, then these two core elements account for percent of the total accreted mass. Because the columns in equation 5 do not sum to one, the implication is that most of the remaining mass includes undetected elements, such as O and Si (Fig. 5, bottom right). The measured compositions for SDSS J08230546 and those implied by equation 4 are illustrated in the right-hand pie charts of Fig. 5. At a maximum density of 7.9 g cm-3 (a pure Fe/Ni composition with no porosity), we arrive to minimum geometric-mean radii of 39 and 45 km for the planetesimals accreted by SDSS J07413146 and SDSS J08230546, respectively.
The above analysis assumes that the present CVZ metal masses correspond to the total accreted masses. While these estimated masses are comparable to moderately large Solar system asteroids, some of the material has presumably already sunk out of the bases of their CVZs since the accretion events occurred, and thus the parent bodies must have been larger. However, intuition tells us that the accreted planetesimals can not have been much more massive, as there ought to be fewer available bodies at higher mass-intervals. Consequently the accretion episodes ought to have occurred within only a few ago. For example, if the material at SDSS J08230546 was deposited ago, the implied parent body mass would be similar to that of the Moon. While this is by no means impossible, a mass closer to that observed now in the CVZ seems far more reasonable, thus implying a more recent accretion history. We show here that this intuition can be translated directly into statistics, providing median values and 95th percentile upper-limits to the asteroid masses, and hence times since the accretion episodes.
The most massive planetesimals in the Solar asteroid belt have a power-law mass-distribution with an exponent (Kresak, 1977). We therefore assume that the large large metallic exoplanetesimals accreted by SDSS J07413146 and SDSS J08230546 have masses, , drawn from a similar distribution, , with the mass of material in the white dwarf CVZ, as a lower bound. can then be written as
| (6) |
Integrating (6) up to a mass , yields the corresponding quantile , i.e.
| (7) |
Rearranging equation (7) to express the ratio in terms of ,
| (8) |
it then becomes simple to calculate the median and 95th percentile upper-limit of , for a given value of the power-law exponent, . Using as above we find has a median value of 2.4 and 95th-percentile upper-limit of 42. In other words, the initial planetesimal masses were probably only a few times larger than what currently remains within the CVZs, and is unlikely to be more than a few ten times larger. These upper limits correspond to g or about one tenth the mass of Ceres, for the metallic objects by SDSS J07413146 and SDSS J08230546.
Continuing this line of reasoning, we can place similar constraints on how long ago these planetesimals were accreted. Because their composition is dominated by Fe and Ni (which both have similar diffusion time-scales), we are justified in considering the time-evolution of material in the white dwarf CVZ as
| (9) |
In the general case where the mass has components from elements with different sinking time-scales, (9) becomes a sum of exponentials, which cannot be analytically solved for . Combining equations (8) and (9), we can then write the time since accretion in terms of and as
| (10) |
Using again , we find the median and 95-percentile upper-limits for are and respectively.
To place these systems in context, there are several comparable Solar system objects that are worth consideration. This includes the main-belt asteroid, 16-Psyche, which is the largest M-type asteroid in the Solar system. Radar observations show that Psyche has a mostly metallic composition (Ostro, 1985) consistent with exposed core material. At a mass of g. (Carry, 2012), it is only one order of magnitude larger than the estimated Fe mass currently residing in the CVZ of SDSS J08230546. While Psyche is thought to be chiefly comprised of Fe and Ni (Matter et al., 2013), NIR observations indicate that its surface composition also includes pyroxenes (Hardersen et al., 2005). As pyroxenes can include Ca and Mg it is possible that these elements we see in these Fe-rich white dwarfs could also arise from such compounds on the surface of the metallic asteroids.
The metallic (as opposed to rocky) nature of these exoplanetesimals offers the opportunity to investigate the process of the accretion on to the white dwarf surface which we show to be violently destructive, and not necessarily leading to the existence of a debris disc. Typically, planetesimals arriving at white dwarfs are assumed to be loose rubble piles held together through self-gravitation. Disruption occurs when tidal forces overcome self-gravity. In the case of loose rubble piles, the distance from the white dwarf at which this occurs (the Roche radius) depends only on the white dwarf mass and planetesimal density, and is typically in the range 1–2 . For Fe-rich asteroids, the mechanical strength of the material cannot be ignored, and a different treatment is required. The effect of mechanical stresses on planetesimals has previously been examined by some authors (e.g. Slyuta & Voropaev, 1997; Davidsson, 1999), with Brown et al. (2017) recently considering the disruption of high mechanical-strength planetesimals in the context of white dwarf accretion. They show that for an asteroid with density , size , and tensile strength , a simple relation for the tidal disruption radius is given by
| (11) |
where is the gravitational constant and is the white dwarf mass.
The small amount of literature available on the mechanical properties of metallic Solar system bodies indicates their characteristics can vary dramatically. For the meteorite samples that have been studied, tensile strengths have been found ranging from 40 MPa (Slyuta, 2013) up to 800 MPa (Opik, 1958), and exceeding 1 GPa for some cast Fe-Ni alloys (Petrovic, 2001). To explore an extreme example, we take MPa. Assuming the density for meteoritic-iron of 7.9 g cm-3, we estimated above minimum radii of 39 km for SDSS J07413146 and 45 km for SDSS J08230546, respectively888The radii were likely larger than this for two reasons. Firstly, as our above analysis shows, the masses could be somewhat larger, and secondly if the asteroids had any significant porosity, their effective densities would be lowered.. Setting to the canonical 0.6 , equation (11) implies similar tidal disruption distances for both systems at , much closer than the for a strengthless rubble pile. Of course, if any faults are present within the asteroid, this will allow for disintegration at greater distances from the white dwarf, but with the resulting smaller fragments more resilient to tidal effects.
Because these asteroids are presumably composed of largely ductile metal, it is interesting to consider the process of breakup itself. Before catastrophic mechanical failure when the asteroid reaches the tensile limit, it will first reach the yield limit. At this point additional stress causes plastic deformation, leaving the planetesimal shape permanently altered even if tensile forces are relaxed. Therefore breakup of metallic asteroids will result in deformation before mechanical failure (Slyuta, 2013). Knox (1970) found yield strengths of 400 MPa to be typical, with Petrovic (2001) showing that at room temperature, the ratio of tensile and yield strengths is typically 1.5–2. This act of deformation may hasten the breakup process, as the stretching will result in tidal heating, further weakening the metal. Additional heating/weakening could be provided by flux from the central star, but this strongly depends on whether the asteroid remains in the vicinity of the white dwarf long enough for it to thermally respond. While a temperature dependent reduction in mechanical strength will cause the planetsimal to disintegrate further away from the white dwarf, the ratio of tensile to yield strength will increase (Petrovic, 2001) allowing for a greater degree of deformation before fragmentation.
Although rather simplified, the size dependence of equation (11) indicates that the resulting fragments are more resistant to tidal forces, and so must move closer to the central white dwarf before further breakup can occur. This logically implies continuous fragmentation down to the surface of the white dwarf, with some final size for the accreted pieces. Setting the left hand side of equation (11) to , this implies km-sized fragments reaching the white dwarf surface, as also indicated by Brown et al. (2017) in their analysis of granite. In reality this minimum size will be smaller than 1 km due to the temperature dependence of the tensile strength and whether any significant melting/ablation of the fragments occurs on their final descent. That being said, even if we reduce the tensile strength by a factor of one hundred, this only reduces the final fragment size by a factor ten, i.e. fragments on the order of 100 m arriving at the white dwarf surface. In other words it is quite possible that the metal-rich material we see at SDSS J07413146 and SDSS J08230546 did not accrete on to their respective white dwarfs entirely in the gas phase, but rather impacted the stellar photosphere as millions of solid fragments.
Because these impacts would occur at orbital speeds of several , the expected impact energy would be very large – a 100 m diameter iron sphere would impact a canonical 0.6 , 0.013 white dwarf with a free-fall energy of erg. Because the scale-heights for cool white dwarfs with helium dominated atmospheres are on the order of 10 m, the energy release will take place on s time-scales and thus lead to a short short-lived, but luminous burst. Brown et al. (2017) also considered this situation, with comparison to Solar impactors, with their analysis suggesting energies direct collisions of km-sized planetesimal fragments on to white dwarfs could be observable as transient sources. While we have conservatively assumed smaller fragments than Brown et al. (2017), the specific energy of 100 keV per nucleon is independent of the planetesimal mass999Brown et al. (2017) quote a specific energy of 10 MeV per nucleon implying emission up to gamma-ray energies. However, this is in error and should be 100 keV per nucleon, and thus maximum emission energies of hard X-rays (J. Brown, priv. comm., 2017).. Therefore the systems discussed in this section motivate future searches into high energy transients from direct impacts of solid bodies on to nearby accreting white dwarfs.
4.3 Mg-rich objects
SDSS J09565912 and SDSS J11581845 both stand out in Fig. 2 as Mg-rich (SDSS J11581845 is the right-most of the two blue points) and exhibit strong Mg i lines in their spectra (Fig. 8), They are are even more Mg-rich than the Earth’s mantle (blue cross), however it is not clear whether these abundances reflect atypical planetesimal compositions, for example pure magnesium silicate, or the result of relative diffusion. As outlined in Section 3.1, we find that for the stars in our sample, the Mg diffusion time-scales are typically times longer than those of Ca or Fe. Therefore any given point in Fig. 2 (with the exception of the left-edge, which implies zero initial Mg) will move towards the bottom right corner over time, as Ca and Fe diffuse out of the white dwarf CVZ faster than Mg.
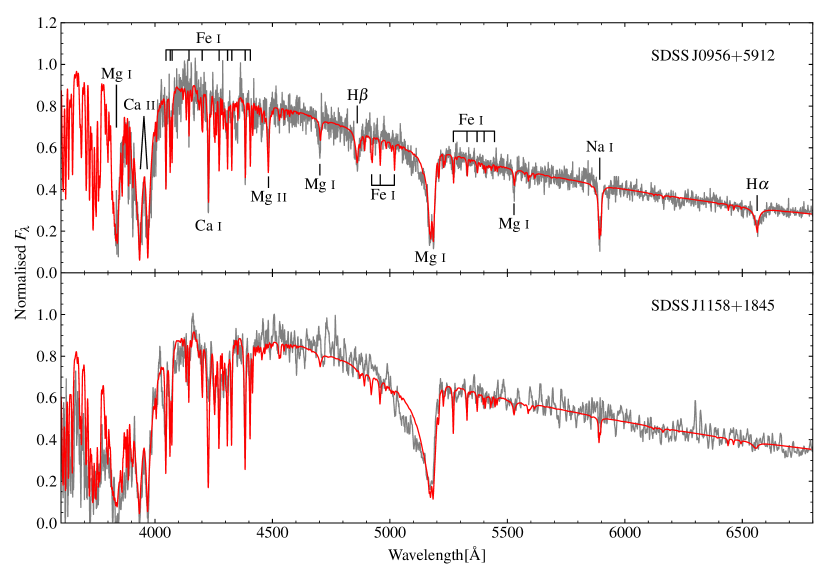
Inspection of Fig. 2 shows that a line drawn between the bulk Earth composition and the bottom right corner passes close to both SDSS J09565912 and SDSS J11581845. Therefore, it is perhaps possible that these white dwarfs may have accreted Earth-like material several Myr ago which is now severely Mg enhanced. In units of Ca diffusion-time-scales, , an initial composition resembling the bulk Earth will arrive at the present position of SDSS J09565912 in approximately ( Myr), and about ( Myr) for SDSS J11581845. For SDSS J11581845 this corresponds to an initial Ca abundance close to dex. This slightly surpasses SDSS J13402702 which has the highest observed Ca abundance in our sample at dex. Assuming a white dwarf, the total accreted mass (scaling from bulk Earth abundances), would have been roughly that of Ceres. For SDSS J09565912 the situation is even more extreme. Despite the very high Mg/Ca ratio, the absolute Ca-abundance is the second highest in our sample. For an accretion episode occuring ago, the original Ca abundance would have been about dex, corresponding to total accreted metals of about g or 3 Ceres masses (again assuming a 0.6 white dwarf).
As very few objects within the Solar system have masses in this range and above, it seems unlikely that we observe two systems having accreted such extremely large planetesimals. An alternative hypothesis is that increased dynamical activity at these systems several Myr ago led to the accretion of a large number of lower mass planetesimals totalling a Ceres mass or more. For instance tidal interactions of passing stars could provide such short lived dynamic instabilities (Bonsor & Veras, 2015; Hamers & Portegies Zwart, 2016; Veras et al., 2017). Several Myr later after this intense accretion episode has ceased, these white dwarfs show Mg-rich material due to relative diffusion.
Finally we consider the possibility that the parent bodies accreted by SDSS J09565912 and SDSS J11581845 were intrinsically Mg-rich, far from our assumption that planetesimals follow the core/mantle/crust compositions of the Earth. For instance, the observations can be considered consistent with parent body masses of g accreted much more recently, but with substantially higher Mg/Ca and Mg/Fe ratios than even the Earth’s mantle, e.g. predominantly enstatite, forsterite, or a mixture of the two.
5 Evolution of remnant planetary systems
and atmospheric abundances are determined directly from spectral fitting, and so it is common practice to plot the abundance of one of the metals (usually Ca, as this is most easily detected) against . While this is a useful way to illustrate variations in abundances across the full range of known white dwarfs, the non-linear relationship between and age does not provide the best handle on the evolution of the oldest systems. For instance Fig. 8 of Koester et al. (2014) shows that the highest observed accretion rates ( g s-1) of rocky debris on to DA white dwarfs remain constant over a large range in , however most of the sample discussed in that paper spans only the first Gyr of white dwarf cooling. Several dynamical studies suggest that a decrease in scattering (and subsequent accretion) events ought to occur (Debes et al., 2012; Mustill et al., 2014; Veras et al., 2013; Veras et al., 2016). In this section we provide evidence for a decline in maximum observed accretion rate, but over time-scales of many Gyr, which we are able to probe for the first time with our sample of cool DZ white dwarfs.
Since white dwarfs cool predictably after departing the AGB, we were able to estimate cooling ages for our DZ sample (Paper I). White dwarf ages depend not only on the white dwarf , but also the white dwarf mass. As it is not possible to determine these spectroscopically for DZs, we used the SDSS white dwarf mass distribution (Kepler et al., 2015) as a prior. Propagating the measured values and mass prior through the Montreal DB cooling tracks (Bergeron et al., 2001; Holberg & Bergeron, 2006; Kowalski & Saumon, 2006; Bergeron et al., 2011), we thus were able to determine cooling ages and their associated uncertainties. A more detailed description of these cooling age calculations are given in Paper I, with the results tabulated in Table 8 of that work.
The oldest system in our sample is SDSS J16361619 at Gyr, which is unsurprising considering it also has the reddest colour at (See paper I). Because the typical white dwarf progenitor is a A-type star (Catalán et al., 2008) with a main-seqence life time of Gyr, the total system age is Gyr. Therefore, our analysis indicates this object is nearly as old as the Galactic disc (Oswalt et al., 1996; del Peloso et al., 2005; Haywood et al., 2013), yet still shows the signs of a planetary system, long after departing the main-sequence.
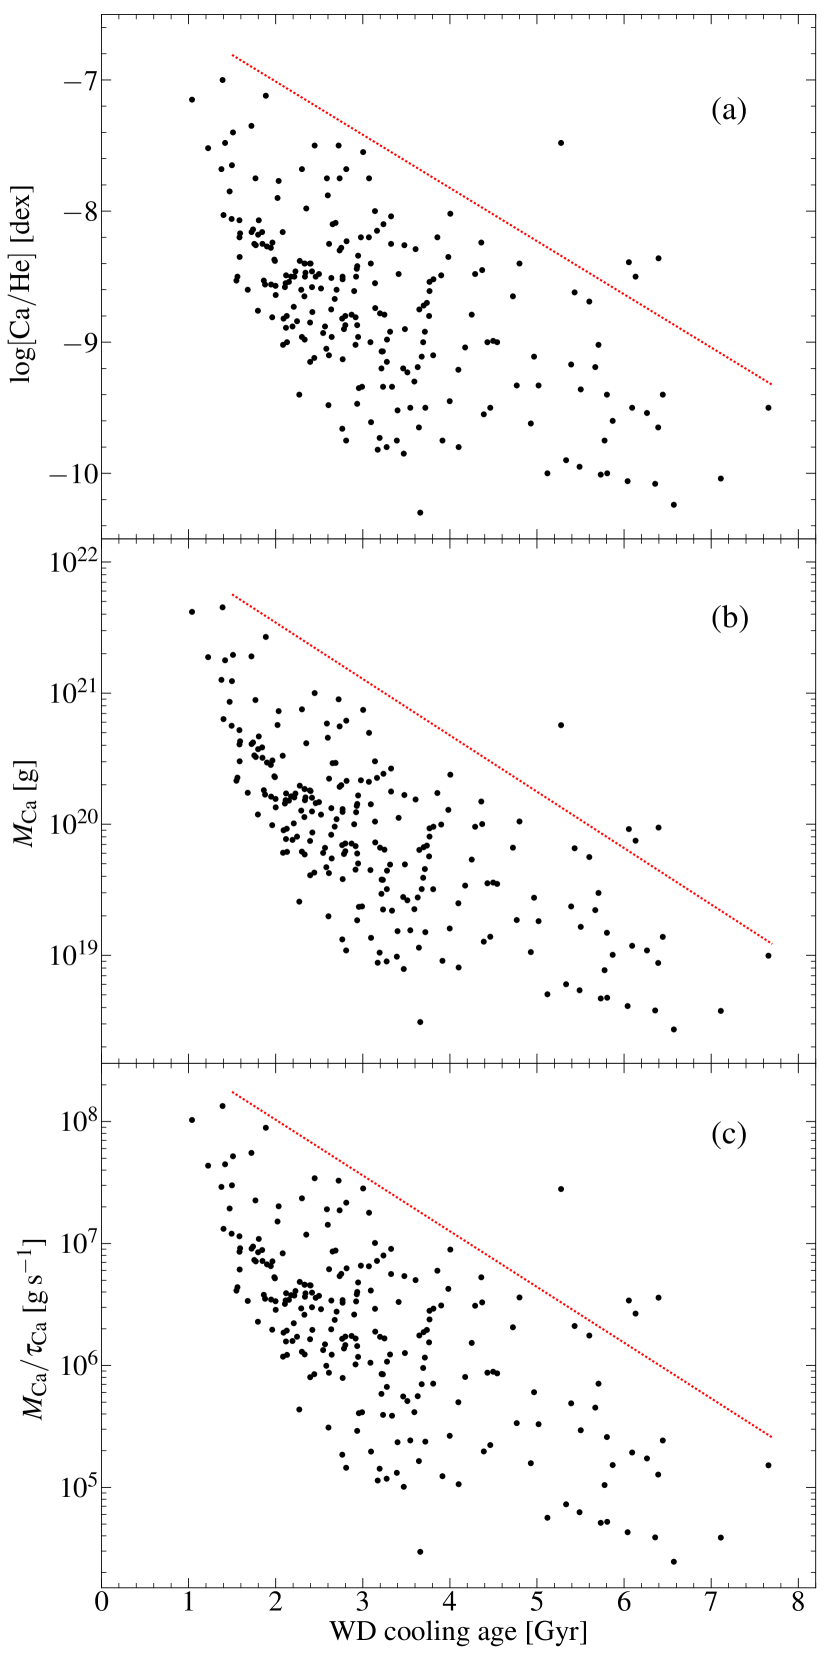
In Fig. 9a we show versus the estimated cooling ages. The distribution is approximately triangular in shape, however only one of the edges has a physical significance. The left and lower edges (young and less polluted systems) merely result from our white dwarf identification method, which by design is insensitive to hot/young systems or white dwarfs with very low metal-abundances (Paper I). In contrast, the upper edge is an apparently real boundary of the DZ white dwarf distribution, representing a decrease in the maximum-encountered Ca abundance of dex across the full age-range of our sample.
Selection-bias can be easily ruled out as hypothetical objects within the upper-right corner (cool and extremely metal-rich), would have highly distinctive spectra, and would look unlike any main-sequence star or quasar. The corresponding model spectra were calculated for the grid used in Paper I for the search of cool DZs. Therefore, we are confident that we would have identified any such system. The absence of objects with dex at old ages indicates they must be extremely rare101010A clear exception is SDSS J09162540 with dex and cooling age of Gyr, which we discuss in Section 5.1..
A physical interpretation for the decrease of must account for the dex change we see in Fig. 9a. We show here that neither variations in the size of the white dwarf CVZ, nor elemental diffusion time-scales are significant enough to explain the magnitude of this decrease, and thus we are unable to explain the abundance decrease as the result of evolving white dwarf properties.
For each white dwarf in our sample, we performed envelope calculations to determine the masses of their outer CVZs as well as the diffusion time-scales for each element (Paper I, Table 7). These properties change with white dwarf cooling, and so we investigated whether these could account for the trend seen in Fig. 9a. We firstly scaled Ca abundances by the masses of the white dwarfs CVZs, which determines the mass of Ca mixed throughout the white dwarf envelopes. This had little effect on the trend, which remained at a dex decrease across the age range of our sample (Fig. 9b). We then rescaled these masses by each white dwarf’s Ca diffusion time-scale, which determines the mass fluxes through the base of their CVZs, or in other words, the average accretion rates of Ca on to the stars. Rather than causing the trend to subside, we instead found it to steepen to dex (Fig. 9c)
The downwards trend is indicated by the dashed lines in each panel of Fig. 9 and corresponds to an exponential decrease in the accretion rate upper bound with white dwarf age (for now ignoring four outliers above the lines, discussed separately below). The slope of the line in Fig. 9c corresponds to an e-folding time-scale of 0.95 Gyr. We found that this could not be varied much more than 0.1 Gyr before appearing incompatible with the data, and thus we argue that Gyr is the time-scale on which the accretion rate upper limit decays for our DZ sample. Since this decrease of white dwarf pollution with age does not appear to arise from either selection bias nor a change white dwarf properties, it likely relates to the properties of the planetary systems at these white dwarfs.
We find the most reasonable explanation is that the number of planetesimals remaining in old remnant planetary systems, available to be scattered towards the white dwarf, decreases with time. Since the occurrence rate that white dwarfs accrete planetesimals will be proportional to the number available to be scattered inwards, then an exponential decrease in the largest objects is to be expected. Dynamical simulations have previously suggested that the occurrence rate of white dwarf pollution should be expected to decrease on Gyr time-scales (Debes et al., 2012; Mustill et al., 2014; Veras et al., 2013; Veras et al., 2016) We therefore suggest that our observations may show the first evidence of this process occurring.
Our results in Paper I provide one caveat to this interpretation. In Fig. 11 of that work, we compared our DZs with the DZ sample of Dufour et al. (2007) and the DBZ sample of Koester & Kepler (2015). There we noted an abrupt 2 dex increase in occurring at about 10 000 K (corresponding to a cooling age of 0.7 Gyr for a 0.6 white dwarf), and speculated that this may indicate an incomplete understanding of white dwarf CVZ formation. It is therefore prudent to remain cautious of the 3 dex decrease we see here in Fig. 9. On the other hand, our envelope calculations currently suggest that the combined effect of variations in CVZ sizes and diffusion time-scales across our sample act to amplify the decline between Figs. 9a and 9c, although only by about 0.5 dex. Therefore a change in our understanding of white dwarf CVZs would need to imply a three order of magnitude change in the opposite direction to remove the trend seen in Fig. 9c.
A hypothesis for the abrupt rise in (Fig. 11 of Paper I), that we did not consider in that work, is that a dynamical instability occurs after Gyr of white dwarf cooling ( K), spontaneously increasing the occurrence rate at which planetesimals are accreted (e.g. see Fig. 3 of Mustill et al., 2014). For white dwarfs with hydrogen atmospheres with their short sinking time-scales, such an instability would instead manifest itself as an increase in the DAZ/DA ratio at around the same age which, subject to selection biases, is potentially observed in Fig. 8 (middle panel) of Koester et al. (2014), Thus the changes in maximum abundance seen in Fig. 11 of Paper I and Fig. 9 here could both be related to the evolution of their planetary systems.
5.1 Metal rich outliers
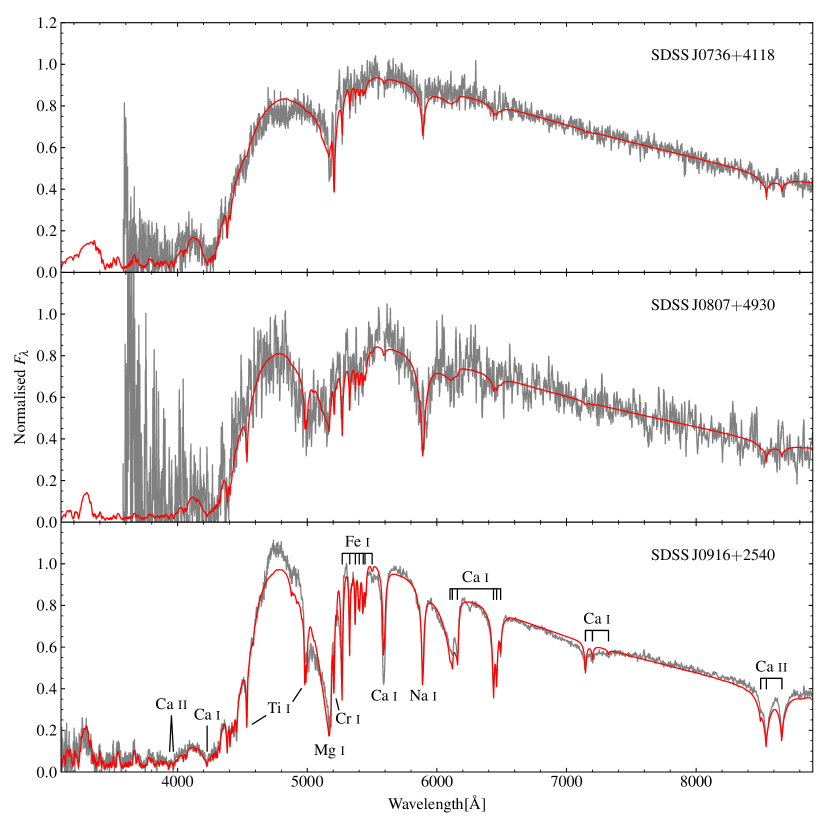
We note that four systems in our sample (SDSS J07364118, SDSS J07444649, SDSS J08074930, and SDSS J09162540) are located above the upper envelope for all three parametrizations in Fig. 9. Naturally these outliers are worthy of discussion in regards to their unusually high Ca-abundances/accretion rates for their ages. The spectra of SDSS J07364118, SDSS J08074930, and SDSS J09162540 are displayed in Fig. 10 – the spectrum of SDSS J07444649 can be found in Fig. 6.
SDSS J07444649
This system has already been discussed in detail in Section 4.1, due
to the Ca-rich nature of the accreted material which, combined with the
moderate total-metal-abundance for this star, leads to a particularly high
location in Fig. 9. In terms of or , this star
is located within the distribution of our sample (although only just).
SDSS J09162540
This extremely metal-rich DZ shows a spectrum quite unlike any other white
dwarf, with extreme photospheric absorption by a large number of elements
across the entire optical range. This system was first analysed by
Koester et al. (2011)111111 SDSS J09162540 was also independently
identified by members of the Galaxy Zoo community from its SDSS spectrum, who
also correctly classified it as an unusual white dwarf
(http://www.galaxyzooforum.org/index.php?topic=276688.15). in their
sample of 26 DZ stars. As our DZ sample is nine times larger than that of
Koester et al. (2011), one might expect to find several more similar objects,
however SDSS J09162540 remains unique among our 230 objects. No doubt
such an usual spectrum could be recognised even in low quality data (but with
reduced scope for spectral analysis), and so we are lucky that this
intrinsically faint star is so nearby ( pc) that its spectrum
can be studied in exquisite detail.
Within Fig. 9, SDSS J09162540 is an order of magnitude more abundant in Ca, compared to other white dwarfs of similar temperature/age, suggesting some rare phenomenon results in its extremely metal-rich photosphere. The answer, we believe, lies approximately 40 arcseconds to the South-East in the form of a K-star common-proper-motion companion (J. Farihi, priv. comm., 2013). At the estimated distance of pc (Paper I), the projected separation between the two stars is au.
Several recent theoretical studies suggest that wide binary companions can cause secular instabilities in white dwarf planetary systems, even at large ages, resulting in an increased influx of planetesimals. Bonsor & Veras (2015) considered the effect of Galactic tides on wide binary systems, and found that secular variations in the orbital elements, can lead to a close approach several Gyr after the primary has entered the white dwarf cooling track, thus turning a previously stable planetary system into a dynamically active one.
In contrast, Petrovich & Muñoz (2017) considered systems where a belt of exoplanetesimals is initially located between an inner planetary system and a, potentially stellar, inclined outer companion. During the main-sequence, they argued that the inner planetary system dynamically shields planetesimals against perturbations from the outer companion. However if the inner system is engulfed during stellar evolution to the white dwarf stage, then the planetesimal belt that may have been dynamically stable throughout the main-sequence can now be affected by the outer perturber via the Kozai-Lidov mechanism. Under this mechanism, an orbiting companion inclined with the plane of the planetary system causes planetesimals on previously circular orbits to exchange eccentricity with their own inclination. This can result in planetesimals on highly eccentric orbits, with pericentres within the white dwarf tidal-disruption radius. According to Petrovich & Muñoz (2017), this mechanism also has the advantage that it is always active, and so could explain the extreme abundances at SDSS J09162540, despite the present binary separation of several thousand au.
SDSS J08074930
We note that qualitatively, the spectrum of this white dwarf resembles that of
SDSS J09162540, but far less extreme (an “0916-lite”), motivating us to
check this system for binarity. Due to the faintness of this white dwarf
(), no published proper-motion is available, however we were able to
calculate a moderate proper-motion of mas yr-1using two imaging epochs from
SDSS (2000.3154 and 2003.8123), and one from Pan-STARRS (2013.5689). Searching
nearby stars for binary membership revealed an obvious companion 27 arcseconds
to the North-West. Based on its colours, the companion is a mid-to-late M-type
star () with proper-motion mas yr-1. At an estimated distance of pc (Paper I),
this implies a projected separation of au.
While 70 percent of the DZs in our sample have proper motion measurements, we find no evidence for wide companions to any of the white dwarfs further to SDSS J08074930 and SDSS J09162540. Therefore these two systems provide a strong case that binarity is correlated with higher than average accretion rates. We also note that WD 1425+540, recently analysed by Xu et al. (2017), is also a member of wide binary, where the companion is speculated to have provided the perturbations leading to the accretion of a Kuiper-belt-like object by the white dwarf. In the context of systems like WD 1425+540, Stephan et al. (2017) also found the Kozai-Lidov mechanism as a feasible way to scatter long-period objects (i.e. Kuiper-belt analogue objects) towards white dwarfs. While we find no evidence of volatile elements (C, N, S) in the atmospheres of either SDSS J08074930 or SDSS J09162540, Stephan et al. (2017) found that wide-companions raise the likelihood of accretion from icy-bodies, particularly for low-mass companions as with the two wide binaries we observe here.
SDSS J07364118
Of the four outliers, SDSS J07364118 is the only system with no obvious
property naturally explaining its high Ca abundance in Fig. 9.
However of the four objects, it is also the least extreme ( Gyr, dex). Therefore it may simply be the case that
SDSS J07364118 has accreted its atmospheric metals much more recently
than other systems in our sample or even that accretion is still ongoing.
6 Conclusions
The cool white dwarf sample that we first presented in Hollands et al. (2017), contains a wealth of information on the compositions and evolution of planetary objects around white dwarfs.
The white dwarf spectra show lines of Ca, Mg, and Fe, and in some cases also Na, Cr, Ti or Ni. Relative abundances for each of these elements demonstrate that the compositions of exoplanetary debris is diverse. In particular we identify clear signs of differentiation in several systems, with abundance patterns closely matching crust- and core- like material. Using a simple technique to estimate mass-fractions of crust/mantle/core material, we show that our most extreme systems, as well as 22 exoplanetesimals compiled from the literature range from crust-like to core-like with mixed crust+mantle+core systems in between, but there is, as expected, a dearth of systems consistent with crust+core but lacking a mantle component. From this analysis we also conclude that two of our systems, SDSS J07413146 and SDSS J08230546, have accreted the most core-like exoplanetesimals discovered to date.
This sample of cool white dwarfs also spans a wide range in cooling ages from 1 to almost 8 Gyr. We show that the diminishing amount of metal pollution with increasing age may provide evidence for the slow decay in the sizes of remnant planetary systems as the largest planetesimals are scattered away. This occurs on an e-folding time-scale of about Gyr, an effect that previously escaped notice due to selection bias towards younger systems that do not sufficiently sample changes on this time-scale.
Finally we find that the only two confirmed binary members in our sample, exhibit enhanced metal abundances compared to other objects of similar cooling-ages. This provides convincing evidence that white dwarfs in binary systems experience higher than average accretion rates of exoplanetesimals, as a result of dynamical instabilities that have been previously argued for theoretically.
Acknowledgements
MH acknowledges useful discussions with Amy Bonsor on the lifetimes of remnant planetary systems, Oliver Shorttle on iron to calcium ratios, and Dimitri Veras for many insightful conservations on the breakup of asteroids with high tensile strength. MH also acknowledges funding from the University of Warwick Chancellor’s fellowship. Ben Zuckerman is acknowledged for providing valuable comments to the benefit of the manuscript. The anonymous referee is acknowledged for useful feedback which greatly improved the introduction to this work. The research leading to these results has received funding from the European Research Council under the European Union’s Seventh Framework Programme (FP/2007-2013) / ERC Grant Agreement n. 320964 (WDTracer). Funding for the Sloan Digital Sky Survey IV has been provided by the Alfred P. Sloan Foundation, the U.S. Department of Energy Office of Science, and the Participating Institutions. SDSS- IV acknowledges support and resources from the Center for High-Performance Computing at the University of Utah. The SDSS web site is www.sdss.org. This work makes use of observations made with the William Herschel Telescope operated on the island of La Palma by the Isaac Newton Group in the Spanish Observatorio del Roque de los Muchachos of the Instituto de Astrofisica de Canarias.
References
- Aannestad & Sion (1985) Aannestad P. A., Sion E. M., 1985, AJ, 90, 1832
- Aannestad et al. (1993) Aannestad P. A., Kenyon S. J., Hammond G. L., Sion E. M., 1993, AJ, 105, 1033
- Alam et al. (2015) Alam S., et al., 2015, ApJS, 219, 12
- Allard et al. (2016) Allard N. F., Leininger T., Gadéa F. X., Brousseau-Couture V., Dufour P., 2016, A&A, 588, A142
- Barber et al. (2016) Barber S. D., Belardi C., Kilic M., Gianninas A., 2016, MNRAS, 459, 1415
- Becklin et al. (2005) Becklin E. E., Farihi J., Jura M., Song I., Weinberger A. J., Zuckerman B., 2005, ApJ Lett., 632, L119
- Bergeron et al. (2001) Bergeron P., Leggett S. K., Ruiz M., 2001, ApJS, 133, 413
- Bergeron et al. (2011) Bergeron P., et al., 2011, ApJ, 737, 28
- Bergfors et al. (2014) Bergfors C., Farihi J., Dufour P., Rocchetto M., 2014, MNRAS, 444, 2147
- Bonsor & Veras (2015) Bonsor A., Veras D., 2015, MNRAS, 454, 53
- Brinkworth et al. (2009) Brinkworth C. S., Gänsicke B. T., Marsh T. R., Hoard D. W., Tappert C., 2009, ApJ, 696, 1402
- Brinkworth et al. (2012) Brinkworth C. S., Gänsicke B. T., Girven J. M., Hoard D. W., Marsh T. R., Parsons S. G., Koester D., 2012, ApJ, 750, 86
- Brown et al. (2017) Brown J. C., Veras D., Gänsicke B. T., 2017, MNRAS, 468, 1575
- Burleigh et al. (2002) Burleigh M. R., Clarke F. J., Hodgkin S. T., 2002, MNRAS, 331, L41
- Carry (2012) Carry B., 2012, Planet. Space Sci., 73, 98
- Catalán et al. (2008) Catalán S., Isern J., García-Berro E., Ribas I., 2008, MNRAS, 387, 1693
- Charbonneau et al. (2002) Charbonneau D., Brown T. M., Noyes R. W., Gilliland R. L., 2002, ApJ, 568, 377
- Davidsson (1999) Davidsson B. J. R., 1999, Icarus, 142, 525
- Debes & Sigurdsson (2002) Debes J. H., Sigurdsson S., 2002, ApJ, 572, 556
- Debes et al. (2011) Debes J. H., Hoard D. W., Kilic M., Wachter S., Leisawitz D. T., Cohen M., Kirkpatrick J. D., Griffith R. L., 2011, ApJ, 729, 4
- Debes et al. (2012) Debes J. H., Walsh K. J., Stark C., 2012, ApJ, 747, 148
- Dennihy et al. (2016) Dennihy E., Debes J. H., Dunlap B. H., Dufour P., Teske J. K., Clemens J. C., 2016, ApJ, 831, 31
- Dufour et al. (2007) Dufour P., et al., 2007, ApJ, 663, 1291
- Dufour et al. (2012) Dufour P., Kilic M., Fontaine G., Bergeron P., Melis C., Bochanski J., 2012, ApJ, 749, 6
- Duncan & Lissauer (1998) Duncan M. J., Lissauer J. J., 1998, Icarus, 134, 303
- Dupuis et al. (1993) Dupuis J., Fontaine G., Wesemael F., 1993, ApJS, 87, 345
- Farihi (2009) Farihi J., 2009, MNRAS, 398, 2091
- Farihi (2016) Farihi J., 2016, New Astron. Rev., 71, 9
- Farihi et al. (2008) Farihi J., Zuckerman B., Becklin E. E., 2008, ApJ, 674, 431
- Farihi et al. (2010a) Farihi J., Barstow M. A., Redfield S., Dufour P., Hambly N. C., 2010a, MNRAS, 404, 2123
- Farihi et al. (2010b) Farihi J., Jura M., Lee J., Zuckerman B., 2010b, ApJ, 714, 1386
- Farihi et al. (2011) Farihi J., Brinkworth C. S., Gänsicke B. T., Marsh T. R., Girven J., Hoard D. W., Klein B., Koester D., 2011, ApJ Lett., 728, L8
- Farihi et al. (2012) Farihi J., Gänsicke B. T., Steele P. R., Girven J., Burleigh M. R., Breedt E., Koester D., 2012, MNRAS, 421, 1635
- Farihi et al. (2013) Farihi J., Gänsicke B. T., Koester D., 2013, Science, 342, 218
- Farihi et al. (2016) Farihi J., Koester D., Zuckerman B., Vican L., Gänsicke B. T., Smith N., Walth G., Breedt E., 2016, MNRAS
- Fontaine et al. (2001) Fontaine G., Brassard P., Bergeron P., 2001, PASP, 113, 409
- Friedrich et al. (2004) Friedrich S., Jordan S., Koester D., 2004, A&A, 424, 665
- Gänsicke et al. (2006) Gänsicke B. T., Marsh T. R., Southworth J., Rebassa-Mansergas A., 2006, Science, 314, 1908
- Gänsicke et al. (2012) Gänsicke B. T., Koester D., Farihi J., Girven J., Parsons S. G., Breedt E., 2012, MNRAS, 424, 333
- Gänsicke et al. (2016) Gänsicke B. T., et al., 2016, ApJ, 818, L7
- Gary et al. (2017) Gary B. L., Rappaport S., Kaye T. G., Alonso R., Hambschs F.-J., 2017, MNRAS, 465, 3267
- Gentile Fusillo et al. (2017) Gentile Fusillo N. P., Gänsicke B. T., Farihi J., Koester D., Schreiber M. R., Pala A. F., 2017, MNRAS, 468, 971
- Girven et al. (2012) Girven J., Brinkworth C. S., Farihi J., Gänsicke B. T., Hoard D. W., Marsh T. R., Koester D., 2012, ApJ, 749, 154
- Graham et al. (1990) Graham J. R., Matthews K., Neugebauer G., Soifer B. T., 1990, ApJ, 357, 216
- Hamers & Portegies Zwart (2016) Hamers A. S., Portegies Zwart S. F., 2016, MNRAS, 462, L84
- Hardersen et al. (2005) Hardersen P. S., Gaffey M. J., Abell P. A., 2005, Icarus, 175, 141
- Haywood et al. (2013) Haywood M., Di Matteo P., Lehnert M. D., Katz D., Gómez A., 2013, A&A, 560, A109
- Holberg & Bergeron (2006) Holberg J. B., Bergeron P., 2006, AJ, 132, 1221
- Hollands et al. (2017) Hollands M. A., Koester D., Alekseev V., Herbert E. L., Gänsicke B. T., 2017, MNRAS, 467, 4970
- Jura (2003) Jura M., 2003, ApJ Lett., 584, L91
- Jura & Young (2014) Jura M., Young E. D., 2014, Annual Review of Earth and Planetary Sciences, 42, 45
- Jura et al. (2007) Jura M., Farihi J., Zuckerman B., Becklin E. E., 2007, AJ, 133, 1927
- Jura et al. (2012) Jura M., Xu S., Klein B., Koester D., Zuckerman B., 2012, ApJ, 750, 69
- Kawka & Vennes (2014) Kawka A., Vennes S., 2014, MNRAS, 439, L90
- Kawka & Vennes (2016) Kawka A., Vennes S., 2016, MNRAS, 458, 325
- Kepler et al. (2015) Kepler S. O., et al., 2015, MNRAS, 446, 4078
- Kepler et al. (2016) Kepler S. O., et al., 2016, MNRAS, 455, 3413
- Kilic et al. (2005) Kilic M., von Hippel T., Leggett S. K., Winget D. E., 2005, ApJ Lett., 632, L115
- Kilic et al. (2012) Kilic M., Patterson A. J., Barber S., Leggett S. K., Dufour P., 2012, MNRAS, 419, L59
- Klein et al. (2010) Klein B., Jura M., Koester D., Zuckerman B., Melis C., 2010, ApJ, 709, 950
- Klein et al. (2011) Klein B., Jura M., Koester D., Zuckerman B., 2011, ApJ, 741, 64
- Knox (1970) Knox Jr. R., 1970, Meteoritics, 5
- Koester (2009) Koester D., 2009, A&A, 498, 517
- Koester & Kepler (2015) Koester D., Kepler S. O., 2015, A&A, 583, A86
- Koester & Wilken (2006) Koester D., Wilken D., 2006, A&A, 453, 1051
- Koester et al. (2005) Koester D., Rollenhagen K., Napiwotzki R., Voss B., Christlieb N., Homeier D., Reimers D., 2005, A&A, 432, 1025
- Koester et al. (2011) Koester D., Girven J., Gänsicke B. T., Dufour P., 2011, A&A, 530, A114
- Koester et al. (2014) Koester D., Gänsicke B. T., Farihi J., 2014, A&A, 566, A34
- Kowalski & Saumon (2006) Kowalski P. M., Saumon D., 2006, ApJ Lett., 651, L137
- Kreidberg et al. (2014a) Kreidberg L., et al., 2014a, Nat, 505, 69
- Kreidberg et al. (2014b) Kreidberg L., et al., 2014b, ApJ Lett., 793, L27
- Kresak (1977) Kresak L., 1977, Bulletin of the Astronomical Institutes of Czechoslovakia, 28, 65
- Lissauer et al. (2011) Lissauer J. J., et al., 2011, Nat, 470, 53
- Matter et al. (2013) Matter A., Delbo M., Carry B., Ligori S., 2013, Icarus, 226, 419
- McDonough (2000) McDonough W., 2000, in Teisseyre R., Majewski E., eds, Earthquake Thermodynamics and Phase Transformation in the Earth’s Interior. Elsevier Science Academic Press, pp 5–24
- Melis & Dufour (2017) Melis C., Dufour P., 2017, ApJ, 834, 1
- Melis et al. (2010) Melis C., Jura M., Albert L., Klein B., Zuckerman B., 2010, ApJ, 722, 1078
- Melis et al. (2011) Melis C., Farihi J., Dufour P., Zuckerman B., Burgasser A. J., Bergeron P., Bochanski J., Simcoe R., 2011, ApJ, 732, 90
- Moynier et al. (2011) Moynier F., Yin Q.-Z., Schauble E., 2011, Science, 331, 1417
- Mustill et al. (2014) Mustill A. J., Veras D., Villaver E., 2014, MNRAS, 437, 1404
- Opik (1958) Opik E. J., 1958, Physics of meteor flight in the atmosphere.. New York, Interscience Publishers, 1958.
- Ostro (1985) Ostro S. J., 1985, PASP, 97, 877
- Oswalt et al. (1996) Oswalt T. D., Smith J. A., Wood M. A., Hintzen P., 1996, Nat, 382, 692
- Palme & O’Neill (2003) Palme H., O’Neill H. S. C., 2003, Treatise on Geochemistry, 2, 568
- Paquette et al. (1986) Paquette C., Pelletier C., Fontaine G., Michaud G., 1986, ApJS, 61, 197
- Petrovic (2001) Petrovic J. J., 2001, Journal of Materials Science, 36, 1579
- Petrovich & Muñoz (2017) Petrovich C., Muñoz D. J., 2017, ApJ, 834, 116
- Raddi et al. (2015) Raddi R., Gänsicke B. T., Koester D., Farihi J., Hermes J. J., Scaringi S., Breedt E., Girven J., 2015, MNRAS, 450, 2083
- Rafikov (2011) Rafikov R. R., 2011, ApJ Lett., 732, L3
- Redfield et al. (2017) Redfield S., Farihi J., Cauley P. W., Parsons S. G., Gänsicke B. T., Duvvuri G. M., 2017, ApJ, 839, 42
- Rocchetto et al. (2015) Rocchetto M., Farihi J., Gänsicke B. T., Bergfors C., 2015, MNRAS, 449, 574
- Rogers & Seager (2010) Rogers L. A., Seager S., 2010, ApJ, 712, 974
- Rudnick & Gao (2003) Rudnick R. L., Gao S., 2003, Treatise on Geochemistry, 3, 659
- Sackmann et al. (1993) Sackmann I.-J., Boothroyd A. I., Kraemer K. E., 1993, ApJ, 418, 457
- Salaris (2009) Salaris M., 2009, in Mamajek E. E., Soderblom D. R., Wyse R. F. G., eds, IAU Symposium Vol. 258, The Ages of Stars. pp 287–298, doi:10.1017/S1743921309031937
- Schatzman (1947) Schatzman E., 1947, A&A, 10, 19
- Schröder & Connon Smith (2008) Schröder K.-P., Connon Smith R., 2008, MNRAS, 386, 155
- Sion et al. (1983) Sion E. M., Greenstein J. L., Landstreet J. D., Liebert J., Shipman H. L., Wegner G. A., 1983, ApJ, 269, 253
- Slyuta (2013) Slyuta E. N., 2013, Solar System Research, 47, 109
- Slyuta & Voropaev (1997) Slyuta E. N., Voropaev S. A., 1997, Icarus, 129, 401
- Stephan et al. (2017) Stephan A. P., Naoz S., Zuckerman B., 2017, ApJ Lett., 844, L16
- Swain et al. (2008) Swain M. R., Vasisht G., Tinetti G., 2008, Nat, 452, 329
- Vanderburg et al. (2015) Vanderburg A., et al., 2015, Nat, 526, 546
- Vennes & Kawka (2013) Vennes S., Kawka A., 2013, ApJ, 779, 70
- Vennes et al. (2011) Vennes S., Kawka A., Németh P., 2011, MNRAS, 413, 2545
- Veras (2016) Veras D., 2016, Royal Society Open Science, 3, 150571
- Veras et al. (2013) Veras D., Mustill A. J., Bonsor A., Wyatt M. C., 2013, MNRAS, 431, 1686
- Veras et al. (2014) Veras D., Leinhardt Z. M., Bonsor A., Gänsicke B. T., 2014, MNRAS, 445, 2244
- Veras et al. (2015) Veras D., Eggl S., Gänsicke B. T., 2015, MNRAS, 451, 2814
- Veras et al. (2016) Veras D., Mustill A. J., Gänsicke B. T., Redfield S., Georgakarakos N., Bowler A. B., Lloyd M. J. S., 2016, MNRAS, 458, 3942
- Veras et al. (2017) Veras D., Georgakarakos N., Dobbs-Dixon I., Gänsicke B. T., 2017, MNRAS, 465, 2053
- Wesemael (1979) Wesemael F., 1979, A&A, 72, 104
- Wilson & Matteucci (1992) Wilson T. L., Matteucci F., 1992, A&AR, 4, 1
- Wilson et al. (2015) Wilson D. J., Gänsicke B. T., Koester D., Toloza O., Pala A. F., Breedt E., Parsons S. G., 2015, MNRAS, 451, 3237
- Wyatt et al. (2014) Wyatt M. C., Farihi J., Pringle J. E., Bonsor A., 2014, MNRAS, 439, 3371
- Xu et al. (2013) Xu S., Jura M., Klein B., Koester D., Zuckerman B., 2013, ApJ, 766, 132
- Xu et al. (2014) Xu S., Jura M., Koester D., Klein B., Zuckerman B., 2014, ApJ, 783, 79
- Xu et al. (2016) Xu S., Jura M., Dufour P., Zuckerman B., 2016, ApJ Lett., 816, L22
- Xu et al. (2017) Xu S., Zuckerman B., Dufour P., Young E. D., Klein B., Jura M., 2017, ApJ Lett., 836, L7
- York et al. (2000) York D. G., et al., 2000, AJ, 120, 1579
- Zuckerman & Becklin (1987) Zuckerman B., Becklin E. E., 1987, Nat, 330, 138
- Zuckerman et al. (2003) Zuckerman B., Koester D., Reid I. N., Hünsch M., 2003, ApJ, 596, 477
- Zuckerman et al. (2007) Zuckerman B., Koester D., Melis C., Hansen B. M., Jura M., 2007, ApJ, 671, 872
- Zuckerman et al. (2010) Zuckerman B., Melis C., Klein B., Koester D., Jura M., 2010, ApJ, 722, 725
- Zuckerman et al. (2011) Zuckerman B., Koester D., Dufour P., Melis C., Klein B., Jura M., 2011, ApJ, 739, 101
- del Peloso et al. (2005) del Peloso E. F., da Silva L., Arany-Prado L. I., 2005, A&A, 434, 301
- von Hippel et al. (2007) von Hippel T., Kuchner M. J., Kilic M., Mullally F., Reach W. T., 2007, ApJ, 662, 544