Stellar Halos in Illustris: Probing the Histories of Milky Way-Mass Galaxies
Abstract
The existence of stellar halos around galaxies is a natural prediction of the hierarchical nature of the CDM model. Recent observations of Milky Way-like galaxies have revealed a wide range in stellar halo mass, including cases with no statistically significant detection of a stellar halo, as in the case of M101, NGC3351 and NGC1042. We use the Illustris simulation to investigate the scatter in stellar halo content and, in particular, to study the formation of galaxies with the smallest fraction of this diffuse component. Stellar halos are far from spherical, which diminishes the surface brightness of the stellar halo for face-on disks. Once accounting for projection effects, we find that the stellar halo fraction correlates strongly with galaxy morphology and star formation rate, but not with environment, in agreement with observations. Galaxies with the lowest stellar halo fractions are disk-dominated, star-forming and assemble their dark matter halos on average earlier than galaxies with similar stellar masses. Accreted satellites are also lower in stellar mass and have earlier infall times than centrals with high . In situ rather than accreted stars dominate the stellar halos of galaxies with the lowest stellar halo fractions, with a transition radius from in situ to accretion-dominated kpc. Our results extrapolated to real galaxies such as M101 may indicate that these galaxies inhabit old halos which endured mergers only at higher redshifts and evolved relatively unperturbed in the last Gyrs.
keywords:
galaxies: stellar haloes - galaxies: simulation - galaxies: evolution .1 Introduction
Stars can be found out to very large distances away from the center of galaxies and certainly well beyond their optical radii. This extended and diffuse stellar component –the stellar halo– is typically composed of metal poor stars that are often distributed inhomogeneously and present substructures in both configuration as well as in velocity space. This phase-space coherence was predicted early by cosmological models of galaxy assembly (Johnston et al., 1996; Johnston, 1998; Helmi & White, 1999; Bullock et al., 2001) and also found in observations of stellar moving groups in the Milky Way (Ibata et al., 2014, 1994; Shapley, 1938; Willman et al., 2005) as well as in several tidal streams (Lynden-Bell & Lynden-Bell, 1995; Belokurov et al., 2006; Grillmair, 2009). In fact, within the leading cosmological framework Lambda Cold Dark Matter (CDM), stellar halos are the natural outcome of the galaxy formation process where galaxies form hierarchically by aggregating smaller ones (White & Rees, 1978; White, 1996). The disruption of these satellite galaxies deposits stellar debris in the outskirts of the galactic domain of the host galaxy, building up and shaping the stellar halo component. Stellar halos carry information on the properties of satellite galaxies that no longer exist and on the assembly history of the host galaxy. Because they are extended (they can reach kpc and beyond for galaxies), dynamical times are long, and tidal features such as streams and shells –records of past disruptions– can survive for very long timescales (Helmi & White, 1999; Bullock & Johnston, 2005), making stellar halos invaluable proof of the cosmological model.
The stellar halos of our own Milky Way and closest neighboring galaxy M31 have been studied most extensively. In particular, our own Galaxy offers an advantageous view from where to select halo stars with precise photometry and kinematics either within the solar neighbourhood (by specific cuts in metallicity and or kinematics, e.g. Eggen et al., 1962; Chiba & Beers, 2000; Helmi et al., 2017) or by looking to stars that are beyond the confines of the disk (Morrison et al., 2000; Fernández-Trincado et al., 2015). Photometric campaigns such as that of SDSS/SEGUE have played a fundamental role in building our current understanding of the Galactic stellar halo by revealing a rich level of substructure where streams and overdensities abound (Belokurov et al., 2006; Bell et al., 2008; Jurić et al., 2008; Odenkirchen et al., 2001; Grillmair & Johnson, 2006). Deep observations of our closest neighbour M31 by the PAndAS survey (McConnachie et al., 2009) also reveal a complex stellar halo structure with a massive stream dominating most of the light, but with several other substructures easily identifiable (Ibata et al., 2014; Ferguson et al., 2002; Tanaka et al., 2010). An unexpected conclusion of these studies is that the stellar halo of M31 is significantly more massive than that of our own Galaxy: compared to , with possible interpretations pointing to a more active merging history for M31 than for the Milky Way. Stellar halos may therefore also provide an avenue to reconstruct the past merger history of galaxies once the link between the galaxy build-up and its stellar halo structure, mass and shape is fully understood.
The large number of substructures seen in the Milky Way and Andromeda serves as confirmation that accretion events are responsible to a large extent for the build up of our stellar halo. However, kinematics and metallicity analysis of stars suggest a more complex structure for the stellar halo where more than one component is needed (Carollo et al., 2007; Deason et al., 2013; Carollo et al., 2010; Tissera et al., 2014), including some hints that the inner stellar halos may have a significant contribution from in situ stars (Gilbert et al., 2014; Reitzel & Guhathakurta, 2002; Bonaca et al., 2017), as opposed to the common view of an accreted origin for stellar halos. The mechanisms able to propel in situ born stars onto more external orbits are not yet well understood, nor has a convincing way been demonstrated to observationally distinguish between these two possible origins for halo stars in external galaxies.
Clearly, a complete understanding of stellar halos will come from surveying more galaxies beyond the Local Group. Such observations are challenging due to the associated low surface brightness in these halos. For instance, if one were to place a Milky Way-like stellar halo uniformly in a sphere of radius kpc it would have a stellar surface density of in projection, which means that we would need to reach levels of 30.9 mag/arcsec2 to detect it. Although this calculation is only approximate (in the sense that stars will distribute in some power law and not homogeneously and also in that it ignores substructures), it provides a good intuition about the high sensitivity needed in observations of extragalactic stellar halos.
A clever way to circumvent this limitation is by means of stacking images of thousands galaxies and their halos (e.g., Zibetti et al., 2004; Tal & van Dokkum, 2011; D’Souza et al., 2014). Another possibility is detailed observations of a handful of galaxies with HST, such as the approach taken by the GHOSTS survey (Radburn-Smith et al., 2011; Monachesi et al., 2016), for which random fields across the halo are selected providing information on localized regions with resolved stellar populations. More recently, the availability of telescopes with full time dedication have allowed the mapping of several stellar halos by very long exposures. Such is the case of the Dragonfly telescope (Abraham & van Dokkum, 2014; van Dokkum et al., 2014; Merritt et al., 2016) or the HERON survey (Rich et al., 2017) reaching an unprecedented depth up to - mag/arcsec2, in an extension of a technique used previously to uncover several extragalactic streams (Martínez-Delgado et al., 2010; Tal et al., 2009).
The emergent picture from all these recent studies, in agreement with the already detected differences between the Milky Way and M31 halos, is a wide diversity in the amount, shape and gradients of stellar halos among different galaxies (Monachesi et al., 2016; Harmsen et al., 2017; Merritt et al., 2016). Even within the limited sample of deep observations that is currently available, some intriguing cases have already arisen. In particular, the apparent non-detection of M101’s stellar halo by van Dokkum et al. (2014) is at odds with the predictions from CDM. How can a galaxy avoid merging and disrupting satellites throughout its entire history?. Furthermore, Merritt et al. (2016) present two additional cases, NGC1042 and NGC3351 together with M101, among their eight galaxies with comparable stellar mass to the Milky Way which are also consistent with no stellar halo component down to mag/arcsec2. This apparent lack of stellar halo, if proven not to be an observational artifact, seems not uncommon in the galaxy population and is therefore an interesting puzzle to be explored within the current models of galaxy formation.
Numerical simulations have shown remarkable successes at reproducing several of the properties of stellar halos as well as at providing insights into stellar halo formation (e.g., Abadi et al., 2006; Abadi et al., 2003a, b; De Lucia & Helmi, 2008; Cooper et al., 2013; Tissera et al., 2014; Pillepich et al., 2015, 2014; Amorisco, 2017). Recent simulations have shown that theoretical models also predict that the stellar halo consists not only of a component accreted through mergers but also of an in situ component made of stars that were formed locally in the host galaxy. The exact origin and fractions of in situ stars in the stellar halo is not completely agreed upon. In situ stars have been shown to dominate the inner regions of the stellar halo and be displaced early in a galaxy’s history by dynamical processes such as mergers (Pillepich et al., 2015; Zolotov et al., 2009; Tissera et al., 2014; McCarthy et al., 2012). By contrast Cooper et al. (2015) find that the majority are formed as a result of the gas stripped from infalling satellites. In situ stars have also been claimed to be born in the stellar halo directly in localized condensations of gas (Tissera et al., 2013). As different mechanisms are responsible for the accreted and in situ components, one needs to address both in order to understand: (i) how diversity in stellar halos arises and (ii) specifically inspired by recent observations, how a galaxy continues to assemble without growing its stellar halo. A promising avenue to make progress on this question is to study the emergent stellar halos in a large statistical ensemble of galaxy assembly paths and merger histories predicted by CDM.
In this paper we take such an approach by using the large-volume cosmological hydrodynamical simulation Illustris (Vogelsberger et al. 2014a,Vogelsberger et al. 2014b,Genel et al. 2014). Illustris is an ideal tool to tackle this problem since it provides a sample of central galaxies of mass comparable to the Milky Way with predictions for both their dark matter as well as baryonic assembly. This sample thus provides an unbiased view of stellar halo formation, allowing further inspection of dependencies on accretion history, environment and morphology of the central galaxy among others. Although we sacrifice spatial resolution compared to a zoom-in approach (Illustris’ gravitational softening length for stars is 0.7 kpc), the nature of the main quest in this paper calls for large statistical samples and not for a detailed view of a few individual galaxies, making the analysis of a large cosmological box, such as Illustris, the most attractive strategy.
This paper is organized as follows: In Sec. 2 we briefly describe the simulations and define our samples. We explore the properties of stellar halos and their centrals in Sec. 4, with specific emphasis in the populations with the smallest and highest stellar halo fractions. We turn our attention to the in situ and accreted origin of stellar halos in Sec. 5 and summarize our findings in Sec. 6.
2 Numerical Simulations
Illustris is a cosmological hydrodynamical simulation of a representative volume of the Universe, comprising a box of size Mpc on a side that was run with the moving grid code arepo (Springel, 2010). In its high resolution version, Illustris-1, the mass per particle is and for baryons and dark matter, respectively, and a typical gravitational softening length smaller than kpc (Vogelsberger et al., 2014). The simulation is consistent with WMAP-9 standard cosmology, with =0.2726, =0.0456, =0.7274, and =70.4km/s/Mpc (Hinshaw et al., 2013). It follows gravity by means of an octree algorithm and the hydrodynamics of the gas including star formation and feedback processes that are believed to be fundamental to the reproduction of the properties of galaxies.
Gas cells can cool and heat self-consistently with a minimum temperature floor of (Vogelsberger et al., 2013). Above a density threshold of , gas follows an equation of state that is used to implicitly treat the multi-phase structure of the unresolved ISM (Springel & Hernquist, 2003). Cold and dense gas above this threshold also becomes eligible for star formation with a timescale proportional to the local density. After stars form following a Chabrier initial mass function they are evolved using Starburst99 (Leitherer et al., 1999) stellar evolution tracks. Stellar feedback is modeled kinematically, by adding of the available energy due to supernovae as momentum to surrounding gas cells. The mass loading of the wind scales inversely with the local velocity dispersion of the dark matter (Vogelsberger et al., 2013). Illustris also includes a treatment for black hole growth and feedback, including a dual quasar/radio mode (see details in Di Matteo et al., 2005; Springel et al., 2005; Sijacki et al., 2015), but given the mass range and properties studied in this paper, our conclusions are only minimally impacted by the physics of black holes. The free parameters in the model were tuned to reproduce the global star formation history of the universe and approximately follow the observed stellar mass function at . With those choices, Illustris has been proven to successfully reproduce a series of global properties of the galaxy population, such as scaling relations, morphology bimodality, color distribution, merger rates, environmental trends, among others (Genel, 2016; Rodriguez-Gomez et al., 2015; Sales et al., 2015; Sijacki et al., 2015; Snyder et al., 2015).
Halos and galaxies are identified using the subfind algorithm (Springel et al., 2001; Dolag et al., 2009). In short, groups are first identified based on a spatial-only information using the Friends of Friends (FoF) algorithm and gravitationally self-bound structures are later identified within groups by using subfind. The object sitting at the center of the gravitational potential of each halo is called the central or host galaxy and all other substructures associated with the group will be referred to as satellites or subhalos. We trace the history of each galaxy by means of the sublink merger tree algorithm introduced in Rodriguez-Gomez et al. (2015); Nelson et al. (2015) which allow the user to trace the assembly history of any subhalo for up to 13.76 Gyr.
2.1 Sample Selection
Our galaxies are selected to be comparable to the Milky Way by imposing a virial mass 111We define the virial mass, , as that enclosed by a sphere of mean density times the critical density of the Universe, . Virial quantities are defined at that radius, and are identified by a “200” subscript. cut - and selecting central galaxies only (i.e. no satellites). A total of 1115 central galaxies lie in this range. We define as a “galaxy” all stars or gas elements that are within a galactic radius defined as , where is the half-mass radius of the stars as computed by subfind. Each central galaxy has stellar particles associated to it (and gravitationally bound) all the way out to the virial radius. Stars that are located beyond that do not belong to any satellite and that are within will be assigned to the stellar halo component.
We define stellar halo fraction as:
| (1) |
where is the total stellar mass of the halo and is the stellar mass of the halo within . Although there is no consistent definition of stellar halo across the field, similar definitions have been adopted in previous studies (e.g. Pillepich et al., 2015; Merritt et al., 2016).
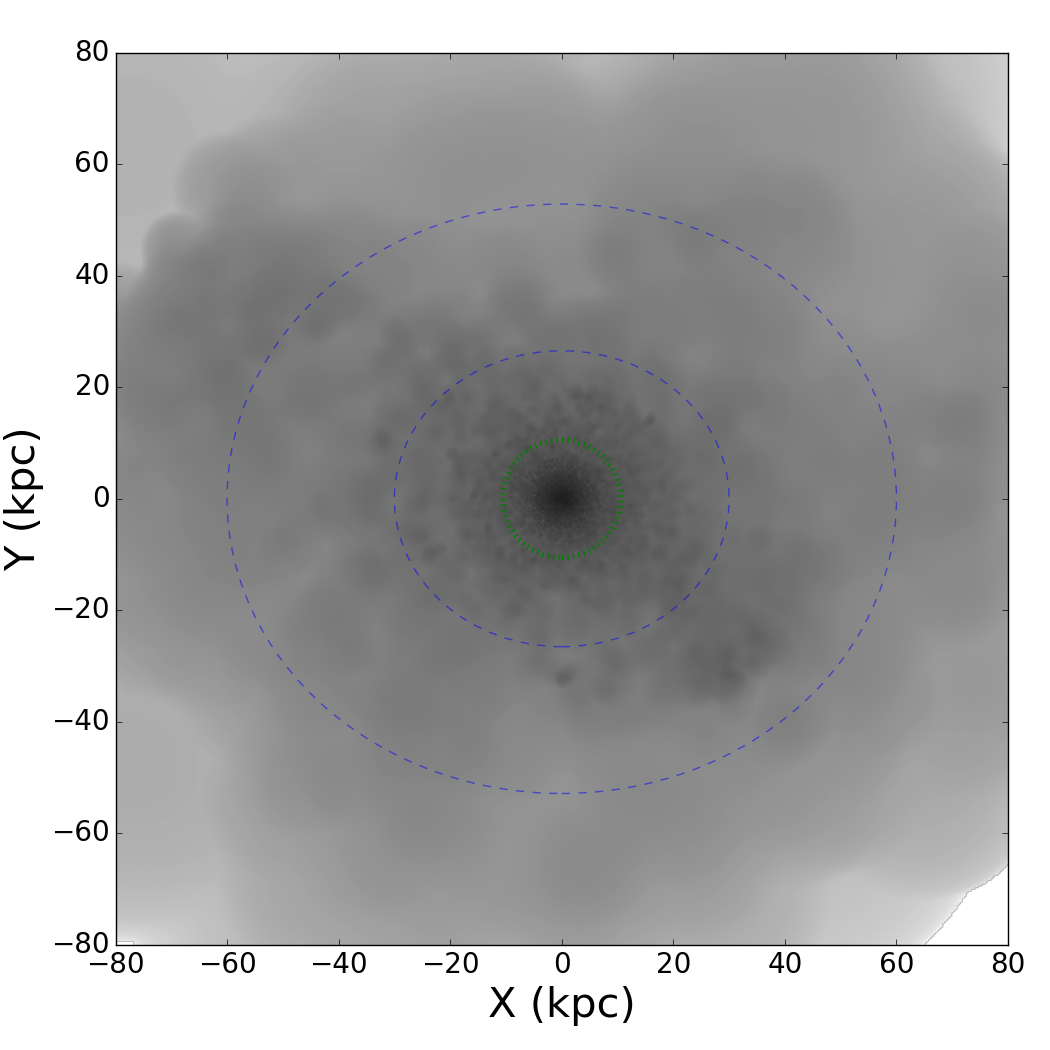
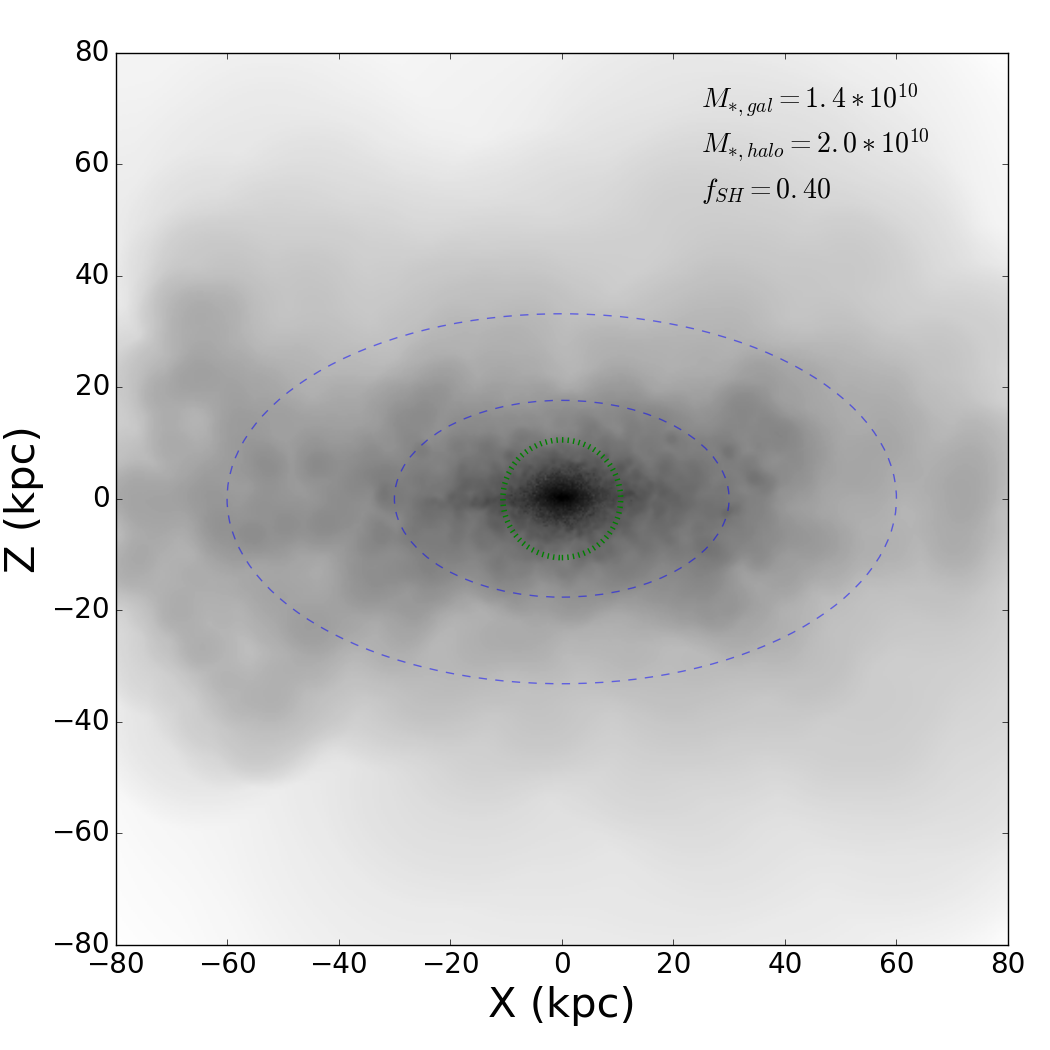
Fig. 1 shows an example of one of our simulated galaxies and its halo. Using the angular momentum vector of the central galaxy (i.e. stars within ) we define face-on (left) vs. edge-on (right) projections. Stars distribute well beyond the galaxy radius shown by the green dotted circle, forming a diffuse and extended stellar halo reaching out beyond kpc. Stellar halos are often inhomogeneous with the presence of substructure indicating the occurrence of relatively recent merger events in the past. Note that these halos are far from spherical, as indicated by the blue ellipsoids showing the inertia tensor axis-ratios for stars at two different radii (calculated with all stars outside but within the radius of interest), a subject we return to in Sec. 3.
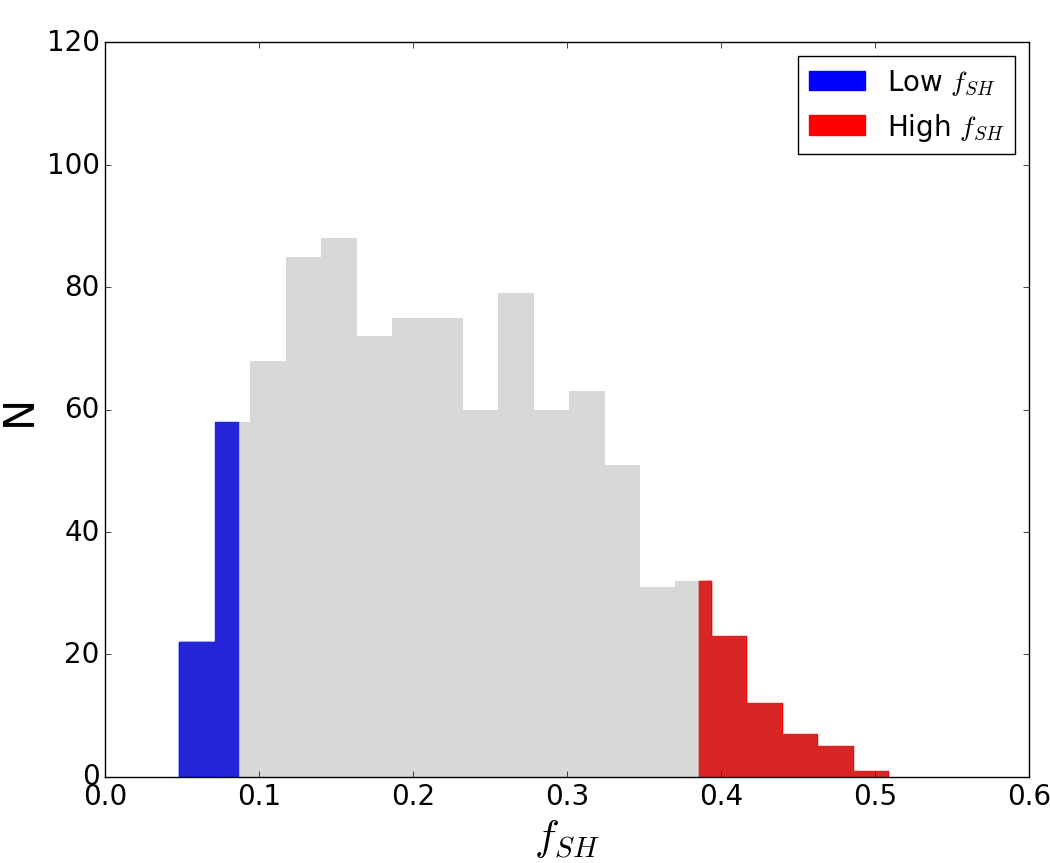
We exclude centrals that have massive satellites () within kpc from the center as well as centrals with a satellite of stellar mass anywhere within the virial radius (). These two conditions ensure that the stellar halo mass estimates will not be enhanced artificially by stars in the outskirts of satellites that are mistakenly assigned to the central by limitations of our subhalo finder. With these definitions, our sample comprises of 967 centrals and spans a wide range in stellar halo fraction, , shown in Fig. 2. Understanding the origin of such diversity is one of the main objectives of this paper. To that end, we will compare the properties and evolution of both tails of this distribution, which we will refer to as the “low/high stellar halo fraction” samples and use blue and red respectively to denote them throughout this work. The low and high samples are selected to be the tails, with a total of galaxies each.
3 Shape and surface brightness profiles of stellar halos
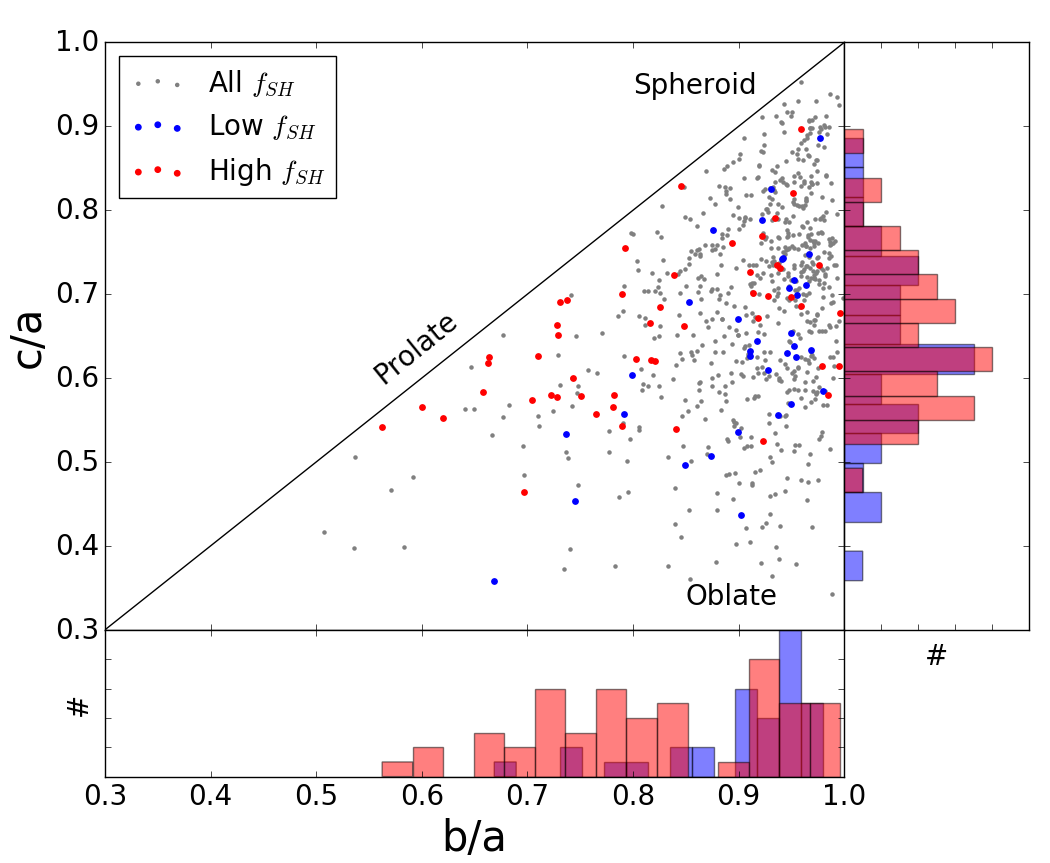
We start by quantifying the shapes of the simulated stellar halos. Fig. 3 shows the and axis ratios, where , and are the square roots of the eigenvalues corresponding to the major, intermediate and minor axes of the inertia tensor of the stars in each stellar halo of our sample. We adopt the definition from Vera-Ciro et al. (2011), for which the normalized inertia tensor is:
| (2) |
where is a distance measure to the kth star and V is the set of stars in the stellar halo. We use all stars in the stellar halo to assign a single and to each of our centrals. Fig. 3 shows that the majority of stellar halos are not spherical and, in fact, they occupy almost all available space in the axis ratios map with a slight tendency for oblated distributions (large ). This trend is stronger for galaxies with low stellar halo component than with large and is in good agreement with observational estimates of halo shapes in disky galaxies (Harmsen et al., 2017). Color coding follows from Fig. 2, with gray for the whole sample of MW-like objects and blue or red highlighting our low and high subsamples respectively. We have checked that for the cases where the central galaxy has a well-defined disk, the shapes of the stellar halos tend to align with the inner disk, as is the case in the example shown in Fig. 1.
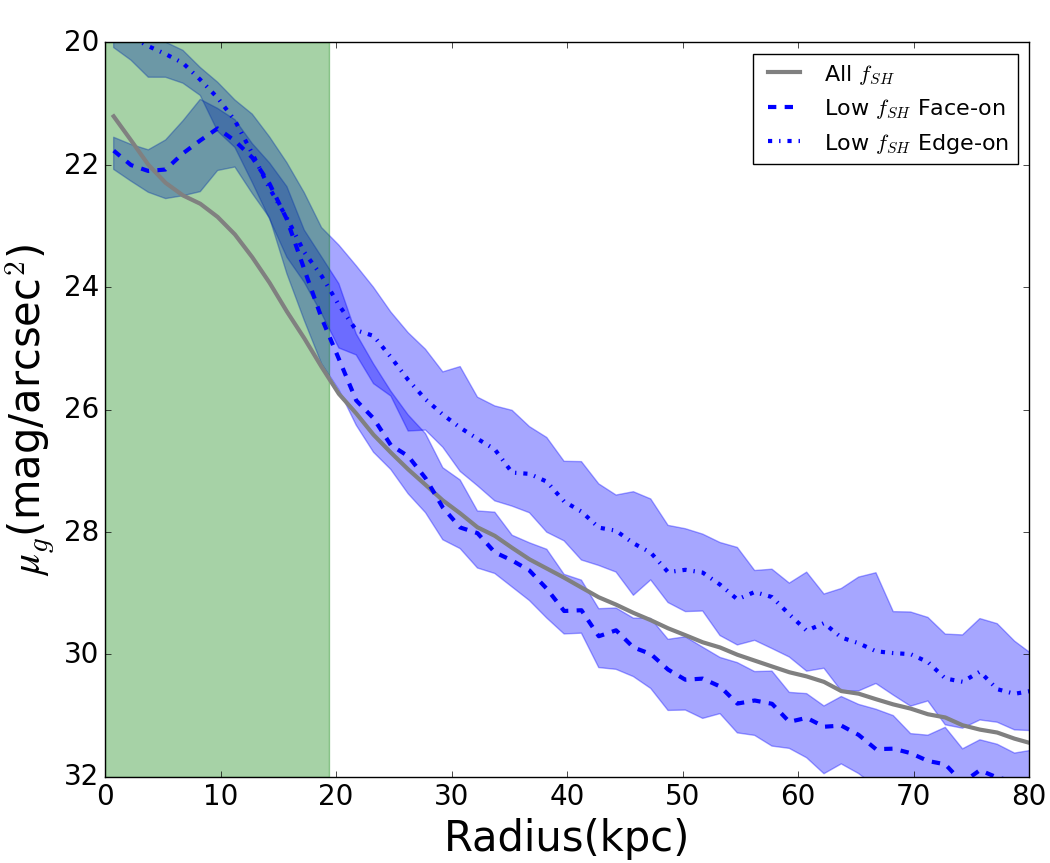
This asphericity can introduce observational biases in stellar halo studies, in particular for those which targets are selected based on inclination of the disk. Consider, for instance, an oblated distribution, . If we “observe” the object face-on, the projection will be done along the short axis rendering a considerably lower stellar density than if the object was observed edge-on where the projection is done along the more extended axes or . With the typical axis ratios found in our simulations, the effect can be sizable, as shown in Fig. 4. Thick dotted and dashed lines show the median projected mass surface density profile of our sample with low when the galaxies are all oriented face-on or edge-on, respectively, based on the angular momentum of the stars within . The profiles are computed in integrated ellipsoidal shells, with the horizontal axis showing the ellipsoidal radius as computed from the inertia tensor axis ratios ( or depending on the projection). This procedure is equivalent to the common practice in observations of measuring the axis ratios of the isodensity contours on light profiles and scaling the ellipsoidal radius accordingly.
Our tests indicate that solely changing the orientation of the projection for the same simulated objects can result in a difference of up to -band magnitudes. This effect will artificially introduce variations among observed stellar halo profiles and should be taken into account when analyzing stellar halo diversity in real galaxies. One prediction from our study is that surface brightness profiles of face-on oriented disks will be biased low with respect to a more inclined sample. Interestingly M101, a galaxy put forward by several authors as having little to no stellar halo, has an almost perfect face-on projection (inclination angle , from the HyperLEDA database (Makarov et al., 2014)). The other two cases with no stellar halos drawn from the Dragonfly study in Merritt et al. (2016), NGC1042 and NGC3351, are less clear. With inferred inclinations of and , they would show a milder effect due to projections compared to M101. A more conclusive analysis will come once more observations of galaxies and their faint stellar halos become available. For now, we just highlight the need for addressing projection effects due to stellar halo shapes and, in particular, the derived conclusions on stellar halo mass and structure.
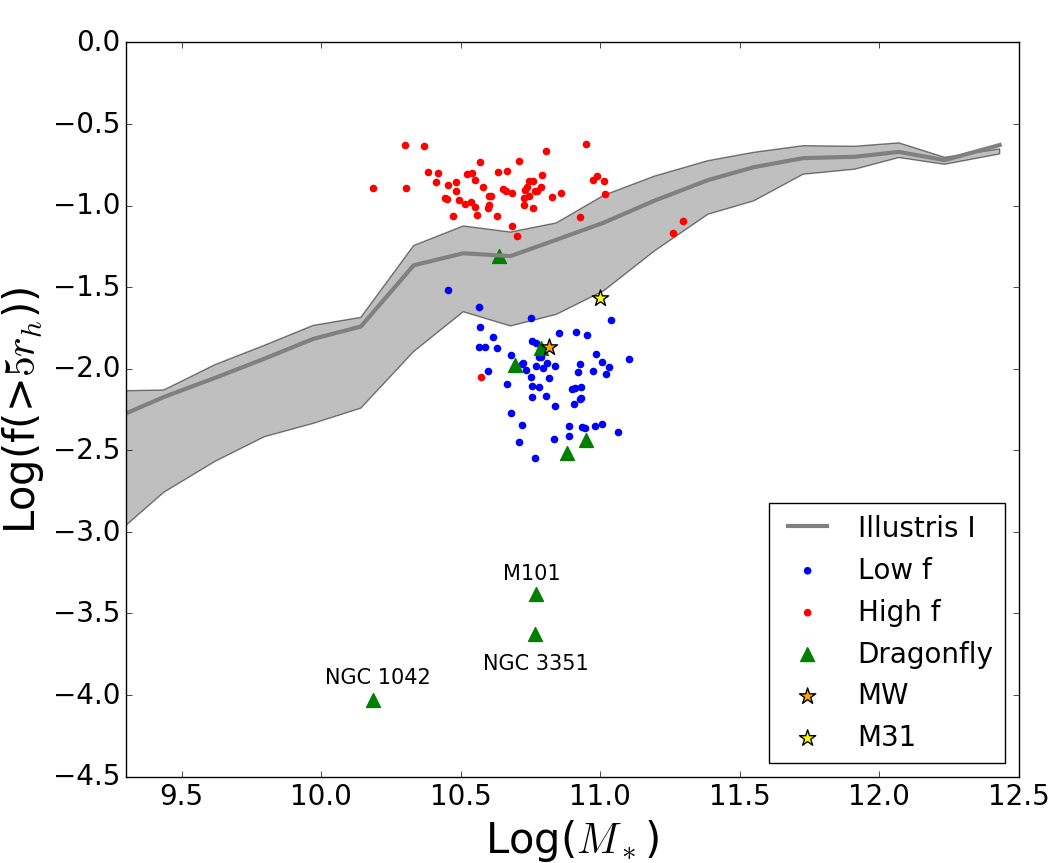
With these caveats in mind, we compare our simulated samples to available observations in Fig. 5. On the left panel we show the stellar halo fraction as a function of stellar mass of the central galaxy. To more closely match the definition introduced in Merritt et al. (2016), we consider the fraction of the stellar mass that is beyond instead of the adopted for the rest of our paper. For simplicity, this quantity in simulations is computed in 3D instead of in projection as is done in observations. The gray solid line shows the median for a representative number of central galaxies on a wide mass range in Illustris, with the shaded area corresponding to the 25th to 75th percentiles. Red and blue dots indicate the values for our low and high stellar halo fraction galaxies that according to our selection criteria cluster around MW-like objects, .
As expected, the blue and red subsamples represent the tails of the normal population, even though the selection was made using instead of . We note that there is one central from the high sample with a particularly low value of . This galaxy is undergoing a merger that is too minor to qualify for our conditions, but is affecting the subhalo finder. Results for real observed galaxies are shown in green triangles (Dragonfly) and yellow/orange starred symbols for the Milky Way and M31, respectively. Although no extreme outliers such as M101, NGC3351 and NGC1042 seem to appear in Illustris, the simulated sample occupies roughly the same region as the observed stellar halos in literature. The good agreement is particularly encouraging if one takes into account the difference in definitions (3D vs. 2D) and procedures (i.e. background subtraction) that go into computing such fractions. Simulations with low (blue) seem to better represent the observations in the mass range of overlap. As we will see in Sec. 4.1, this can be easily explained as a morphological bias in observed samples as we are considering all simulated galaxies in the mass range with no morphological cuts.
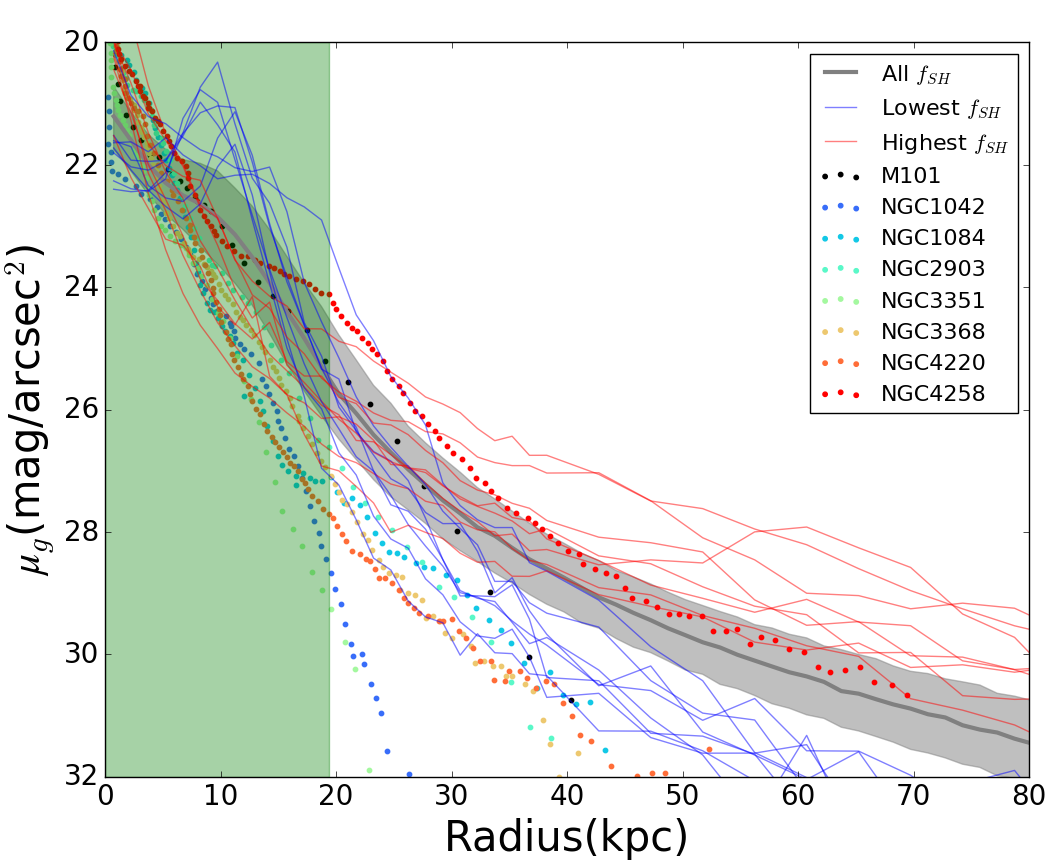
The right panel of Fig. 5 confirms that the median surface brightness profiles of simulated galaxies (shown in gray) is also in reasonable agreement with individual observations from Dragonfly (colored symbols), although there is a trend in Illustris to have slightly more massive stellar halos overall. In particular, we are unable to find good analogs to the lowest stellar halo mass objects such as M101 in Illustris. The averaged more massive stellar halos in the simulations is already hinted on the left panel of Fig. 5 and is mainly driven by the fact that observations typically target disk-dominated galaxies whereas we are including all galaxies in a halo mass range, regardless of their morphology. In addition to this, one cannot disregard the possibility that stellar halos in Illustris are overpredicted due to the over abundance of low mass galaxies in the simulation (see top right panel in Fig.2 of Genel et al. 2014), which presumably can also be tidally disrupted, contributing more stars than they should to the stellar halos. This, however, does not represent a major limitation of our analysis as the main objective is to understand the variations on the stellar halo fractions in a narrow range of halo mass, and not to exactly match individual galaxies from observations. Indeed, as highlighted in Fig. 2 and 5, the diversity shown in for our simulations is significant and comparable to observations, making Illustris and its large statistical sample a powerful tool to study the emergence of diversity in stellar halos within CDM.
4 Building the Stellar Halos’ diversity
4.1 Properties of the host galaxy
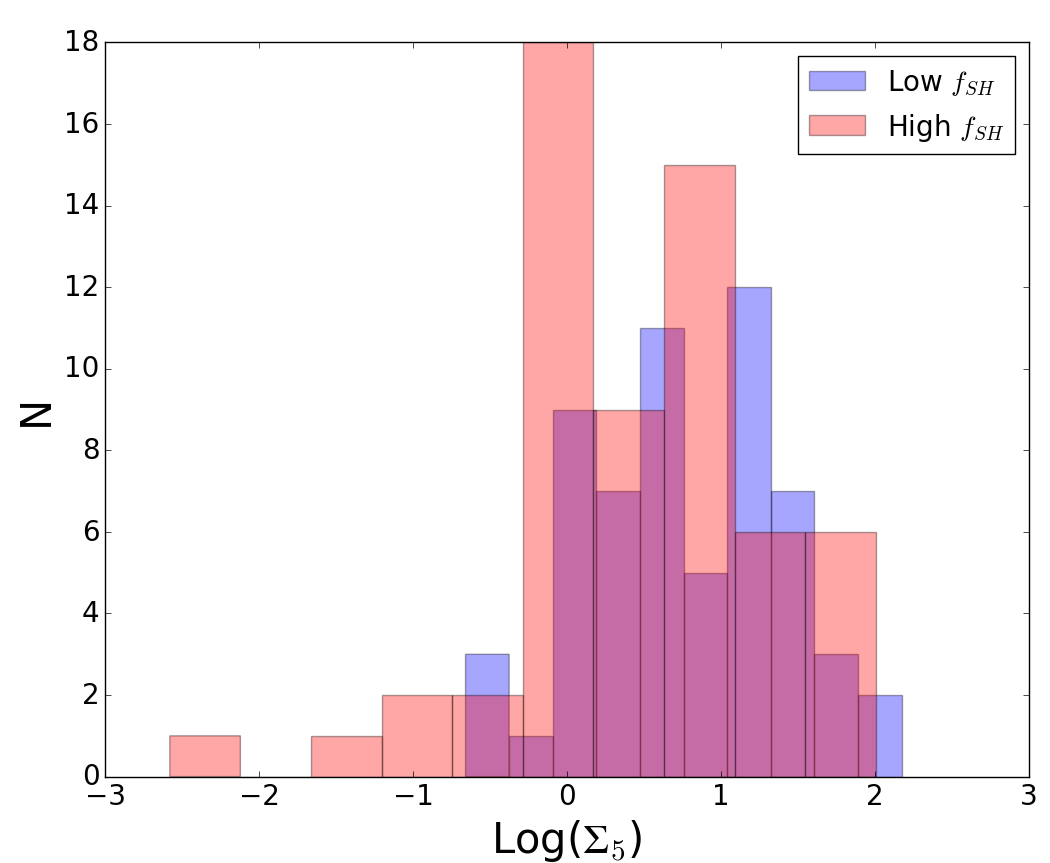
Our low/high samples are selected purely on the fraction of mass in their stellar halos compared to that of the stars in the host galaxy which is essentially blind to the properties of the central galaxy. It is therefore interesting to explore how the central galaxies in each subsample compare to each other. We start by looking at the environment of galaxies with the lowest and highest stellar halo fractions in the top panel of Fig. 6. Environment has been quantified by means of the mean stellar density , defined as the stellar mass density enclosed within the distance to the nearest neighbour with stellar mass above . In our sample, the average distance to the neighbour is Mpc. We find no significant difference between the low and high which suggests that the medium-scale vicinity of a halo at present day encodes little information on the formation of stellar halos. This lack of correlation with environment is in agreement with trends found in observations (see e.g. Merritt et al., 2016).
On the other hand, there is a clear difference in the star formation activity of centrals according to their stellar halo fraction (see bottom panel Fig. 6), with high stellar halo content centrals being preferentially non-star forming in contrast with galaxies with low which are actively forming stars. This correlation is also present in the morphology of the galaxies, with disk-dominated galaxies having on average a significantly lower fraction of stars in the stellar halo compared to the central galaxy than early-types. This can be seen in Fig. 7, where morphology is estimated following the methodology of Sales et al. (2012), as the ratio between the kinetic energy of stars in ordered motion around the -axis and the total kinetic energy of the system. Large values correspond to disk-dominated morphology, whereas a low index is indicative of spheroidal morphologies with no dominant rotation. Although the scatter is significant, the correlation between and is well defined in our sample and agrees well with the observational trends reported in stacked SDSS observations of stellar halos for galaxies of different morphological types (D’Souza et al., 2014).
The link between stellar halo content and morphology, although not completely unexpected, is still nontrivial. For MW-mass objects as analyzed here, mergers have been shown to correlate very poorly with the central morphology of the galaxy (Sales et al., 2012; Rodriguez-Gomez et al., 2017), yet they are believed to build the majority of the stellar halo. How does this correlation then get established? From Fig. 7 it is clear that the processes responsible for shaping the morphology of galaxies also have a large impact on the formation of the stellar halo. We turn our attention to the general assembly of the galaxies and their dark matter halos for further clues.
4.2 Assembly histories for dark and stellar halos
Fig. 8 shows the virial mass assembly histories for our objects in low (blue) and high (red) subsamples. To ease the comparison, the vertical axis shows the virial mass at a given time normalized to the final mass at such that most curves stay within the -to- range. Thin lines indicate tracks for each individual object and the thick curve shows the median of each subsample. Although the object-to-object scatter is large, the median trend suggests a different mass assembly history characteristic for each subsample. Galaxies with low stellar halo fractions assemble their halo mass earlier compared to objects with larger , as shown by the blue and red thick lines. For instance, galaxies with low have acquired on average half of their mass by Gyr () whereas the counterparts with large stellar halo fraction take double the time to reach that value, or Gyr.
Moreover, the overall shapes of the assembly histories are different. High objects show a steady growth throughout most of their history, slowing down slightly after Gyr. Instead, in galaxies with low the growth is much more rapid in the initial phase ( Gyr), gradually slowing down afterwards. Interestingly, the late time evolution of for both subsamples is comparable after Gyr, or equivalently, . It is worth highlighting that the median virial masses of the low and high subpopulations are and respectively, which partially explains the earlier collapse of galaxies with low stellar halo fractions (as lower mass halos collapse earlier). However, the bias in halo mass is not large enough to fully explain the difference in median formation history found in Fig. 8.
If the dark matter halos of galaxies with low stellar halo assemble earlier, one is left to wonder whether the same applies to the stellar assembly. We explore this in Fig. 9, where solid lines correspond to the median assembly of the stellar halo component and dashed curves indicate the stellar assembly of the central galaxy. To guide the eye, we have included the median assembly of from the previous figure in thin dotted lines. To calculate these curves, we trace the progenitors of our galaxies backwards in time and at each snapshot count the amount of mass within (for ) and beyond (for the stellar halo mass ) the instantaneous galaxy radius defined as before, , with the half mass radius of the stars in the galaxy at each time. We then take the median mass at a given time from each subsample. We highlight that these curves measure the mass assembly onto each object and not the formation time of the stars.
The trends in Fig. 9 are intriguing and suggest that the assembly of the mass in the stellar halo component itself is different between both samples. Galaxies with low build their stellar halo early on in a similar fashion as the virial halo build up: a rapid early growth followed by a slow down of the evolution at later times. For instance, of the stars in the stellar halos are already in place at Gyr while later evolution during half a Hubble time only adds the remaining . Note that this behaviour is different from the stellar mass growth proceeding in the central galaxy, which is almost constant with time (see blue dashed curve), with a median time of Gyr to build of the stars in the center. On the other hand, galaxies with large stellar halo content assemble both the mass in their stellar halos and in the central galaxy at a steady rate which is only loosely connected to the growth.
The combined effect of stellar halo and central stellar growth is shown in the bottom panel of Fig. 9. By construction, both our subsamples have very different today. However, this seems not to have been always the case. The early progenitors of both samples had similar fractions of mass in the stellar halo compared to the central until Gyr, after which both subsamples start to deviate, an effect governed mainly by the fact that the low sample has significantly slowed down the building of its stellar halo but continues to actively grow the stellar mass in the central object bringing the ratio down with time. Galaxies with low stellar halo content might be the most ancient stellar halos ever assembled.
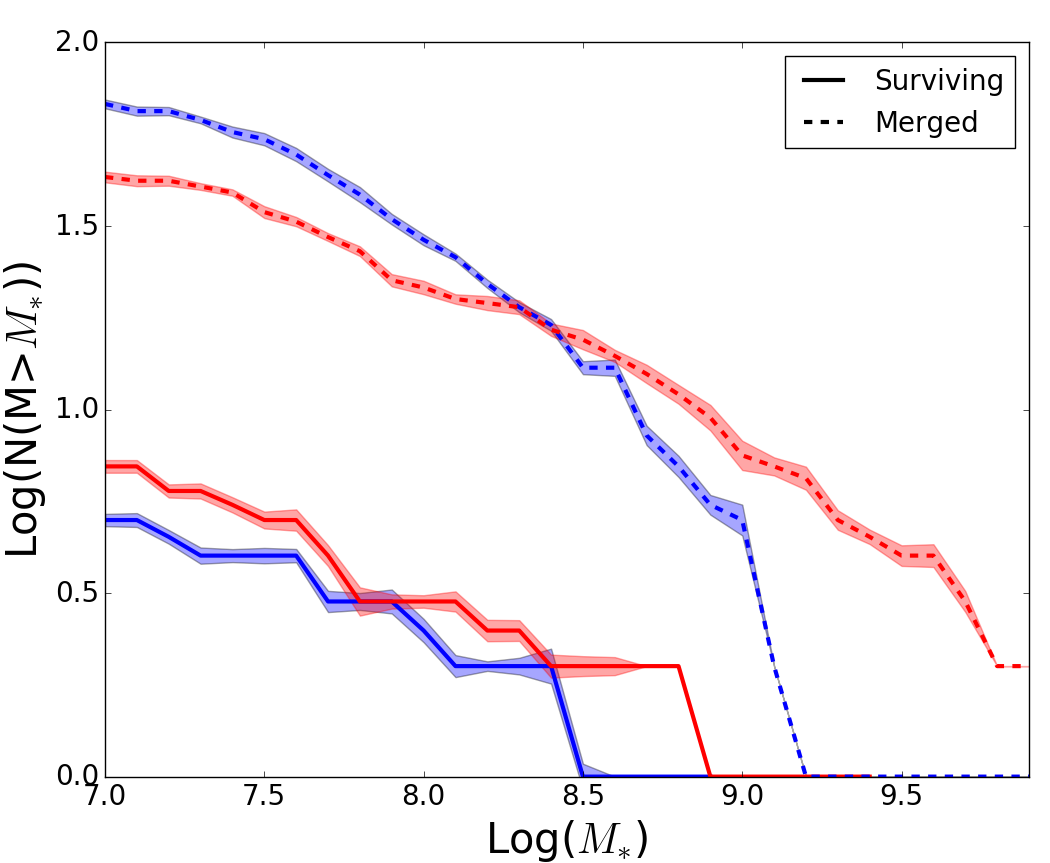
An important ingredient in the evolution of stellar halos is the population of satellite galaxies, in particular, those satellites that get partially or totally tidally disrupted contributing their stars to the extended halo222The reader should bear in mind that disrupted satellites can contribute stars to the stellar halo or central galaxy, depending on the position where they distribute their stars. Surviving satellites do also donate some of their stars to the stellar halo, and their contribution to the stellar halo can vary from negligible to significant (e.g. Sales et al., 2007; Cooper et al., 2010) according to the halo assebly history. We investigate in Fig. 10 the median satellite mass function of surviving (solid) and merged (dashed) satellites for each of our subsamples. Error bars correspond to dispersion obtained after 100 boostrap resampling of the data.
The surviving population in low and high is roughly similar in shape, with a small excess of satellites for galaxies with large stellar halo. This weak but yet significant correlation between stellar halo content and observed number of satellites is an interesting prediction of our model that may become available to observations soon as a larger number of galaxies are observed to low surface brightness limits. On the other hand, the spectrum of merged satellites shows instead a strong and significant difference in the shape of the mass distribution of merged satellites (see dashed curves in Fig. 10. We find a large preference for centrals with low stellar halo fraction to have accreted an excess of low mass satellites and a deficit of high mass satellites compared to centrals with high stellar halo content.
Counterintuitively perhaps, centrals with low stellar halo content have had on average a larger number of mergers compared to the high sample, albeit such mergers have been dominated by satellites of smaller mass than in the high sample. Centrals with low stellar halo content have mostly avoided mergers with satellites with stellar mass and above, whereas such events are not rare for galaxies with similar virial mass but larger stellar halo fractions. We conclude that the mass of the merged satellite and not the number of mergers, is a dominant factor in determining the stellar halo content of the central.
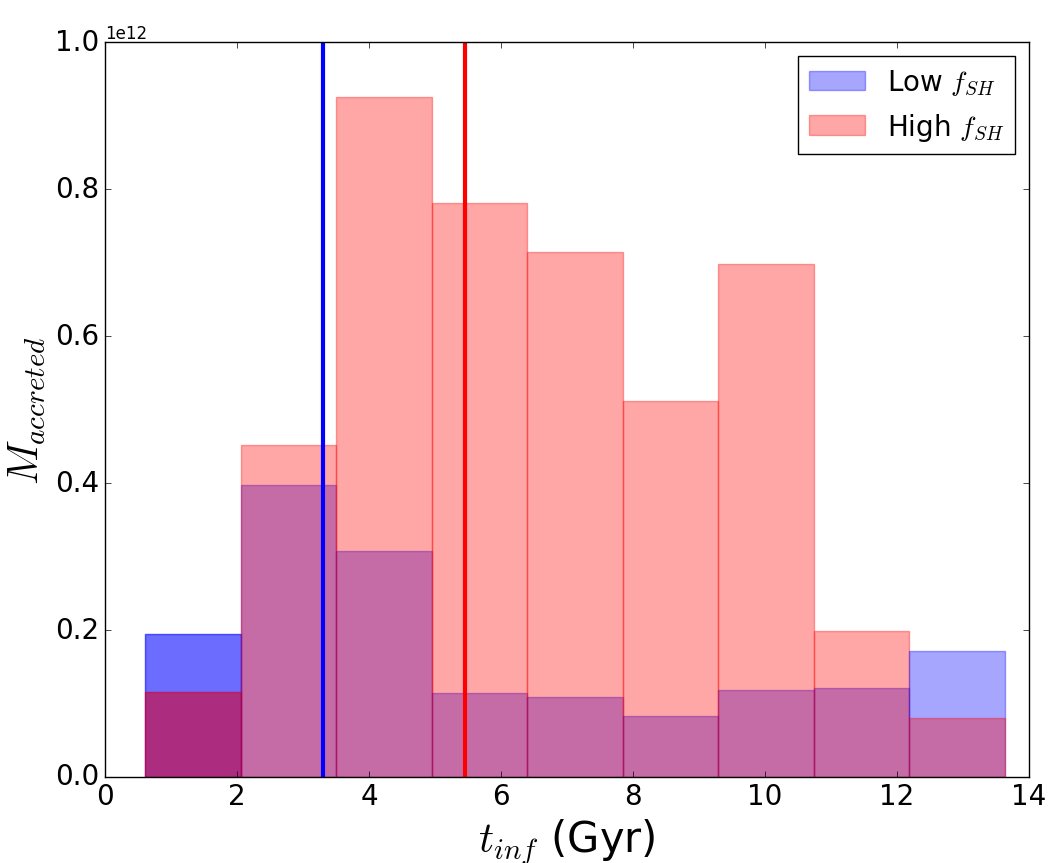
As the population of merged satellites largely determines the amount of stellar halo content, we investigate their times of infall , and find they differ significantly. Infall time is defined as the time at which a satellite reaches its peak total mass, a definition that roughly coincides with the last time an object was considered a central before it accreted onto a larger system. The right panel of Fig. 10 shows an average weighted histogram with the infall times of merged satellites, where each satellite is weighted by their stellar mass (results do not change significantly if we plot the unweighted histogram). As expected, low centrals have on average less stellar mass brought in by satellites, but these satellites also infall at earlier times than the high population. The earlier infall times partially explains the excess of low mass satellites that merged to centrals of low , as galaxies that infall at earlier times will have, at fixed total mass, a larger fraction of their baryons in the form of gas compared to a satellite that infalls later and have had the time to turn more of their gas into stars.
Moreover, the earlier infall times for merged satellites in centrals with low stellar halo content are also consistent with the time of rapid build up of the and stellar halos in these objects according to Fig. 9. To guide the eye, the blue and red vertical lines denote the of the low and high populations, respectively. This suggests that for the centrals with low no significant satellite infall has occurred since , consistent with the hypothesis of early assembled halos and implying that not many phase-space features such as stellar streams or substructures are expected in these hosts today. For high the incidence of young tidal features such as streams could be more common.
5 The in situ vs. accreted halos
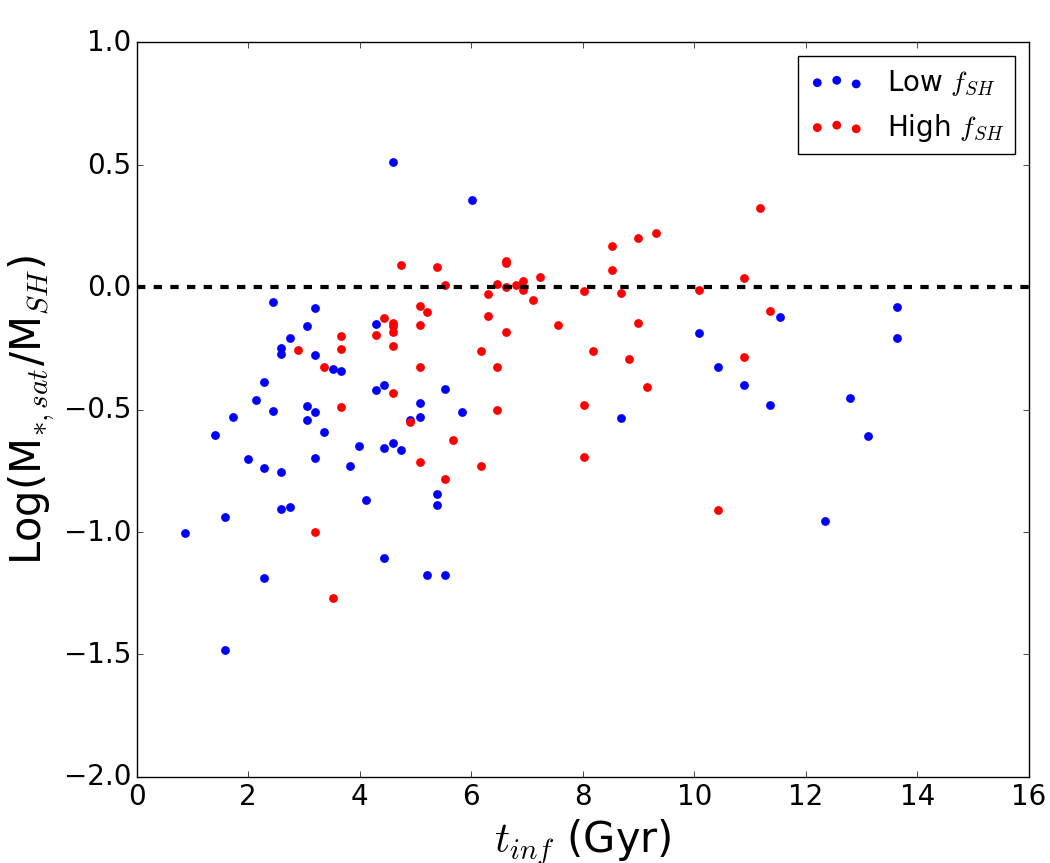
It is commonly assumed that the majority of the stars in stellar halos were contributed by a single most massive event (D’Souza & Bell, 2017; Deason et al., 2016). We explore this for our sample in Fig. 11 where for each central in our low and high subsample we select the most massive (in stars) merged satellite over their entire history. For such an event, we record the infall time and its maximum stellar mass, . By comparing to the mass of the stellar halo at we compute the fraction of the stellar halo mass that could have been brought in by the most massive merger event (-axis). Note that this is an upper limit since some of the stars could have been deposited onto the central galaxy and not in the stellar halo itself (that is why some of the points scatter above the 1 line). We find that most of the objects sit near a ratio of 1, especially for the centrals with high . However, there are a large number of systems where the fraction of stars in the most massive merger is only a minor contributor, meaning that the stellar halo mass was either built by more than one event or it has a completely different origin not associated to accretion from satellites.
Further exploration of the systems with demonstrated that a large fraction of the stars were born in situ and not accreted from satellites. This seems to occur more frequently in our centrals with low fraction of stellar halos (blue dots in Fig. 11) and earlier assembly (low ). In practice, we followed Rodriguez-Gomez et al. (2016) to determine the origin of stellar particles, where a star is labeled “in situ” if it belonged to the main branch of the progenitor tree at the time when it was born, or “accreted” if it was formed in a different substructure. The contribution of in situ stars to stellar halos have been suggested before, both in simulations (e.g., Zolotov et al., 2010; Purcell et al., 2010; Font et al., 2011; Tissera et al., 2013) and also in observations of the Milky Way, based for example on metallicity and kinematics difference between the inner halo –presumed to be formed in situ– and the external stellar halo –mostly accreted– (e.g., Nissen & Schuster, 2010; Carollo et al., 2007; Carollo et al., 2010). In Illustris, the in situ component of stellar halos seems significant for a large number of objects, especially those with a relatively low fraction of stellar halo.
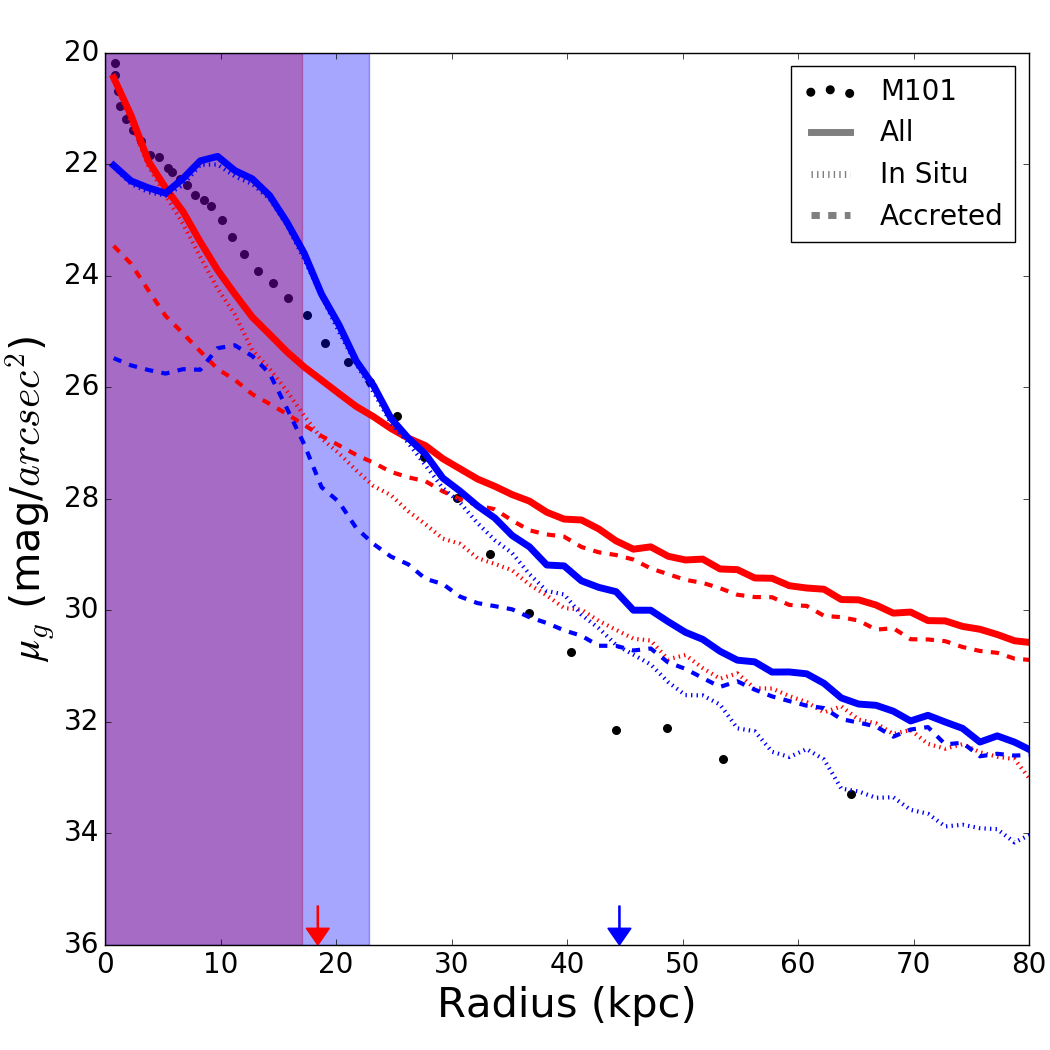
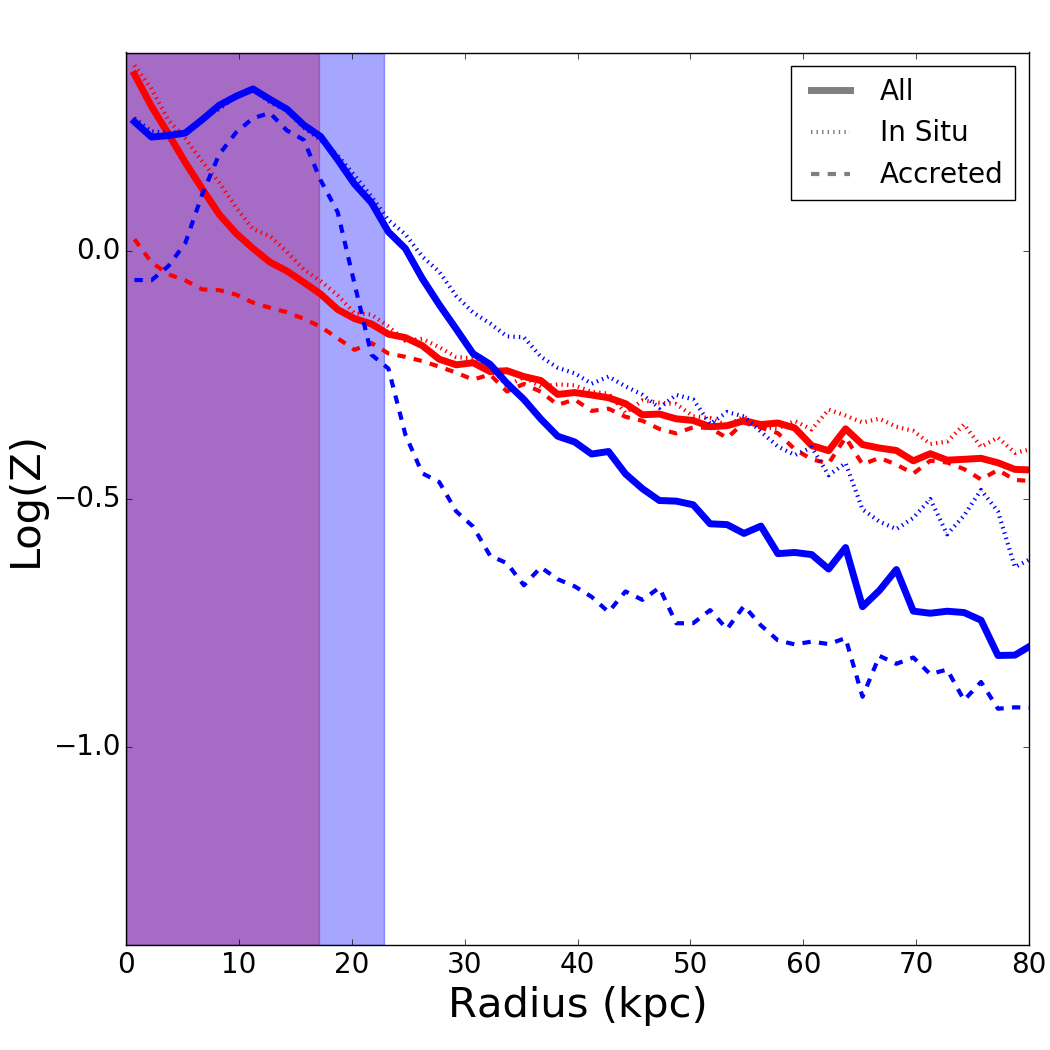
This is shown more clearly in the left panel of Fig. 12, where we show the median surface brightness profile for low and high subsamples (solid line) separated into the in situ contribution (dotted line) and accreted (dashed line). Here, we rotate each galaxy to be face-on (although our results do not depend strongly on this) and add the -band luminosity of all stars contributing in each radial annulus. The luminosity is then normalized by the area of each annulus and the galaxies are assumed to be at a distance Mpc to convert to apparent magnitude. Vertical shaded areas indicate the regions within twice the average half mass radius of the stars in each subsample. By definition, the stellar halo considered in this work extends outside the indicated shaded rectangles.
In the case of centrals with low stellar halo content (blue curves), the in situ population dominates the profile in the inner galaxy region, as expected, but beyond the optical radius as well, closely following the solid (all stars) line out to very large distances. For instance, one can consider the radius where the in situ and the accreted population contribute equally to the total profile, indicated by a blue vertical arrow, which reads kpc in the case of the low sample. Instead, for the galaxies with a massive stellar halo (red curves), the transition radius occurs almost at the edge of the galaxies, or kpc, being accretion-dominated throughout most of the stellar halo component.
For comparison, we include in the left panel of Fig. 12 the observed density profile of M101 from Merritt et al. (2016), which seems to agree well with the average in situ component in the low in Illustris. Although our simulations do not have an analog with such a low stellar halo component as measured for M101 (see Fig. 5), it is interesting to see that the in situ distribution of stars predicts such a similar overall shape for this diffuse component. If Illustris indeed overestimates the accreted contribution due to the larger number of dwarf galaxies predicted with respect to observations, there is some room to suggest that the halo of M101 and galaxies alike might be the ideal place to study this elusive in situ component in stellar halos.
The different origins predicted for the stellar halos of galaxies with low and high fraction of stars on their halos are also evident in the metallicity profile shapes. Right panel of Fig. 12 shows the metallicity profile predicted for all stars (solid) and the in situ (dotted) and accreted (dashed) components. As expected, the in situ stars have a larger metallicity compared to the accreted component since they were born in a more massive progenitor. However, for galaxies in the low sample there is an intrinsic steep negative slope in the change of metallicity with radius and since it dominates out to large radii, the overall metallicity profile changes rapidly as we move outwards. By contrast, in the high sample, the accreted component dominates and has a more shallow slope as a product of the mixing of material of stripped satellites at different radii. This agrees with and extends previous results on stellar halos of early types galaxies presented in Cook et al. (2016). Our results indicate that a steep metallicity gradient may be the smoking gun of a mostly in situ formed stellar halo. Such profiles are expected to be more common around galaxies with low fraction of mass on their stellar halos, but the signature is expected to be independent of mass content.
6 Summary and Discussion
We use the Illustris cosmological hydrodynamical simulations to study the assembly of stellar halos in galaxies of mass comparable to the MW within the CDM scenario. In particular, for a narrow range of virial halo mass - we focus on the relative amount of stellar mass in the extended halos normalized to the stars in the central galaxy, . Stellar halo mass is calculated as all stellar mass within the virial radius that is beyond twice the half mass radius of the stars (considered the galaxy) and is not associated to satellites. Our results can be summarized as follows:
-
•
Simulated stellar halos span a large range in - with a median value . Stellar halo masses for this virial mass range can therefore be as low as or as massive as . Simulated halos can be fairly oblate, with median and , where are the major to minor principal axes of the inertia tensor for the stars. This departure from sphericity can generate significant differences in the derived surface brightness profiles of the halos, with face-on objects being up to two magnitudes fainter than the same objects when viewed edge-on. Caution should therefore be exercised when analyzing observed profiles of galaxies at different inclination angles.
-
•
Simulations present a large variety of stellar halo profiles and masses which can accommodate the diversity of observed stellar halos to a certain degree. However, when considering the specific shape of the profiles, simulated galaxies in Illustris are in tension with the most steeply declining surface brightness profiles such as those observed in NGC1042 and NGC3351. The excess of stars at large distances in the simulations can partially be attributed to the overly massive low mass end of the mass function, meaning that merging satellites contribute more stars than they should to the stellar halos. Yet it is encouraging that galaxy formation models are able to predict a set of quite distinct behaviours for the surface brightness profiles of extended halos, some with relatively shallow profiles whereas other galaxies in the same mass range might show a rather rapidly declining stellar light in their outskirts (see also Pillepich et al., 2014).
-
•
We study the origin of this diversity of stellar halos by selecting the tails of low and high stellar halo fractions, . We find fundamental differences in the properties of the central galaxies in each subsample, with objects with low stellar halo content (low ) being in general more disk-dominated and star-forming whereas high centrals are spheroidals and not forming stars. On the other hand, environment seems not to play a major role in the assembly of the stellar halo, as the present-day density of galaxies around centrals, as characterized by , of low and high galaxies are remarkably similar. These findings are in good agreement with observations.
-
•
Galaxies with low stellar halo content form in halos that assemble more rapidly, reaching half their present day mass on average by . In contrast, galaxies with a massive stellar halo are more typical in late-forming halos, with a median redshift for the assembly of half their mass . The scatter from object to object is, however, large. Similarly, satellites that get tidally disrupted building the stellar halos infall earlier and are less massive in galaxies with low mass stellar halos. Average infall times for low and high stellar halo centrals are and Gyr, respectively.
-
•
In Illustris, stellar halos can have a significant fraction of in situ formed stars. Those stars form over time within kpc of the center, but are located today out to kpc, favoring a dynamical scenario for their launch into their more extended orbits. In situ formed halos decline steeply with radius and can dominate the contribution in low objects. We argue therefore that extreme objects such as M101 and the lowest stellar halo galaxies are the prime candidates to observationally study the in situ formed stellar halos. Furthermore, we predict that stellar halos formed mainly by contribution of in situ stars should have a markedly steep metallicity profile that can be used as a ’smoking gun’ for identification in observations.
The diversity of stellar halo shapes is an interesting new avenue to recover information on the past merger history of galaxies through their present day properties. Numerical simulations seem to naturally reproduce a large variety of shapes and mass for stellar halos in the Milky Way mass regime. Whether the simulated diversity matches observations or not is not yet settled. To first order, galaxies with little or no stellar halo are difficult to find in cosmological simulations within CDM where mergers are a prevalent feature. Biases and sky subtractions in observations that push the boundary of observability are challenging and difficult to quantify, which, in addition to the scarcity of objects observed to very faint surface brightness, hinders a correct interpretation of the comparison between observations and simulations. Current efforts such as GHOSTS (Radburn-Smith et al., 2011) and Dragonfly observations (Merritt et al., 2016) have been transformative. But more complete samples of galaxies at a fixed mass and varied morphology will lay the ground for a more fair comparison with models. From this perspective, projects targeting the faint outskirts of galaxies in large numbers are a necessity. The HERON Survey (Halos and Environments of Nearby Galaxies, Rich et al., 2017) and future missions such as WFIRST might help define the expected global properties of stellar halos and whether theoretical predictions are (or not) a good match to the observed Universe.
7 Acknowledgments
We would like to thank Mario Abadi, Richard D’Souza, Benedikt Diemer and Annalisa Pillepich for their valuable input and feedback on the results. LVS acknowledges financial support from the Hellman Foundation.
References
- Abadi et al. (2006) Abadi M. G., Navarro J. F., Steinmetz M., 2006, MNRAS, 365, 747
- Abadi et al. (2003a) Abadi M. G., Navarro J. F., Steinmetz M., Eke V. R., 2003a, ApJ, 591, 499
- Abadi et al. (2003b) Abadi M. G., Navarro J. F., Steinmetz M., Eke V. R., 2003b, ApJ, 597, 21
- Abraham & van Dokkum (2014) Abraham R. G., van Dokkum P. G., 2014, PASP, 126, 55
- Amorisco (2017) Amorisco N. C., 2017, MNRAS, 469, L48
- Bell et al. (2008) Bell E. F., Zucker D. B., Belokurov V., Sharma S., Johnston K. V., et al. 2008, ApJ, 680, 295
- Belokurov et al. (2006) Belokurov V., Zucker D. B., Evans N. W., Gilmore G., Vidrih S., et al. 2006, ApJL, 642, L137
- Bonaca et al. (2017) Bonaca A., Conroy C., Wetzel A., Hopkins P. F., Kereš D., 2017, ApJ, 845, 101
- Bullock & Johnston (2005) Bullock J. S., Johnston K. V., 2005, ApJ, 635, 931
- Bullock et al. (2001) Bullock J. S., Kravtsov A. V., Weinberg D. H., 2001, ApJ, 548, 33
- Carollo et al. (2010) Carollo D., Beers T. C., Chiba M., Norris J. E., Freeman K. C., Lee Y. S., Ivezić Ž., Rockosi C. M., Yanny B., 2010, ApJ, 712, 692
- Carollo et al. (2007) Carollo D., Beers T. C., Lee Y. S., Chiba M., Norris J. E., Wilhelm R., Sivarani T., Marsteller B., Munn J. A., Bailer-Jones C. A. L., Fiorentin P. R., York D. G., 2007, Nature, 450, 1020
- Chiba & Beers (2000) Chiba M., Beers T. C., 2000, AJ, 119, 2843
- Cook et al. (2016) Cook B. A., Conroy C., Pillepich A., Rodriguez-Gomez V., Hernquist L., 2016, ApJ, 833, 158
- Cooper et al. (2010) Cooper A. P., Cole S., Frenk C. S., White S. D. M., Helly J., Benson A. J., De Lucia G., Helmi A., Jenkins A., Navarro J. F., Springel V., Wang J., 2010, MNRAS, 406, 744
- Cooper et al. (2013) Cooper A. P., D’Souza R., Kauffmann G., Wang J., Boylan-Kolchin M., Guo Q., Frenk C. S., White S. D. M., 2013, MNRAS, 434, 3348
- Cooper et al. (2015) Cooper A. P., Parry O. H., Lowing B., Cole S., Frenk C., 2015, MNRAS, 454, 3185
- Courteau et al. (2011) Courteau S., Widrow L. M., McDonald M., Guhathakurta P., Gilbert K. M., Zhu Y., Beaton R. L., Majewski S. R., 2011, ApJ, 739, 20
- De Lucia & Helmi (2008) De Lucia G., Helmi A., 2008, MNRAS, 391, 14
- Deason et al. (2013) Deason A. J., Belokurov V., Evans N. W., Johnston K. V., 2013, ApJ, 763, 113
- Deason et al. (2016) Deason A. J., Mao Y.-Y., Wechsler R. H., 2016, ApJ, 821, 5
- Di Matteo et al. (2005) Di Matteo T., Springel V., Hernquist L., 2005, Nature, 433, 604
- Dolag et al. (2009) Dolag K., Borgani S., Murante G., Springel V., 2009, MNRAS, 399, 497
- D’Souza & Bell (2017) D’Souza R., Bell E., 2017, ArXiv e-prints
- D’Souza et al. (2014) D’Souza R., Kauffman G., Wang J., Vegetti S., 2014, MNRAS, 443, 1433
- Eggen et al. (1962) Eggen O. J., Lynden-Bell D., Sandage A. R., 1962, ApJ, 136, 748
- Ferguson et al. (2002) Ferguson A. M. N., Irwin M. J., Ibata R. A., Lewis G. F., Tanvir N. R., 2002, AJ, 124, 1452
- Fernández-Trincado et al. (2015) Fernández-Trincado J. G., Robin A. C., Reylé C., 2015, in Martins F., Boissier S., Buat V., Cambrésy L., Petit P., eds, SF2A-2015: Proceedings of the Annual meeting of the French Society of Astronomy and Astrophysics Mapping the inner stellar halo of the Milky Way from 2MASS and SDSS-III/APOGEE survey. pp 15–19
- Font et al. (2011) Font A. S., McCarthy I. G., Crain R. A., Theuns T., Schaye J., Wiersma R. P. C., Dalla Vecchia C., 2011, MNRAS, 416, 2802
- Genel (2016) Genel S., 2016, ApJ, 822, 107
- Genel et al. (2014) Genel S., Vogelsberger M., Springel V., Sijacki D., Nelson D., Snyder G., Rodriguez-Gomez V., Torrey P., Hernquist L., 2014, MNRAS, 445, 175
- Gilbert et al. (2014) Gilbert K. M., Kalirai J. S., Guhathakurta P., Beaton R. L., Geha M. C., Kirby E. N., Majewski S. R., Patterson R. J., Tollerud E. J., Bullock J. S., Tanaka M., Chiba M., 2014, ApJ, 796, 76
- Grillmair (2009) Grillmair C. J., 2009, ApJ, 693, 1118
- Grillmair & Johnson (2006) Grillmair C. J., Johnson R., 2006, ApJL, 639, L17
- Harmsen et al. (2017) Harmsen B., Monachesi A., Bell E. F., de Jong R. S., Bailin J., Radburn-Smith D. J., Holwerda B. W., 2017, MNRAS, 466, 1491
- Helmi et al. (2017) Helmi A., Veljanoski J., Breddels M. A., Tian H., Sales L. V., 2017, A&A, 598, A58
- Helmi & White (1999) Helmi A., White S. D. M., 1999, MNRAS, 307, 495
- Hinshaw et al. (2013) Hinshaw G., Larson D., Komatsu E., Spergel D. N., Bennett C. L., et al. 2013, ApJS, 208, 19
- Ibata et al. (1994) Ibata R. A., Gilmore G., Irwin M. J., 1994, Nature, 370, 194
- Ibata et al. (2014) Ibata R. A., Lewis G. F., McConnachie A. W., Martin N. F., Irwin M. J., Ferguson A. M. N., Babul A., Bernard E. J., Chapman S. C., Collins M., Fardal M., Mackey A. D., Navarro J., Peñarrubia J., Rich R. M., Tanvir N., Widrow L., 2014, ApJ, 780, 128
- Johnston (1998) Johnston K. V., 1998, ApJ, 495, 297
- Johnston et al. (1996) Johnston K. V., Hernquist L., Bolte M., 1996, ApJ, 465, 278
- Jurić et al. (2008) Jurić M., Ivezić Ž., Brooks A., Lupton R. H., et al. 2008, ApJ, 673, 864
- Leitherer et al. (1999) Leitherer C., Schaerer D., Goldader J. D., et al. 1999, ApJS, 123, 3
- Lynden-Bell & Lynden-Bell (1995) Lynden-Bell D., Lynden-Bell R. M., 1995, MNRAS, 275, 429
- Makarov et al. (2014) Makarov D., Prugniel P., Terekhova N., Courtois H., Vauglin I., 2014, A&A, 570, A13
- Martínez-Delgado et al. (2010) Martínez-Delgado D., Gabany R. J., Crawford K., Zibetti S., et al. 2010, AJ, 140, 962
- McCarthy et al. (2012) McCarthy I. G., Font A. S., Crain R. A., Deason A. J., Schaye J., Theuns T., 2012, MNRAS, 420, 2245
- McConnachie et al. (2009) McConnachie A. W., Irwin M. J., Ibata R. A., Dubinski J., et al. 2009, Nature, 461, 66
- Merritt et al. (2016) Merritt A., van Dokkum P., Abraham R., Zhang J., 2016, ApJ, 830, 62
- Monachesi et al. (2016) Monachesi A., Bell E. F., Radburn-Smith D. J., Bailin J., de Jong R. S., Holwerda B., Streich D., Silverstein G., 2016, MNRAS, 457, 1419
- Morrison et al. (2000) Morrison H. L., Mateo M., Olszewski E. W., Harding P., Dohm-Palmer R. C., Freeman K. C., Norris J. E., Morita M., 2000, AJ, 119, 2254
- Nelson et al. (2015) Nelson D., Pillepich A., Genel S., Vogelsberger M., Springel V., Torrey P., Rodriguez-Gomez V., Sijacki D., Snyder G. F., Griffen B., Marinacci F., Blecha L., Sales L., Xu D., Hernquist L., 2015, Astronomy and Computing, 13, 12
- Nissen & Schuster (2010) Nissen P. E., Schuster W. J., 2010, A&A, 511, L10
- Odenkirchen et al. (2001) Odenkirchen M., Grebel E. K., Rockosi C. M., Dehnen W., et al. 2001, ApJL, 548, L165
- Pillepich et al. (2015) Pillepich A., Madau P., Mayer L., 2015, ApJ, 799, 184
- Pillepich et al. (2014) Pillepich A., Vogelsberger M., Deason A., Rodriguez-Gomez V., Genel S., Nelson D., Torrey P., Sales L. V., Marinacci F., Springel V., Sijacki D., Hernquist L., 2014, MNRAS, 444, 237
- Purcell et al. (2010) Purcell C. W., Bullock J. S., Kazantzidis S., 2010, MNRAS, 404, 1711
- Radburn-Smith et al. (2011) Radburn-Smith D. J., de Jong R. S., Seth A. C., Bailin J., et al. 2011, ApJS, 195, 18
- Reitzel & Guhathakurta (2002) Reitzel D. B., Guhathakurta P., 2002, AJ, 124, 234
- Rich et al. (2017) Rich R. M., Brosch N., Bullock J., Burkert A., Collins M., de Groot L., Kennefick J., Koch A., Longstaff F., Sales L., 2017, in Gil de Paz A., Knapen J. H., Lee J. C., eds, Formation and Evolution of Galaxy Outskirts Vol. 321 of IAU Symposium, The Halos and Environments of Nearby Galaxies (HERON) Survey. pp 186–189
- Rodriguez-Gomez et al. (2015) Rodriguez-Gomez V., Genel S., Vogelsberger M., Sijacki D., Pillepich A., Sales L. V., Torrey P., Snyder G., Nelson D., Springel V., Ma C.-P., Hernquist L., 2015, MNRAS, 449, 49
- Rodriguez-Gomez et al. (2016) Rodriguez-Gomez V., Pillepich A., Sales L. V., Genel S., Vogelsberger M., Zhu Q., Wellons S., Nelson D., Torrey P., Springel V., Ma C.-P., Hernquist L., 2016, MNRAS, 458, 2371
- Rodriguez-Gomez et al. (2017) Rodriguez-Gomez V., Sales L. V., Genel S., Pillepich A., Zjupa J., Nelson D., Griffen B., Torrey P., Snyder G. F., Vogelsberger M., Springel V., Ma C.-P., Hernquist L., 2017, MNRAS, 467, 3083
- Sales et al. (2007) Sales L. V., Navarro J. F., Abadi M. G., Steinmetz M., 2007, MNRAS, 379, 1464
- Sales et al. (2012) Sales L. V., Navarro J. F., Theuns T., Schaye J., White S. D. M., Frenk C. S., Crain R. A., Dalla Vecchia C., 2012, MNRAS, 423, 1544
- Sales et al. (2015) Sales L. V., Vogelsberger M., Genel S., Torrey P., Nelson D., Rodriguez-Gomez V., Wang W., Pillepich A., Sijacki D., Springel V., Hernquist L., 2015, MNRAS, 447, L6
- Shapley (1938) Shapley H., 1938, Nature, 142, 715
- Sijacki et al. (2015) Sijacki D., Vogelsberger M., Genel S., Springel V., Torrey P., Snyder G. F., Nelson D., Hernquist L., 2015, MNRAS, 452, 575
- Snyder et al. (2015) Snyder G. F., Torrey P., Lotz J. M., Genel S., McBride C. K., Vogelsberger M., Pillepich A., Nelson D., Sales L. V., Sijacki D., Hernquist L., Springel V., 2015, MNRAS, 454, 1886
- Springel (2010) Springel V., 2010, MNRAS, 401, 791
- Springel et al. (2005) Springel V., Di Matteo T., Hernquist L., 2005, MNRAS, 361, 776
- Springel & Hernquist (2003) Springel V., Hernquist L., 2003, MNRAS, 339, 289
- Springel et al. (2001) Springel V., White S. D. M., Tormen G., Kauffmann G., 2001, MNRAS, 328, 726
- Tal & van Dokkum (2011) Tal T., van Dokkum P. G., 2011, ApJ, 731, 89
- Tal et al. (2009) Tal T., van Dokkum P. G., Nelan J., Bezanson R., 2009, AJ, 138, 1417
- Tanaka et al. (2010) Tanaka M., Chiba M., Komiyama Y., Guhathakurta P., Kalirai J. S., Iye M., 2010, ApJ, 708, 1168
- Tissera et al. (2014) Tissera P. B., Beers T. C., Carollo D., Scannapieco C., 2014, MNRAS, 439, 3128
- Tissera et al. (2013) Tissera P. B., Scannapieco C., Beers T. C., Carollo D., 2013, MNRAS, 432, 3391
- van Dokkum et al. (2014) van Dokkum P. G., Abraham R., Merritt A., 2014, ApJL, 782, L24
- Vera-Ciro et al. (2011) Vera-Ciro C. A., Sales L. V., Helmi A., Frenk C. S., Navarro J. F., Springel V., Vogelsberger M., White S. D. M., 2011, MNRAS, 416, 1377
- Vogelsberger et al. (2013) Vogelsberger M., Genel S., Sijacki D., Torrey P., Springel V., Hernquist L., 2013, MNRAS, 436, 3031
- Vogelsberger et al. (2014) Vogelsberger M., Genel S., Springel V., Torrey P., Sijacki D., Xu D., Snyder G., Bird S., Nelson D., Hernquist L., 2014, Nature, 509, 177
- Vogelsberger et al. (2014) Vogelsberger M., Genel S., Springel V., Torrey P., Sijacki D., Xu D., Snyder G., Nelson D., Hernquist L., 2014, MNRAS, 444, 1518
- White (1996) White S. D. M., 1996, in Schaeffer R., Silk J., Spiro M., Zinn-Justin J., eds, Cosmology and Large Scale Structure Formation and Evolution of Galaxies. p. 349
- White & Rees (1978) White S. D. M., Rees M. J., 1978, MNRAS, 183, 341
- Willman et al. (2005) Willman B., Dalcanton J. J., Martinez-Delgado D., West A. A., Blanton M. R., Hogg D. W., Barentine J. C., Brewington H. J., Harvanek M., Kleinman S. J., Krzesinski J., Long D., Neilsen Jr. E. H., Nitta A., Snedden S. A., 2005, ApJL, 626, L85
- Zibetti et al. (2004) Zibetti S., White S. D. M., Brinkmann J., 2004, MNRAS, 347, 556
- Zolotov et al. (2009) Zolotov A., Willman B., Brooks A. M., Governato F., Brook C. B., Hogg D. W., Quinn T., Stinson G., 2009, ApJ, 702, 1058
- Zolotov et al. (2010) Zolotov A., Willman B., Brooks A. M., Governato F., Hogg D. W., Shen S., Wadsley J., 2010, ApJ, 721, 738