A Precise Distance to the Host Galaxy of the Binary Neutron Star Merger GW170817
Using Surface Brightness Fluctuations111Based on observations with the NASA/ESA Hubble
Space Telescope, obtained at the Space Telescope Science Institute,
which is operated by the Association of Universities for Research in
Astronomy, Inc., under NASA contract NAS 5-26555.
These observations are associated with Program #15329 (PI E. Berger,
#14771 (PI N. Tanvir), and #14804 (PI A. Levan).
Abstract
The joint detection of gravitational waves and electromagnetic radiation from the binary neutron star (BNS) merger GW170817 has provided unprecedented insight into a wide range of physical processes: heavy element synthesis via the -process; the production of relativistic ejecta; the equation of state of neutron stars and the nature of the merger remnant; the binary coalescence timescale; and a measurement of the Hubble constant via the “standard siren” technique. In detail, all of these results depend on the distance to the host galaxy of the merger event, NGC 4993. In this paper we measure the surface brightness fluctuation (SBF) distance to NGC 4993 in the F110W and F160W passbands of the Wide Field Camera 3 Infrared Channel on the Hubble Space Telescope (HST). For the preferred F110W passband we derive a distance modulus of mag, or a linear distance Mpc (random and systematic errors, respectively); a virtually identical result is obtained from the F160W data. This is the most precise distance to NGC 4993 available to date. Combining our distance measurement with the corrected recession velocity of NGC 4993 implies a Hubble constant km s-1 Mpc-1. A comparison of our result to the GW-inferred value of indicates a binary orbital inclination of . The SBF technique can be applied to early-type host galaxies of BNS mergers to Mpc with HST and possibly as far as Mpc with the James Webb Space Telescope, thereby helping to break the inherent distance-inclination degeneracy of the GW data at distances where many future BNS mergers are likely to be detected.
1 Introduction
On 2017 August 17, the Advanced LIGO and Virgo gravitational wave (GW) observatories detected a binary neutron star (BNS) merger for the first time (GW170817, Abbott et al., 2017c). The merger was followed about 1.7 s later by a short-duration gamma-ray burst, detected by Fermi and INTEGRAL (GRB 170817A, Abbott et al., 2017b; Savchenko et al., 2017). Optical and near-infrared (NIR) follow-up observations of the GW localization region led to the identification of a counterpart in the galaxy NGC 4993 (Abbott et al., 2017b; Arcavi et al., 2017; Coulter et al., 2017; Lipunov et al., 2017; Soares-Santos et al., 2017; Valenti et al., 2017). Subsequent photometric and spectroscopic observations in the ultraviolet, optical, and NIR revealed the signatures of a “kilonova”, a transient powered by the radioactive decay of -process material synthesized in the merger ejecta (e.g., Cowperthwaite et al. 2017; Chornock et al. 2017; Nicholl et al. 2017; Pian et al. 2017; Smartt et al. 2017; Tanvir et al. 2017; Villar et al. 2017). Rising X-ray and radio emission produced by a separate relativistic ejecta component were detected with a delay of about two weeks (Alexander et al., 2017; Haggard et al., 2017; Hallinan et al., 2017; Kim et al., 2017; Margutti et al., 2017; Mooley et al., 2017; Troja et al., 2017). In addition, studies of NGC 4993 itself have established it to be an early-type galaxy dominated by an evolved stellar population with a median age of Gyr, and negligible present-day star formation activity (Blanchard et al., 2017; Im et al., 2017; Levan et al., 2017). Finally, combining the redshift of NGC 4993 with the distance measured from the GW data, Hubble constant values of km s-1 Mpc-1 (Abbott et al., 2017a) and km s-1 Mpc-1 (Guidorzi et al., 2017) were estimated. The large uncertainties in these measurements are dominated by the distance-inclination degeneracy inherent in the GW signal.
In detail, all of these transformative results depend on the distance to NGC 4993, which has been presently measured in two ways. First, from the GW signal itself, using the exact sky location available from the EM counterpart, the distance is estimated to be Mpc (Abbott et al., 2017a); the uncertainty is dominated by a fundamental degeneracy with the inclination of the binary’s orbit relative to the plane of the sky. Second, using the Fundamental Plane (FP) relation the distance is estimated to be Mpc (Hjorth et al., 2017) or Mpc (Im et al., 2017); the uncertainties and difference between the two FP estimates is typical for this method when applied to individual galaxies (e.g., Blakeslee et al., 2002). Hjorth et al. (2017) also evaluated a distance of Mpc to NGC 4993, from the galaxy redshift and adopting the value for from Riess et al. (2016); by combining the FP and the -dependent distance the authors obtained Mpc.
Since NGC 4993 is an early-type galaxy and too distant for individual stars to be resolved, yet near enough that peculiar velocities typically exceed 10% of the Hubble velocity, the options for a high-quality distance are quite limited. Of the six high-precision distance-determination methods discussed in the comprehensive review by Freedman & Madore (2010), three (Cepheids, tip of the red giant branch, and Tully-Fisher) are either impractical or impossible. Two other methods are presently impossible because no water masers or Type Ia supernovae have been observed in NGC 4993 to date. This leaves surface brightness fluctuations (SBF) as the only viable high-precision method for determining the distance. When applied with modern wide-field instruments on the Hubble Space Telescope (HST), the SBF method has an intrinsic scatter of % (Blakeslee et al., 2009; Blakeslee, 2013; Jensen et al., 2015), and indeed it has already been proposed for determining the distance to NGC 4993 with high precision (Hjorth et al., 2017). Here we use HST observations collected as part of the follow-up observations of GW170817 to measure an SBF distance to NGC 4993. Our analysis results in the most precise distance available to date.
2 Observations and Data Processing
Thanks to the combination of high angular resolution, stable image quality, and low background, accurate SBF measurements can be made for any bright early-type galaxy within Mpc in only a single orbit with one of the wide passband filters of the Wide Field Camera 3 Infrared Channel (WFC3/IR) on HST (Jensen et al., 2015). To achieve the best precision and to avoid systematic errors, we processed and analyzed HST imaging data from three different WFC3/IR programs that targeted NGC 4993 as part of the follow-up of GW170817. All three programs (GO-15329, PI E. Berger; GO-14804, PI A. Levan; GO-14771, PI N. Tanvir) collected data in the F110W and F160W filters ( and hereafter), both of which have been previously calibrated for the SBF method (Jensen et al., 2015). We also used data in the F475W and F850LP filters (hereafter and ) of the Advanced Camera for Surveys (ACS) from GO-15329 to derive the galaxy color for calibrating the absolute SBF magnitude. The data from GO-15329 were sufficiently deep ( s in each filter) for measuring SBF on their own; the data from the two other programs were combined to achieve the required depth ( s total in each filter). The two resulting data sets were processed and analyzed independently as described below in Section 3.
We reprocessed the raw and WFC3/IR images from the Mikulski Archive for Space Telescopes before proceeding with the SBF analysis. There are two reasons for this. First, the SBF analysis is performed using the spatial power spectrum of the Fourier-transformed image. When images are geometrically corrected and combined using pixel interpolation algorithms (as is the default in the WFC3 pipeline), correlations are introduced in the noise of neighboring pixels, which can adversely affect the SBF fitting procedure (e.g., Cantiello et al., 2005; Mei et al., 2005). Thus, we used only integer pixel shifts when combining exposures without correcting for geometrical distortion; this ensured that the power spectrum of the noise in the resulting stacked image was flat (white noise), as desired. Due to the spatial distortion of the WFC3/IR, the final stacked images have plate scales that differ in and by 10%, but this does not affect the SBF analysis, as long as the template point spread function (PSF) shares the same distortion. For galaxies with significant color gradients, it also requires that the color map be transformed in a consistent way before determining the colors (Jensen et al., 2015).
The second reason for reprocessing the raw WFC3/IR exposures is to identify and correct the ones affected by the diffuse He emission at 1.083 m, generated by metastable helium atoms in the Earth’s upper atmosphere, which causes a variable background level in the filter (Brammer et al., 2014). We processed all of the raw IR images using a routine written by G. Brammer222https://github.com/gbrammer/wfc3 that searches for varying rates of flux accumulation in a WFC3/IR MULTIACCUM sequence and corrects for the variations by fitting a linear trend to the background level as a function of time. After the background was linearized for a MULTIACCUM exposure sequence, the WFC3 calibration pipeline was used again on each exposure to regenerate the processed images (see Goullaud et al., 2018, for further discussion). These images were then registered and combined using integer pixel offsets, as discussed above.
We corrected all photometric measurements for Galactic extinction using the Schlafly & Finkbeiner (2011) values as tabulated by the NASA/IPAC Extragalactic Database (NED) for the appropriate ACS and WFC3/IR bands. Specifically, the corrections were 0.403, 0.153, 0.109, and 0.063 mag in , , , and , respectively. For our error budget (Table 2), we included an uncertainty of 10% in the reddening corrections derived from these extinction estimates (Schlafly & Finkbeiner, 2011).
3 SBF and Color Measurements
The SBF technique measures the intrinsic variance in a galaxy’s surface brightness distribution arising from statistical fluctuations in the integrated stellar luminosity per pixel (Tonry & Schneider, 1988; Jacoby et al., 1992; Cantiello et al., 2003; Raimondo et al., 2005; Cerviño et al., 2008). For evolved stellar populations, which predominate in early-type galaxies, stars on the red giant branch (RGB) contribute most strongly to the variance. The ratio of the variance to the mean surface brightness scales inversely as the square of the distance; this ratio is represented by the apparent SBF magnitude . The distance is obtained from a calibration of the corresponding absolute magnitude on the mean properties of the stellar population. At space-based image resolution, the method is the most precise distance indicator available for the general population of early-type galaxies at to 100 Mpc (Biscardi et al., 2008; Blakeslee et al., 2009, 2010; Freedman & Madore, 2010; Jensen et al., 2015). The SBF signal is particularly strong in the near-IR, where RGB stars are brightest (Jensen et al., 2003), and the effects of dust extinction are minimized.
The SBF analysis of the GO-15329 observations (labeled “B” for the name of the PI) was performed by J. Jensen (JJ), while analysis of the combined GO-14804 and GO-14771 data (labeled “LT” for the PIs) was performed by M. Cantiello (MC), without communicating the results to each other. Following the initial independent SBF analysis, to cross-check the results, the IR images were exchanged and each reduction procedure was then repeated for the other data set, again without communicating the results. The results were then shared with J. Blakeslee, who acted as a referee in comparing the two reductions. This procedure yielded two independent SBF analyses for each of the two independent data sets (B and LT) in both passbands. Due to the high degree of cross-checking inherent in this procedure, the resulting SBF measurements are exceptionally robust.
Although the independent measurements were performed by the two authors using different SBF analysis software, the basic SBF measurement procedure is the same and has been described in detail elsewhere (Blakeslee et al., 2001, 2010; Cantiello et al., 2005, 2007, 2017; Jensen et al., 2003, 2015). The first step was to determine the background level in the final combined image. As a result of the limited field of view of WFC3/IR, it was necessary to estimate the galaxy contribution to the background by fitting an profile (Sérsic model with ), which provided a reasonable fit to the overall profile despite deviations caused by the shell features (Blanchard et al., 2017; Im et al., 2017; Palmese et al., 2017). The range of background values over which acceptable fits were obtained was used to estimate the uncertainty in the background, and this uncertainty was propagated into the error budget for both the SBF amplitude and color (Table 2).
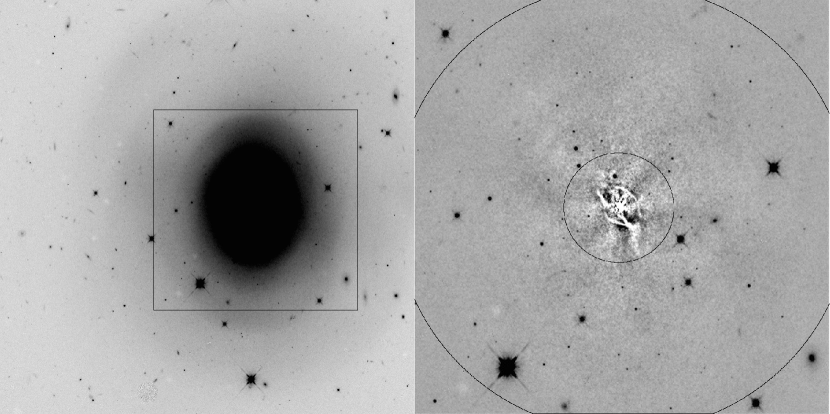
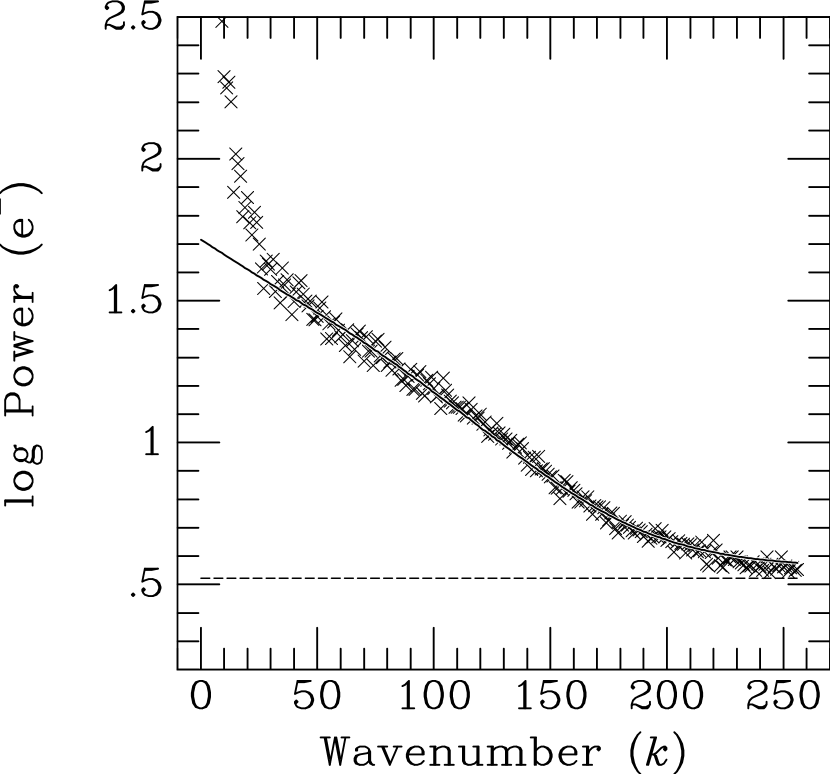
After background subtraction, the next step entailed modeling and subtracting the two-dimensional galaxy light distribution and large-scale residuals to obtain a clean residual image, as illustrated in Figure 1. We then extracted bright stars to create the PSF model. Because the SBF signal is convolved with the PSF, an accurate determination of the PSF Fourier power spectrum was essential. Contaminating sources such as foreground stars, background galaxies, and especially globular clusters in the galaxy itself, were identified using SExtractor (Bertin & Arnouts, 1996) and masked in the residual image. The SBF signal is the amplitude of the spatial power spectrum of the masked residual image, normalized by the mean galaxy surface brightness model, fitted with the normalized PSF power spectrum (as shown in Figure 2), and then corrected for the residual power from undetected contaminating sources. The contribution from objects fainter than the limiting detection threshold was estimated by fitting and extrapolating the source luminosity function, as described in our previous papers. Because these data are quite deep, and the SBF signal is very strong, this correction was very small. The corrected SBF amplitude from the fitted spatial power spectrum (Figure 2) was then converted to the apparent magnitude in the normal way and corrected for extinction.
All of these steps were followed independently by MC and JJ for multiple circular annuli centered on NGC 4993; the final measurements were performed in an annulus extending from 82 to 328 from the galaxy center (64 to 256 pixels, where the average pixel scale is 0128 pix-1). Beyond this radius, the SBF and color measurements were more strongly affected by uncertainties in the background determination. Dust features are prominent at radii interior to this annulus; the effect of dust is especially visible in the optical ACS data, but is still visible at in the right panel of Figure 1. The dust patches extending beyond 82 were masked using the multi-band color data.
The final measurements in each bandpass for each data set are presented in Table 1. The tabulated error bars were calculated by combining in quadrature the uncertainties in arising from the background subtraction, power spectrum fitting, PSF normalization, and the correction for contribution of undetected point sources to the power spectrum (Table 2). All of these uncertainties are discussed in detail in the references cited above. The measurements in Table 1 are used in the following section to derive the distances.
As noted above, the distance estimation requires calibrating the absolute SBF magnitude based on the galaxy stellar population, most commonly parameterized by the integrated galaxy color (e.g. Tonry et al., 1997; Blakeslee et al., 2001, 2009; Jensen et al., 2015; Cantiello et al., 2017). We therefore used the ACS and images produced by the standard STScI calibration pipeline to construct an optical color map of the galaxy, transformed to the WFC3/IR distorted frame, and measured the color of the galaxy within the SBF analysis region. Due to the larger ACS field of view, the sky backgrounds are well determined, which allows the apparent color of this region of the galaxy to be determined with an uncertainty of only mag. Including the estimated uncertainty on the Galactic reddening, the corrected color measurement is mag.
We also measured the extinction-corrected color to obtain an independent calibration of . Due to the limited wavelength coverage, this color index is not as constraining as in determining the absolute SBF magnitude. However, the reddening correction is much smaller for and adds an error of only mag in quadrature, much less than for the optical color. Thus, the additional information helped significantly to reduce the uncertainty in . As with the SBF analysis, the color measurements were performed independently by both JJ and MC from the B and LT data sets, respectively. These measurements were averaged and corrected for extinction, yielding mag.
| DatasetaaB = GO-15329 (PI E. Berger); LT = GO-14804 (PI A. Levan) + GO-14771 (PI N. Tanvir); BLT signifies the weighted average of the measurements from the B and LT data sets. | Filter | Distance | |||
|---|---|---|---|---|---|
| (AB mag) | (AB mag) | (mag) | (Mpc) | ||
| Using Eqn. 1 and 2, | |||||
| B | F110W | ||||
| LT | |||||
| B | F160W | ||||
| LT | |||||
| Using Eqn. 3 and 4, | |||||
| B | F110W | ||||
| LT | |||||
| B | F160W | ||||
| LT | |||||
| Weighted average of both data sets and calibrations | |||||
| BLT | F110W | ||||
| BLT | F160W | ||||
4 Distance Determination
To derive the distance modulus from the apparent SBF magnitude, , we adopted a value for from an empirical SBF calibration using the galaxy and colors to correct for variations in stellar population properties. The empirical SBF calibration of used here was derived from the distances to Virgo and Fornax cluster galaxies, which are ultimately based on the Cepheid distance scale (Tonry et al., 2000; Blakeslee et al., 2010; Jensen et al., 2015). The and calibrations from Jensen et al. (2015) are revised slightly from their published form to take into account an improved characterization of the PSF model, yielding a systematic offset of mag in for the calibration sample compared to a much larger sample of SBF data collected with HST WFC3/IR after the Jensen et al. (2015) data were collected, resulting in a much higher fidelity PSF measurement. In addition, the latest ACS photometric zero points imply that the color measurements from Blakeslee et al. (2009) used for the calibration were too red by +0.004 mag. With these updates, the calibrations (in AB mag) are:
| (1) | |||||
| (2) | |||||
| (3) | |||||
| (4) |
Following Blakeslee et al. (2010) and Jensen et al. (2015), we adopt intrinsic scatters of 0.05 and 0.10 mag for the and calibrations, respectively. These estimates are based on the observed scatter in the relations, corrected for the effect of the measurement errors in both the color and SBF magnitudes reported by Jensen et al. (2015). As discussed in previous studies, the observed scatter in with integrated color is minimized at wavelengths near m.
In Table 1 we report the eight individual distances derived from the two independent measurements (B and LT) in each of the two passbands, using the two different color calibrations. The reported uncertainties in the values include the intrinsic scatter estimated from the calibration relations combined in quadrature with errors propagated from the color measurements. We present all of these estimates to illustrate good consistency; however, these measurements are not all independent, and it would not make sense to take a simple weighted average of all the distance moduli. Instead, we report in Table 1 the weighted averages of the measurements from the two independent B and LT data sets for each of the two passbands, combined with the weighted average values from the two color calibrations, to give the two final distances derived from the and SBF measurements. In each case, the largest contribution to the final error bar comes from the adopted , and the estimates for the two bands are based on the same color measurements. Thus, we do not attempt to average them; instead, we take the result as our best constraint on the NGC 4993 distance and note that the result is nearly identical.
Finally, we note that the zero points of the calibration relations in Equations (1) to (4) are tied to the mean distance modulus of mag to the Virgo cluster based on 31 Virgo galaxies with distances measured in the ground-based SBF survey of Tonry et al. (2001). Here, the first error bar represents the uncertainty in the mean, while the second represents the systematic uncertainty in the tie of the SBF distances to the Cepheid distance scale of Freedman et al. (2001) (see the discussions by Blakeslee et al., 2010; Cantiello et al., 2017). Including an additional uncertainty of 0.06 mag for the Cepheid distance scale itself (Freedman & Madore, 2010), the total systematic uncertainty in our calibration is 0.10 mag. Our final result for the SBF distance to NGC 4993 is therefore mag, corresponding to Mpc (random and systematic errors, respectively).
| Uncertainty | SourceaaB09=Blakeslee et al. (2009); B10=Blakeslee et al. (2010); FM10=Freedman & Madore (2010); J15=Jensen et al. (2015); SF11=Schlafly & Finkbeiner (2011); | ||
|---|---|---|---|
| (mag) | (mag) | ||
| SBF Measurement Uncertainties | |||
| Background | 0.01–0.015 | 0.005–0.01 | measured |
| PSF fit | 0.01–0.04 | 0.02–0.05 | measured |
| External source fit | 0.01–0.015 | 0.01–0.015 | measured |
| Spatial power spectrum fit | 0.05 | 0.05 | measured |
| total | 0.056–0.068 | 0.056–0.071 | added in quadrature |
| Calibration Uncertainties | |||
| PSF normalization | 0.02 | comparison with J15 | |
| color correction | 0.027 | 0.027 | background, extinction (SF11) |
| color correction | 0.014 | 0.014 | background, extinction (SF11) |
| Stellar population scatter | 0.05 | 0.10 | J15, B09 |
| total | 0.077–0.106 | 0.115–0.141 | propagated and added in quadrature |
| SBF tie to Cepheid distance ZP | 0.10 | 0.10 | FM10, B10 |
5 Stellar Population of NGC 4993 from SBF
The likely coalescence timescale for the GW170817 system can be investigated using an estimate of the stellar population age of NGC 4993. Blanchard et al. (2017) reconstructed the star formation history of the galaxy and found that half of the stellar mass was assembled about 11 Gyr ago, with a negligible present-day star formation rate of M⊙ yr-1. Levan et al. (2017) found that about 60% of the stellar mass formed Gyr ago. Both papers suggest that a merger occurred about a Gyr ago based on the presence of dust lanes and shells, as well as indications from the reconstructed star formation history.
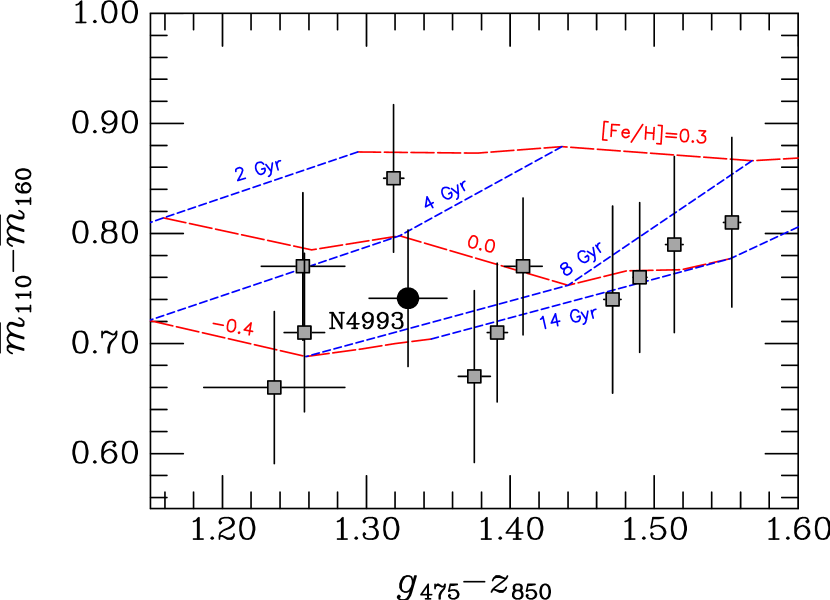
The IR SBF signal arises almost entirely from RGB and AGB stars in early-type galaxies, and variations in the SBF amplitude as a function of radius or color can be used to probe the stellar population age and metallicity of the dominant component of a galaxy (Jensen et al., 2003). In Figure 3 we plot the distance-independent SBF color of NGC 4993 versus the integrated color , together with previous measurements from Jensen et al. (2015) for 11 early-type galaxies in the Virgo and Fornax clusters, for comparison, and with stellar population models. The SBF and integrated color predictions shown in the figure are based on the SPoT single-age, single-metallicity stellar population (SSP) models (Raimondo, 2009) originally presented by Jensen et al. (2015), updated for this study using a larger number of stars (stellar population mass ) and improved spectral libraries for cooler stars.
NGC 4993 has an SBF color that is very similar to the Jensen et al. (2015) lenticular galaxies and lower-luminosity ellipticals in Virgo and Fornax that have mean population ages of Gyr and approximately solar metallicity. The narrow wavelength interval of the SBF color does not allow us to place tight constraints on the properties of the dominant stellar populations in the galaxy, but the comparison with SSP models, shown in Figure 3, indicates that NGC 4993 likewise has a luminosity-weighted stellar population older than 6 Gyr with slightly sub-solar metallicity. This is consistent with Blanchard et al. (2017) and Levan et al. (2017), but using a completely different technique that directly measures the properties of the evolved giant branch stars.
The and colors show a modest gradient ( and mag, respectively) with redder colors near the galaxy center (excluding the dust lanes in the core), similar to other early-type galaxies; the color appears to increase again at roughly 30″, apparently associated with a shell feature. There appears to be no evidence of a trend in fluctuation magnitude within the region used for the SBF measurement (82 to 328 in radius). We conclude that, since NGC 4993 shows signs of relatively recent merging (outer shells, central dust lanes, and a change in the slope of the gradient in ), the homogeneity of SBF measurements can be attributed either to a well-mixed stellar population of the pre-merging systems, or to a merging of galaxies with very similar stellar populations.
6 Implications and Conclusions
We have used HST near-IR observations to measure the SBF distance to NGC 4993, leading to the most precise value available to date, Mpc (random and systematic errors, respectively). This distance is consistent with the value Mpc (Abbott et al., 2017a) estimated from the GW data. The SBF distance error of % is much smaller than the FP measurement uncertainty and significantly reduces the uncertainty associated with the GW-derived distance (Abbott et al., 2017a).
While a single galaxy distance cannot place robust constraints on the Hubble constant, we can check for consistency using our measured distance and the recession velocity of the galaxy, and then use the resulting to constrain the orbital inclination of the merging BNS. Hjorth et al. (2017) adopted a mean heliocentric velocity of km s-1 for the NGC 4993 galaxy group. After transforming to the CMB rest frame (a difference of km s-1 in this direction) and correcting for an estimated peculiar velocity of km s-1 (the numerical similarity of to the projection along this direction of the Sun’s velocity in the CMB frame is coincidental), they derive a Hubble-flow velocity333Hjorth et al. (2017) refer to as the “cosmic velocity,” which is not to be confused with the observed velocity in CMB frame, . of km s-1. This value of agrees to within 0.5% of the independently estimated value from Guidorzi et al. (2017). Taking the ratio, we find km s-1 Mpc-1, where the error bar includes both random and systematic uncertainties. Given the uncertainty, our inferred value of is consistent with both the Type Ia supernova measurements from SHoES (73.2 km s-1 Mpc-1; Riess et al. 2016) and the CMB measurement from Planck (67.7 km s-1 Mpc-1; Planck Collaboration et al. 2016).
For comparison, Abbott et al. (2017a) inferred km s-1 Mpc-1 from a combination of the GW-derived distance and an assumed km s-1. The 3% higher value of was based on a somewhat rougher estimate of the mean observed velocity of the NGC 4993 group (the adopted peculiar velocity was nearly identical, although with a smaller uncertainty, leading to the smaller quoted error bars). Thus, to be consistent with Abbott et al. (2017a), we need to multiply our value of by 1.032. Applying this factor and comparing to the 1- curve in Figure 2 of that work, which presents the degeneracy between and the binary orbital inclination, we find that deg. This is consistent with the 90% upper limit derived via the approach in Mandel (2017).
Finally, we emphasize that the distance measures to GW170817 are estimated from two radically different and independent approaches, GWs and SBF, and therefore the consistency is striking.
Looking to the future, we expect that (at the design sensitivity) LIGO/Virgo will discover BNS mergers out to a few hundred Mpc, with many events expected to occur within 300 Mpc. Assuming that EM counterparts will be detected for most of these mergers, the distances to early-type host galaxies can be measured using the SBF technique out to Mpc with HST, and possibly to Mpc using James Webb Space Telescope (based on estimates using the available exposure time calculator). Only Type Ia supernovae can provide competitive distance measurements at these distances, but the chances of observing a supernova in the same galaxy as a BNS merger are unlikely. In this paper we have demonstrated that SBF distance measurements are a particularly compelling approach to breaking the distance-inclination degeneracy of the GW data.
References
- Abbott et al. (2017a) Abbott, B. P., Abbott, R., Abbott, T. D., et al. 2017a, Nature, 551, 85
- Abbott et al. (2017b) —. 2017b, ApJ, 848, L13
- Abbott et al. (2017c) —. 2017c, Physical Review Letters, 119, 161101
- Alexander et al. (2017) Alexander, K. D., Berger, E., Fong, W., et al. 2017, ApJ, 848, L21
- Arcavi et al. (2017) Arcavi, I., Hosseinzadeh, G., Howell, D. A., et al. 2017, Nature, 551, 64
- Bertin & Arnouts (1996) Bertin, E., & Arnouts, S. 1996, A&AS, 117, 393
- Biscardi et al. (2008) Biscardi, I., Raimondo, G., Cantiello, M., & Brocato, E. 2008, ApJ, 678, 168
- Blakeslee (2013) Blakeslee, J. P. 2013, in IAU Symposium, Vol. 289, Advancing the Physics of Cosmic Distances, ed. R. de Grijs, 304–311
- Blakeslee et al. (2002) Blakeslee, J. P., Lucey, J. R., Tonry, J. L., et al. 2002, MNRAS, 330, 443
- Blakeslee et al. (2001) Blakeslee, J. P., Vazdekis, A., & Ajhar, E. A. 2001, MNRAS, 320, 193
- Blakeslee et al. (2009) Blakeslee, J. P., Jordán, A., Mei, S., et al. 2009, ApJ, 694, 556
- Blakeslee et al. (2010) Blakeslee, J. P., Cantiello, M., Mei, S., et al. 2010, ApJ, 724, 657
- Blanchard et al. (2017) Blanchard, P. K., Berger, E., Fong, W., et al. 2017, ApJ, 848, L22
- Brammer et al. (2014) Brammer, G., Pirzkal, N., McCullough, P., & MacKenty, J. 2014, Time-varying Excess Earth-glow Backgrounds in the WFC3/IR Channel, Tech. rep., Space Telescope WFC Instrument Science Report
- Cantiello et al. (2007) Cantiello, M., Blakeslee, J., Raimondo, G., Brocato, E., & Capaccioli, M. 2007, ApJ, 668, 130
- Cantiello et al. (2005) Cantiello, M., Blakeslee, J. P., Raimondo, G., et al. 2005, ApJ, 634, 239
- Cantiello et al. (2003) Cantiello, M., Raimondo, G., Brocato, E., & Capaccioli, M. 2003, AJ, 125, 2783
- Cantiello et al. (2017) Cantiello, M., Blakeslee, J., Ferrarese, L., et al. 2018, ApJ, in press
- Cerviño et al. (2008) Cerviño, M., Luridiana, V., & Jamet, L. 2008, A&A, 491, 693
- Chornock et al. (2017) Chornock, R., Berger, E., Kasen, D., et al. 2017, ApJ, 848, L19
- Coulter et al. (2017) Coulter, D. A., Foley, R. J., Kilpatrick, C. D., et al. 2017, ArXiv e-prints, arXiv:1710.05452
- Cowperthwaite et al. (2017) Cowperthwaite, P. S., Berger, E., Villar, V. A., et al. 2017, ApJ, 848, L17
- Freedman & Madore (2010) Freedman, W. L., & Madore, B. F. 2010, ARA&A, 48, 673
- Freedman et al. (2001) Freedman, W. L., Madore, B. F., Gibson, B. K., et al. 2001, ApJ, 553, 47
- Goullaud et al. (2018) Goullaud et al. 2018, ApJ, in press
- Guidorzi et al. (2017) Guidorzi, C., Margutti, R., Brout, D., et al. 2017, ApJ, 851, L36
- Haggard et al. (2017) Haggard, D., Nynka, M., Ruan, J. J., et al. 2017, ApJ, 848, L25
- Hallinan et al. (2017) Hallinan, G., Corsi, A., Mooley, K. P., et al. 2017, ArXiv e-prints, arXiv:1710.05435
- Hjorth et al. (2017) Hjorth, J., Levan, A. J., Tanvir, N. R., et al. 2017, ApJ, 848, L31
- Im et al. (2017) Im, M., Yoon, Y., Lee, S.-K. J., et al. 2017, ApJ, 849, L16
- Jacoby et al. (1992) Jacoby, G. H., Branch, D., Ciardullo, R., et al. 1992, PASP, 104, 599
- Jensen et al. (2015) Jensen, J. B., Blakeslee, J. P., Gibson, Z., et al. 2015, ApJ, 808, 91
- Jensen et al. (2003) Jensen, J. B., Tonry, J. L., Barris, B. J., et al. 2003, ApJ, 583, 712
- Kim et al. (2017) Kim, S., Schulze, S., Resmi, & et al. 2017, ApJ, 850, L21
- Levan et al. (2017) Levan, A. J., Lyman, J. D., Tanvir, N. R., et al. 2017, ApJ, 848, L28
- Lipunov et al. (2017) Lipunov, V. M., Gorbovskoy, E., Kornilov, V. G., et al. 2017, ApJ, 850, L1
- Mandel (2017) Mandel, I. 2017, arXiv:1712.03958
- Raimondo (2009) Raimondo, G. 2009, ApJ, 700, 1247
- Margutti et al. (2017) Margutti, R., Berger, E., Fong, W., et al. 2017, ApJ, 848, L20
- Mei et al. (2005) Mei, S., Blakeslee, J. P., Tonry, J. L., et al. 2005, ApJS, 156, 113
- Mooley et al. (2017) Mooley, K. P., Nakar, E., Hotokezaka, K., et al. 2017, ArXiv e-prints, arXiv:1711.11573
- Nicholl et al. (2017) Nicholl, M., Berger, E., Kasen, D., et al. 2017, ApJ, 848, L18
- Palmese et al. (2017) Palmese, A., Hartley, W., Tarsitano, F., et al. 2017, ApJ, 849, L34
- Pian et al. (2017) Pian, E., D’Avanzo, P., Benetti, S., et al. 2017, Nature, 551, 67
- Planck Collaboration et al. (2016) Planck Collaboration, Ade, P. A. R., Aghanim, N., et al. 2016, A&A, 594, A13
- Raimondo (2009) Raimondo, G. 2009, ApJ, 700, 1247
- Raimondo et al. (2005) Raimondo, G., Brocato, E., Cantiello, M., & Capaccioli, M. 2005, AJ, 130, 2625
- Riess et al. (2016) Riess, A. G., Macri, L. M., Hoffmann, S. L., et al. 2016, ApJ, 826, 56
- Savchenko et al. (2017) Savchenko, V., Ferrigno, C., Kuulkers, E., et al. 2017, ApJ, 848, L15
- Schlafly & Finkbeiner (2011) Schlafly, E. F., & Finkbeiner, D. P. 2011, ApJ, 737, 103
- Smartt et al. (2017) Smartt, S. J., Chen, T.-W., Jerkstrand, A., et al. 2017, Nature, 551, 75
- Soares-Santos et al. (2017) Soares-Santos, M., Holz, D. E., Annis, J., et al. 2017, ApJ, 848, L16
- Tanvir et al. (2017) Tanvir, N. R., Levan, A. J., González-Fernández, C., et al. 2017, ApJ, 848, L27
- Tonry & Schneider (1988) Tonry, J., & Schneider, D. P. 1988, AJ, 96, 807
- Tonry et al. (1997) Tonry, J. L., Blakeslee, J. P., Ajhar, E. A., & Dressler, A. 1997, ApJ, 475, 399
- Tonry et al. (2000) —. 2000, ApJ, 530, 625
- Tonry et al. (2001) Tonry, J. L., Dressler, A., Blakeslee, J. P., et al. 2001, ApJ, 546, 681
- Troja et al. (2017) Troja, E., Piro, L., van Eerten, H., et al. 2017, Nature, 551, 71
- Valenti et al. (2017) Valenti, S., David, Sand, J., et al. 2017, ApJ, 848, L24
- Villar et al. (2017) Villar, V. A., Guillochon, J., Berger, E., et al. 2017, ApJ, 851, L21