Probing the evolution of the EAS muon content in the atmosphere with KASCADE-Grande
Abstract
The evolution of the muon content of very high energy air showers (EAS) in the atmosphere is investigated with data of the KASCADE-Grande observatory. For this purpose, the muon attenuation length in the atmosphere is obtained to from the experimental data for shower energies between and . Comparison of this quantity with predictions of the high-energy hadronic interaction models QGSJET-II-02, SIBYLL 2.1, QGSJET-II-04 and EPOS-LHC reveals that the attenuation of the muon content of measured EAS in the atmosphere is lower than predicted. Deviations are, however, less significant with the post-LHC models. The presence of such deviations seems to be related to a difference between the simulated and the measured zenith angle evolutions of the lateral muon density distributions of EAS, which also causes a discrepancy between the measured absorption lengths of the density of shower muons and the predicted ones at large distances from the EAS core. The studied deficiencies show that all four considered hadronic interaction models fail to describe consistently the zenith angle evolution of the muon content of EAS in the aforesaid energy regime.
keywords:
Cosmic rays , KASCADE-Grande , extensive air showers , muon component , attenuation length , hadronic interaction models1 Introduction
Extensive air showers (EAS) are cascades of secondary particles produced by multiple particle reactions and decays in the atmosphere. These processes are triggered by collisions of very high energy cosmic rays with the nuclei of the atmosphere. With sophisticated air-shower detectors, the properties of the EAS are measured with the aim of learning about the origin and physics of the parent cosmic rays, a task that it is often done by comparing the EAS data with Monte Carlo simulations. Critical elements of these simulations are the hadronic interaction models, which rely on physical extrapolations of accelerator measurements taken at lower energies [1]. The distinct phenomenological treatments employed in the models and the uncertainties of the experimental input data lead to considerable differences in the predictions of relevant EAS parameters at high energies [1, 2], which introduce significant model uncertainties when assigning the energy and identifying the nature of the primary particles from the EAS measurements (see for example [3]). Hence, it is imperative to check the validity of the hadronic interaction models employed in the study of cosmic rays.
At very high energies and in the kinematical regime relevant for cosmic ray physics, the performance of hadronic interaction models can be checked by comparing their EAS predictions with the data of air-shower observatories. Differences between model expectations and experimental data found in this way can not only serve to constrain the validity of the models but also to point out some of their deficiencies as a basis for future model improvements. For testing the validity of hadronic interaction models, muons play a particular role. Muons are created in non-electromagnetic decays of shower hadrons, such as charged pions and kaons. Once produced, muons decouple immediately from the air shower and travel almost in straight lines to the detector with smaller attenuation than that for electromagnetic and hadronic particles [4]. Studying muons becomes therefore a sensitive and direct way to probe the hadronic physics [5] and to identify possible deficiencies of hadronic interaction models [6, 7].
In this regard, the present work aims to test the predictions of the high-energy hadronic interaction models QGSJET-II-02 [8], SIBYLL 2.1 [9], EPOS-LHC[10] and QGSJET-II-04 [11] on the zenith-angle dependence of the muon number in EAS. The study is performed by measuring the attenuation length of muons in air showers using the constant intensity cut (CIC) method [12] and by comparing the results with model predictions. The EAS data were collected with the KASCADE-Grande observatory [13] during the period from December 2003 to October 2011.
The paper is structured as follows: In section 2 a brief description of the experimental KASCADE-Grande setup and the accuracy of the shower reconstruction at the observatory are presented as well as a short description of the selection cuts employed in the study. Then, in section 3, the characteristics of the Monte Carlo data sets employed for the current investigation are described and the high-energy hadronic interaction models investigated in this study are briefly reviewed. The analyses employed to test the hadronic interaction models are presented in detail in sections 4 and 5. The discussions of the results are reserved for section 6. Section 7 7 contains a brief account of the implications of the results for the features of the hadronic interaction models. In section 8, the conclusions of the present research are summarized. Finally, the statistical and systematic errors for our results are listed and discussed in the appendices.
2 The KASCADE-Grande observatory
2.1 Experimental set-up
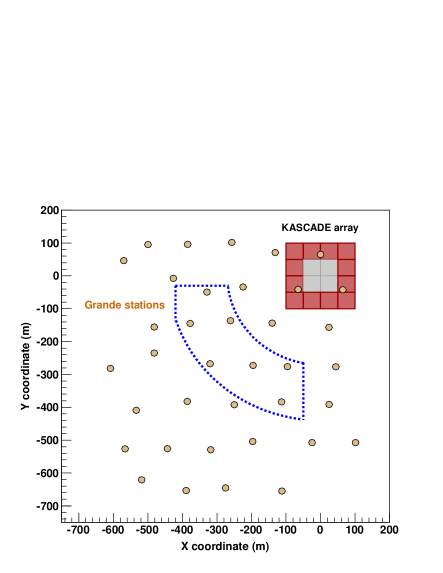
The KASCADE-Grande experiment [13] was an air-shower array devoted to study the energy spectrum and composition of cosmic rays with energies between and , corresponding to center of mass energies in the range of to . The observatory was installed at the site of the KIT Campus North ( N, E, a.s.l.), Germany, and consisted of two independent detector subsystems, the Grande and KASCADE arrays [13]. The former was composed of a grid of scintillator stations regularly separated by an average distance of (see fig. 1) and the latter, by a smaller and more compact array of shielded and unshielded scintillation detectors spaced every over a regular grid of overall surface. The Grande array provided ground measurements of the total number of charged particles (), , at the EAS front, while the KASCADE array was used to measure the corresponding total number of muons (), , among other observables. A more detailed description of the KASCADE-Grande facility can be found in [13].
2.2 EAS reconstruction
Air shower reconstruction in KASCADE-Grande proceeds event-by-event by means of an iterative algorithm and a careful modeling of the EAS front [13]. is estimated solely from the Grande data, while is derived from the -measurements of the KASCADE array. For the estimation of a maximum-log-likelihood fit of a modified NKG lateral distribution function (LDF) [14] is carried out using the densities of charged particles measured by the Grande array for the event.
For the estimation of , in a first step, a calculation of the number of muons detected in each KASCADE shielded station is performed. This is accomplished by applying a conversion function (LECF) to the energy deposit recorded in each muon detector, whose main parameters have a negligible dependence on the shower size and the hadronic interaction model [13]. In the second and last step, the total number of muons in the EAS is estimated with the maximum likelihood technique by fitting a Lagutin-Raikin lateral distribution function with a fixed shape [15] to the data on the number of penetrating particles registered by the KASCADE detectors:
| (1) |
with the radial distance from the EAS core measured at the shower plane. The parameters of the above equation are , , and [13]. They were obtained calibrating the function with the results of CORSIKA/QGSJET-01 simulations, in particular, by averaging the fits to simulated protons and iron nuclei with energies of and . Fixing the shape of the muon lateral distribution obeys to the limited statistics available from the muon detectors. If relaxing this constraint on the LDF shape, the fit becomes unstable.
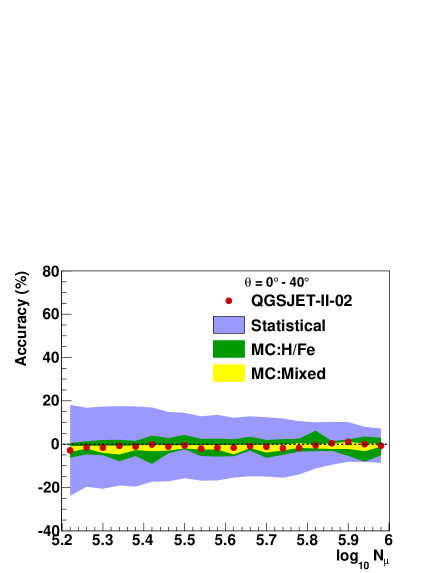
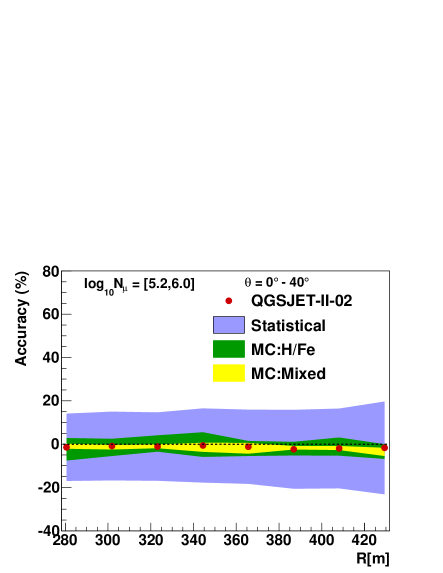
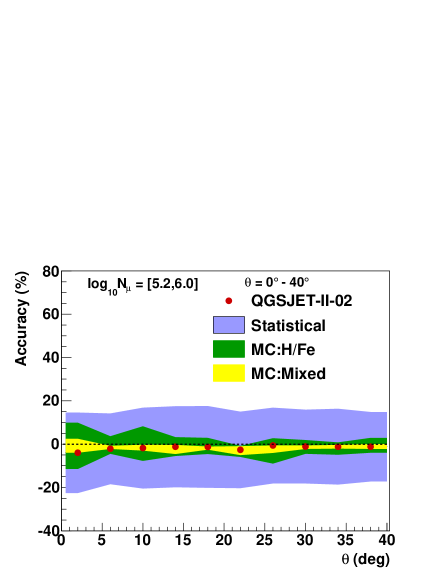
The resolution achieved by the whole fitting procedure is % for and % for . The first value was estimated in a model independent way [13] and the second one, from MC simulations using the models under study (see A). For the upcoming analysis, in order to improve the accuracy of the muon number and consequently on the determination of the muon attenuation length, was corrected for experimental and reconstruction effects using a correction function (c.f. A). The latter was built from MC simulations based on the QGSJET-II-02 model. The choice of the MC model is not relevant for this task, because the correction is almost independent of the high-energy hadronic interaction model. After corrections, the mean systematic errors are reduced to with a weak dependence on the core position, the shower size, the muon size and the shower zenith angle in the full efficiency regime and, in particular, on the selected data sample.
2.3 Selection cuts and description of the data
Several selection cuts were developed in order to reduce the effect of systematic uncertainties on the reconstructed shower observables, mainly on . These selection criteria were applied indistinctly to experimental data and simulated events.
First, selected events had to satisfy a Grande hardware trigger (six of a hexagonal shape and the central one) and activate more than 11 Grande stations from a minimum number of 36 working Grande stations. Besides, all KASCADE detector clusters were required to be in operation during the data acquisition of the events. The quality of the reconstruction of the selected sample was assured by considering only events that passed successfully the standard reconstruction procedure of KASCADE-Grande. In addition, the selection for the present analysis included only events with their cores located at a distance between and from the KASCADE center and within a central area of inside the Grande array (c.f. fig. 1). With this cut not only edge effects were avoided but also a significant reduction of the systematic uncertainties was achieved. In particular, events with a large contribution from the electromagnetic punch-through effect were eliminated. Showers with zenith angles greater than were also removed as they have a large pointing error. A further constraint on the data was set by introducing the limit on the reconstructed (not corrected yet) muon number for EAS. This cut helped to discard a number of events below the efficiency threshold irrelevant for the present analysis.
After these selection cuts, the full trigger and reconstruction efficiency of the KASCADE-Grande experiment is achieved at threshold energies around and corrected muon numbers , according to MC simulations. The small uncertainties originate from the unknown primary composition, the arrival direction and the hadronic interaction model involved. For the selected events, the mean core and pointing resolutions of KASCADE-Grande are better than and , respectively, and are almost independent of the radial distance to the KASCADE array. The application of the selection criteria to the KASCADE-Grande data yielded a data set with 2,744,950 shower events corresponding to a total exposure of .
3 Monte Carlo simulations
MC data were generated using simulations of the EAS development and of the response of the detectors of the KASCADE-Grande array. In order to simulate the EAS evolution in the atmosphere, the CORSIKA code [16] was used without employing the thinning algorithm. The U.S. standard atmosphere model as parameterized by J. Linsley (c.f. [16] and references therein) was employed, as the mean of the local RMS air pressure values at the site of the KASCADE-Grande observatory is close to the magnitude predicted by the abovementioned model [17].
The physics of the hadronic interactions was simulated using Fluka [18] at low energies () combined with QGSJET-II-02, SIBYLL 2.1, QGSJET-II-04 and EPOS-LHC as different alternatives to model the high energy regime. MC showers were generated for the KASCADE-Grande location and followed until they reach the detector level. The CORSIKA output was injected in a GEANT 3.21 [19] based code, where the response of the KASCADE-Grande components were simulated in full detail and stored in data files, which have the same format as the experimental data. The MC files were then processed with the same KASCADE-Grande reconstruction program that was applied to the measured data. This way, systematic uncertainties owing to the use of different reconstruction algorithms were avoided.
The energy spectrum of the events in the MC data sets ranges from until and follows an law. However, weights had to be introduced and applied to the MC data to simulate more realistic spectra (see, for example, [20, 21]) with . Regarding the spatial distribution of the MC events, they are isotropically distributed and their cores at ground are homogeneously scattered over the full array. Shower simulations are done up to zenith angles of with no restriction for the azimuthal angle. Concerning composition, MC data contain individual sets for different representative primaries: hydrogen (H), helium (He), carbon (C), silicon (Si) and iron (Fe) nuclei, with roughly the same statistics. An additional data set for each interaction model was also included simulating a mixed composition scenario, where the above elements are present in equal abundances. The final QGSJET-II-02 data set with the five primaries contains million events, while the corresponding data files for the other models comprise roughly million events for SIBYLL 2.1, million events for QGSJET-II-04 and million events for EPOS-LHC.
Several differences are expected among the predictions of the various hadronic interactions models for the KASCADE-Grande energy range at the altitude of the observatory. Comparative studies performed for KASCADE-Grande showed that QGSJET-II-02 produces a lower muon content in vertical EAS than the most recent models QGSJET-II-04 and EPOS-LHC, but more muons than SIBYLL 2.1 (e.g., at , they amount to and for the first two cases, respectively, and to for the last one). On the other hand, it was found that QGSJET-II-02 predictions for the ratio in vertical showers are smaller than the corresponding QGSJET-II-04 and EPOS-LHC estimations ( and , respectively, at ). However, the QGSJET-II-02 ratios turned out to be almost equal to the SIBYLL 2.1 derived ones. The main reasons behind the muon enhancement in the current version of QGSJET-II-04 are the larger production in pion-air interactions and the harder pion spectra [22]. The latter is due to an increased forward production in pion-nucleus collisions, compared to generation, which enhances via the decay mode the relative proportion of charged pions in EAS and leads to an increase of the shower muon content [22]. In EPOS-LHC, an additional increase of the muon production originates from an enhanced production of baryon-antibaryon pairs in pion-nucleus collisions, which effectively increases the number of hadron generations in the atmospheric nuclear cascades [23]. For more details concerning the models, predictions for other EAS observables, and theoretical approaches see references [22, 23].
4 The muon attenuation length
We focus the present analysis to the calculation of the attenuation length of the number of shower muons in the atmosphere, , as an appropriate physical quantity to study the evolution of the muon content of EAS in the atmosphere. This is an easy and direct way to compare the evolution observed in EAS with the predictions from MC simulations. In general, the EAS attenuation length is a quantity that measures the degree of effective attenuation that a given air-shower component or observable undergoes in the atmosphere. In particular, it is sensitive to the longitudinal development of the EAS [24] and it is affected by the inelastic hadronic cross section of the primary particle [25] and the underlying mechanisms of particle production in the shower [23]. The EAS attenuation length is, in consequence, a physical quantity that encloses a large amount of information about the generation and development of the air shower.
Alternative definitions exist for the EAS attenuation length depending of the shower component and the applied experimental technique (see for example [24, 25] and references therein). Here, we will use the approach based on the Constant Intensity Cut (CIC) method [12], as it is well-established and independent of the hadronic interaction model. Pioneering work using the CIC method along with the data can be found for example in [26] and [27] (see also [24] and references therein). The approach has been exploited for a number of reasons at some EAS observatories, e.g. for the reconstruction of the energy spectrum of cosmic rays [27], the calculation of the Air cross section [26], the test of hadronic interaction models [27] and the extraction of [24, 26, 27]. However, in the latter case, the different experimental conditions, muon energy thresholds and EAS reconstruction methods of the observatories as well as the distinct column depths of the sites prevent us to compare those early measurements of with that from the present paper.
The aim of the CIC method is to provide a way to relate data from different zenith angles at roughly the same primary energies, without any reference to MC simulations. This is achieved through the calculation of attenuation curves at fixed shower rates. The CIC method is based on the assumption that the arrival distribution of cosmic rays is isotropic so that the observed intensity of primary particles with the same energy is independent of the zenith angle or the slant depth.
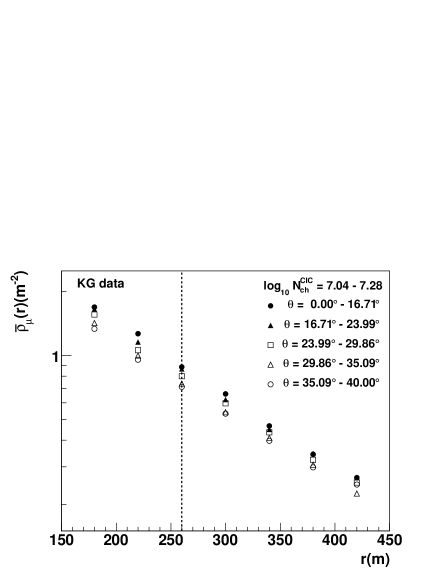
In order to apply the CIC method, in the first instance, data were grouped into five zenith-angle intervals with roughly the same aperture (see fig. 2, left). Then, for each angular bin the corresponding integral muon intensity555Defined as the number of showers detected above per unit solid angle, unit area and unit of time. is estimated according to the following formula:
| (2) |
where represents the differential muon shower size spectrum.
Five cuts are applied on at different constant integral intensities in order to select showers with the same frequency rate at distinct zenith angles. This procedure is performed within the interval of full efficiency and maximum statistics as shown in fig. 2 (left).
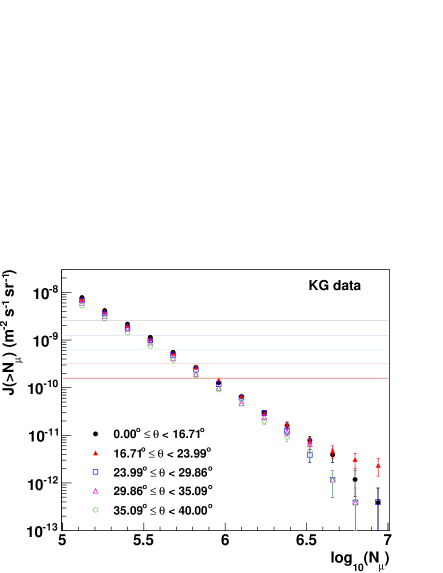
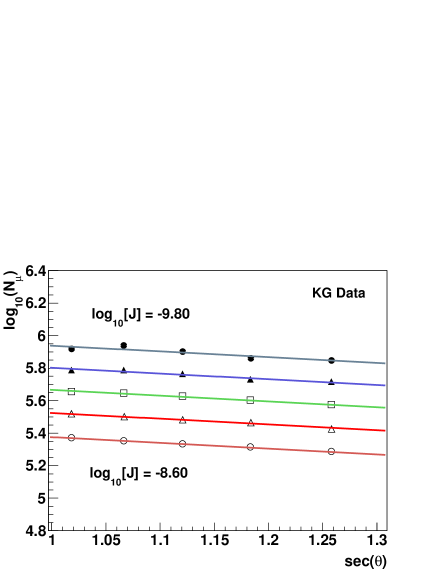
After that, the intersections of each cut with the integral spectra for the different angular bins are found666When necessary, interpolation between two adjacent points along the same intensity was applied by means of a simple power-law expression.. Then for each constant intensity cut, a muon attenuation curve is built using the corresponding set of intersection points. The results are displayed on the right plot of fig. 2 for all CIC cuts employed in the study. These attenuation curves describe roughly the way in which the muon content of an average EAS evolves in the atmosphere for different primary energies. Finally, in order to extract the value of the muon attenuation length () that best describes our data, a global fit via a -minimization is applied to the set of attenuation curves using
| (3) |
with a common , where is the average atmospheric depth for vertical showers at the location of the experiment and is a normalization parameter to be determined for each attenuation curve. The analysis of both the MC and measured data have shown that it is possible to use a single for the entire range, as the standard deviation of the results obtained when fitting individually the attenuation curves is smaller than in each case.
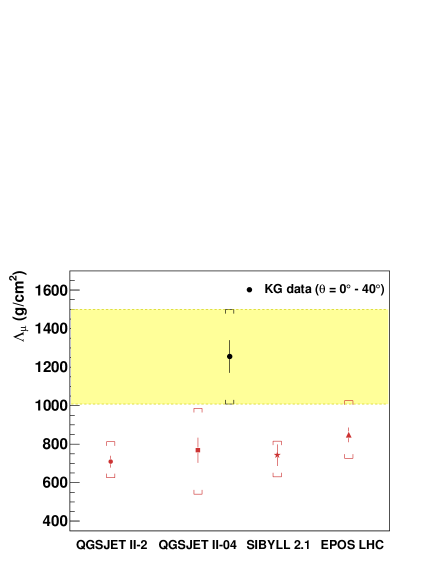
The value of the muon attenuation length of EAS measured with the KASCADE-Grande array is presented in table 1 and fig. 3 together with the values extracted from MC data by applying the same analysis. The quoted values for in case of MC data correspond to the predictions of different hadronic interaction models tested under the assumption of a mixed composition scenario with . It must be mentioned that simulated data has been normalized in such a way that MC muon size spectra for vertical showers are equal to the measured one around . We should also add that the mean primary energies of the shower events lying along the attenuation curves shown in fig. 2 (right) cover the energy intervals and according to the QGSJET-II-02, QGSJET-II-04, SIBYLL 2.1 and EPOS-LHC models, respectively. These energy assignments were estimated from using power-law formulas calibrated with MC data for each zenith-angle interval. A primary cosmic ray spectrum characterized by a mixed composition and a spectral index was used for the energy calibration. Returning to table 1, results are accompanied by their statistical and systematic uncertainties. The experimental systematic error includes (a detailed discussion can be found in B):
-
1.
uncertainty resulting from the CIC method;
-
2.
uncertainty owing to the size of the zenith-angle intervals;
-
3.
uncertainty in the parameters of the muon correction function;
-
4.
systematic bias of the corrected muon number and its model and composition dependence;
-
5.
and uncertainties associated with the EAS core position relative to the center of the KASCADE muon array.
In addition, the MC systematic error includes uncertainties associated with the spectral index and primary composition.
From fig. 3, it is observed that the measured lies above the MC predictions. The deviations of the experimental value from the MC expectations are shown in table 1 along with the confidence levels (CL) for agreement with the model estimations. From both table 1 and fig. 3, it can be seen that the pre-LHC models QGSJET-II-02 and SIBYLL 2.1 show the largest discrepancies with deviations at the level of and , respectively. The corresponding CL’s are and and indicate that the probability of agreement between experiment and the expectations is low for these cases. On the other hand, just slight discrepancies are found for the post-LHC models QGSJET-II-04 and EPOS-LHC, with and , respectively, which imply that both predictions are each in reasonably agreement with the measured value with CL’s of and , respectively. In spite of this, however, the fact that the central values of the QGSJET-II-04 and EPOS-LHC predictions are still below the experimental data could mean that more work is still needed within these post-LHC models to give also a precise description of the KASCADE-Grande air-shower results (this seems to be the case as revealed by the complementary study performed in section 5).
Potential sources of systematic errors which could explain the observed deviation between the expectations and the measurement were studied and are presented in C. Special attention was given to systematic shifts of produced by instrumental effects, reconstruction procedures, EAS fluctuations and environmental effects, e.g., the aging of the muon detectors, the core position and arrival angle resolutions of the apparatus, errors in the reconstructed number of muons from uncertainties in the deposited energy per KASCADE shielded detector, the uncertainty in the correction function, fluctuations on the number of registered particles per muon station, the evolution of the chemical composition of cosmic rays in the energy range considered and the influence of local variations of the atmospheric temperature and pressure. However, the analyses have shown that the disagreement on between MC predictions and the experimental measurement can not be ascribed to any of the above sources. We also investigated the uncertainty in the shape of the muon LDF employed with the EAS data. Here we show that it contributes to the discrepancy, but it is not the leading effect. Therefore, the observed difference very likely originates from deficiencies of the muon predictions of the high-energy hadronic interaction models underlying our studies.
| QGSJET-II-02 | QGSJET-II-04 | SIBYLL 2.1 | EPOS-LHC | KG data | |
|---|---|---|---|---|---|
| Deviation () | |||||
| CL (%) |
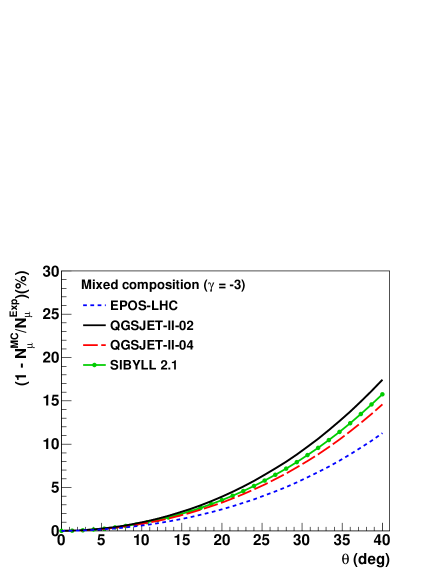
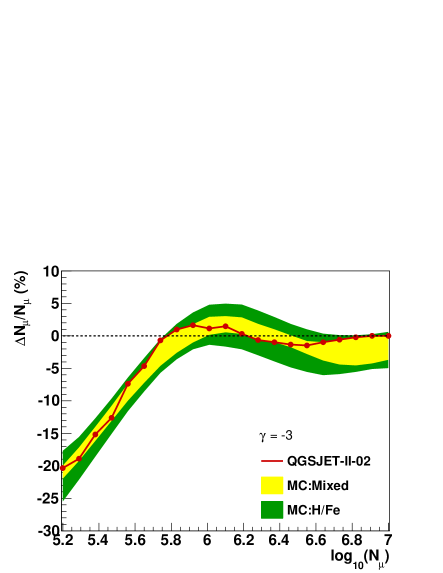
The fact that the experimental value of is greater than the expected values from MC simulations implies that the observed air showers attenuate more slowly in the atmosphere than the simulated ones. It is difficult at this point to quantify the influence of such an effect on the differences between the predicted and measured muon content of air showers at large zenith angles. However, a naive estimation can be done by assuming that for vertical showers the MC predictions for the muon number agree with the measured values at the same energy. Using equation (3), it is found that the differences, , expected between measurements and MC predictions at different zenith angles, are given by
| (4) |
where the simulated attenuation curves have been normalized at in such a way that . Predictions do not take into account systematic uncertainties from the reconstruction method, experimental errors or the analysis technique. From fig. 4 it is observed that the differences increase exponentially for inclined showers becoming as high as at . Note that QGSJET-II-02 gives the highest differences due to its lower muon attenuation length (c.f. table 1). On the contrary, the smallest differences are found in case of EPOS-LHC. In general, the results shown in fig. 4 imply that a higher should be expected in data than in MC events for air showers arriving at high zenith angles. Of course, it could also happen that both measurements and predictions are in better agreement at high zenith angles, which would suggest a smaller muon content for the actual vertical EAS in comparison with simulations. To settle down the question a direct measurement of the shower energy, independent of MC calibrations as much as possible, would be necessary. Unfortunately this is not the case for KASCADE-Grande, where the energy is estimated in a model dependent way from the measured EAS observables and has an uncertainty associated with the primary composition [21].
5 The muon absorption length
To have a better understanding of the observed deviations and to avoid some of the sources of systematic uncertainties discussed above, we study now the zenith-angle evolution of the muon component of EAS using the mean local density of muons instead of the observable for showers with about the same primary energy. The quantity reflecting this evolution is the muon absorption length, , also called the attenuation length of [28]. To proceed in a model independent way, the CIC method is applied again, however, on in place of the muon number, since the former has a lower systematic uncertainty and its observed zenith-angle evolution is in better agreement with the MC calculations. Besides, because using as an energy estimator provides a way to avoid possible systematic errors associated with that might contribute to the discrepancy observed on the muon content of EAS. The only drawback is that is subject to bigger shower fluctuations than at the same energy, which causes a reduction of the measured for decreasing values of the shower size. This effect is the result of a bias driven mainly by the influence of shower-to-shower fluctuations of on the EAS selection. In order to reduce it, only data with large were selected for the present study, in particular, with .
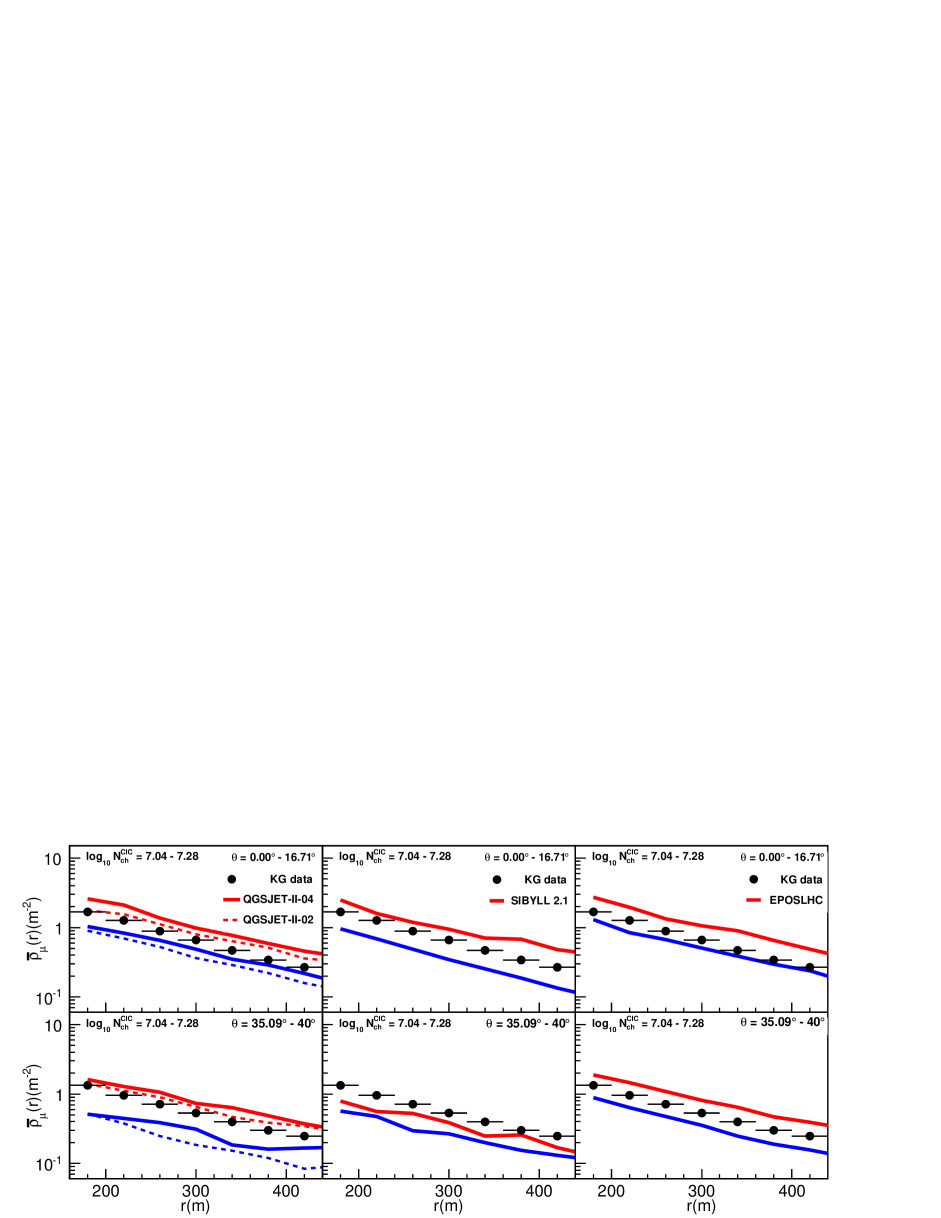
Using the CIC method, was estimated (see D) and afterwards employed to calculate the equivalent charged number of particles, , at a zenith angle of reference, (the mean of the zenith-angle distribution of experimental data). This shower size observable was then used to select events in the interval , roughly corresponding to the energy region777In particular, for a mixed composition assumption and a power-law energy spectrum , the intervals include data with mean energy in the ranges of , , and for QGSJET-II-02, QGSJET-II-04, SIBYLL 2.1 and EPOS-LHC, respectively. Energy estimations were based in MC calibrated relations between the primary energy and the shower size for . from to . Events were further classified into five zenith angle intervals (with the same ranges used in the analysis of ) and within each of these bins, the mean muon densities at the shower plane, , were obtained. The procedure consists of dividing the shower plane in concentric rings ( width each) and then, for each interval and radial bin, in dividing the total number of detected muons by the corresponding sum of projected effective areas of the muon detectors registered as active during the data taking of each selected event. No corrections for atmospheric attenuation effects were included when passing the muon data from the coordinate system of the detector to that of the shower plane. The experimental results for the mean LDF of muons within the above ranges are presented in fig. 5.
To quantify , absorption curves vs were further calculated. The curves were obtained from the distributions by applying several cuts at fixed distances from the EAS core at the shower plane (see fig. 5, for example). Cuts were applied in the interval , where statistical fluctuations are low. For each absorption curve, the muon absorption length, , was then estimated by fitting the data with the following relation:
| (5) |
where is a normalization parameter.
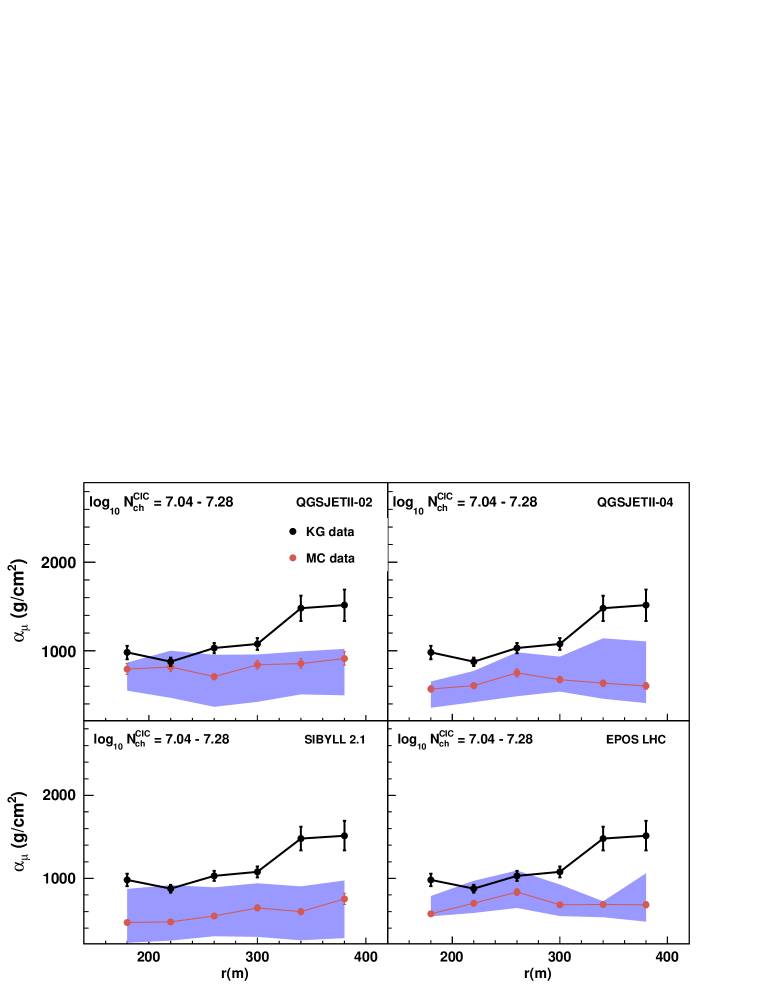
Fig. 6 shows the values of extracted from the KASCADE-Grande data for the chosen interval together with the predictions of MC simulations for different hadronic interaction models. The MC values were calculated for a mixed composition assumption and a primary spectral index of . The predicted curves are accompanied by shadowed error bands that take into account the systematic errors due to both, composition and spectral index uncertainties in the primary spectrum. The errors associated with the spectral index were obtained by repeating the calculations with and , while the errors due to composition were estimated by considering the distinct primary nuclei simulated in our MC data samples.
It is evident from fig. 6 that the evolution of the measured distributions in the atmosphere is not in agreement with the expectations of the hadronic interaction models studied in this work. We found that the measured tends to stay above the MC predictions and that there is only a marginal agreement between the models and the experimental data for radial distances closer to the shower core. Fig. 6 shows that the differences between the measurements and the model calculations rise with the lateral distance to the core of the EAS. Strikingly, the parameter exhibits a similar radial behavior as it was verified during the study of systematic errors (see B) and in further analyses based on muon data around the EAS core888We selected events with EAS cores within from the center of the KASCADE array and applied the whole analysis described in this paper to extract from the MC and the experimental data. For QGSJET-II-02, we found a negligible variation of with respect to the corresponding value of table 1, but for the measured data a reduction of almost was obtained, increasing the agreement with model predictions.. In consequence, we can conclude that the inconsistencies observed in the study of are still present in the data for the local muon densities. Therefore, the referred disagreements are not an artefact of the treatment of the data or the way in which this parameter is estimated from the particle densities at the muon detectors.
Thus, in view of the above results, it seems entirely justifiable to say that the discrepancies observed in the analysis of the local distributions are the main responsible for the disagreement discovered in the analysis of . This asseveration was further supported by additional tests carried out with Monte Carlo data (c.f. C), in which we observed that after increasing in MC simulations to reproduce the measured value, the experimental result of can be recovered from the MC events.
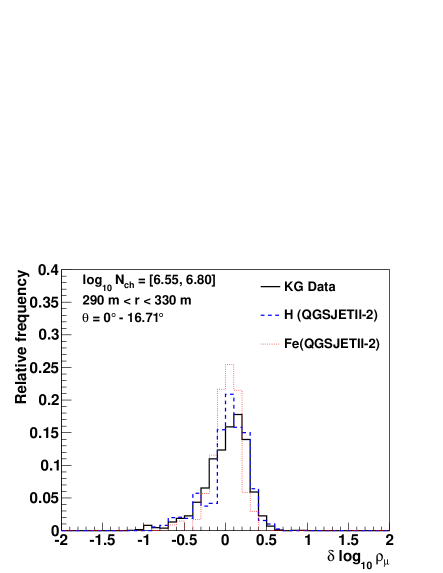
Here, it is important to add that despite the above deviations, the measured muon densities for along the corresponding CIC curve are still bracketed by the estimations from the QGSJET-II-02, QGSJET-II-04 and EPOS-LHC models for proton and iron nuclei, at least for the interval . This is demonstrated in fig. 7. In contrast, for SIBYLL 2.1, the situation is different, model predictions for proton and iron primaries do not contain the measured data for inclined showers () within the shower size range . This result reveals an additional deficiency of the SIBYLL 2.1 model. However, it does not allow us to determine whether the model underestimates or overestimates the muon content of EAS. The reasons are that, first, the result depends on the reference angle that is used to find and, second, the energy calibration in KASCADE-Grande is model and composition dependent.
6 Discussion of the measurements
The attenuation length of was measured at KASCADE-Grande for energies between and . The measured value is higher than the predictions of QGSJET-II-02 and SIBYLL 2.1 but just exceeds slightly the model calculations for EPOS-LHC and QGSJET-II-04 (see table 1). The presence of such deviations was confirmed by the study of the coefficients of the distributions measured locally at KASCADE-Grande around . This analysis showed that the actual parameters become increasingly bigger than the predicted MC values at large distances from the EAS core (c.f. fig. 6). The anomaly seems to be mainly associated to a bad description of the dependence of the muon LDF’s by the MC simulations (see C.4 and C.5). On the grounds of the above results, a general conclusion is derived that the high-energy hadronic interaction models here analyzed can not describe consistently all the muon data of EAS measured with the KASCADE-Grande array at different zenith angles999Recently the post-LHC version of the SIBYLL model was released [29]. The performance of this model at KASCADE-Grande is still under investigation. Results will be presented elsewhere..
When extracting from the experimental data some input from the MC models was unavoidable. First, through the lateral energy conversion function (LECF) to estimate the number of muons detected per muon station, then through the muon LDF employed to estimate and finally, through the muon correction function introduced to correct for systematic biases. One may suppose that the inclusion of such functions could invalidate the comparison between data and MC predictions. Nevertheless, the model-experiment comparison of the EAS data is completely justified, as we have processed and analysed both the experimental and simulated events in identical ways using the same MC functions. Under the foregoing procedure, however, it may become unclear whether the observed discrepancies are due to the studied phenomenon or to a misleading description of the aforesaid functions by the hadronic interaction models.
The possibility that the MC based functions introduce the observed deviations in the results seems to be weakened in view of the small model dependence that these functions show (c.f. [13] and A) and due to the small variations that the relative systematic errors of exhibit with the model (see fig. A1, left). These kind of arguments are often invoked to validate some present studies (see, e.g. [7]). However, one can argue that they do not constitute a solid proof against the possibility being discussed. In this regard, it is desirable to rely on additional analyses. For this reason, we have run the complementary tests performed in section 5 and C. As we have seen before, the former shows that anomalies are still present when performing the analysis directly on the data without any reference to the muon LDF or the corresponding correction function (see fig. 6). While studies on C.4 have pointed out that the experimental uncertainties on the shape of the muon LDF have not a leading effect on the observed deviations. The tests however did not deal with the muon LECF.
The muon LECF correlates the energy losses by all particles in the KASCADE shielded stations with the number of crossing muons. Therefore, if the real contribution from electrons, photons and hadrons is not well described by the models an important bias could be introduced to the final estimations of the number of muons in measured EAS. Here, we are confident, however, that the modeling is reliable at least for particles other than muons. One of the reasons is that model independent studies performed in [13] have shown the absence of systematic deviations between separate estimations of for vertical EAS (where the contribution of muons is not dominant) with the KASCADE and the Grande arrays, although they were obtained based on independent LECF’s. And two further reasons are that, as we will see at the end of this section, the measured parameter shows a better agreement with the MC predictions and the attenuation length for shower electrons obtained with Grande data seems to be in pretty good agreement with the one derived from KASCADE measurements. Hence, the problem of the observed anomalies could rely in the MC estimations of the energy deposits of the muons in the KASCADE penetrating detectors at different radial distances to the EAS core and distinct zenith angles. If so, then a lower/higher contribution per muon to the LECF of muons would be required at small/large zenith angles in order to reduce the magnitude of the measured and parameters and to bring the data into agreement with the corresponding MC predictions. As a matter of fact, this possibility is not in conflict with the general conclusion drawn at the beginning of this section.
At the moment, for the following discussions, we will assume that the role of the muon LECF in the deviations is small as expected from the MC simulations and within this context we will explore some scenarios implied by the observed deviations.
Possible interpretations of the observed anomaly
One of the consequences of the mismatch between the observed and predicted is that the measured muon shower size spectrum of cosmic rays attenuates more slowly with increasing atmospheric depth than the simulated spectra. This result could be interpreted in terms of an incorrect prediction of the muon content of vertical and inclined EAS by the high-energy hadronic interaction models. For example, could be too low for inclined showers in MC simulations, or too large in case of vertical EAS.
There are several possible ways to modify the muon number of EAS in simulations in order to obtain a larger muon attenuation length. Some tests carried out with EPOS-LHC and QGSJET-II-04 seem to indicate that at KASCADE-Grande, for EAS below , we are very close to the region of the maximum of the muon longitudinal profile. This implies that if the shower maximum is closer to the ground then , as reconstructed with equation (3), will raise and even more will become more sensitive to the position of the shower maximum. That is a geometric effect that should hold for any hadronic interaction model (at least it was confirmed for EPOS-LHC and QGSJET-II-04 using EAS generated by light primaries). This way, under this situation, one way to increment the value of is by increasing the interaction depth of primary particles, because in this case the shower maximum would be even closer to the observation level [30]. A similar effect can be obtained by having air showers that penetrate deeper into the atmosphere [31]. The need for more penetrating air showers in simulations is a plausible situation, which seems to be supported by both the analysis of the muon production heights measured with the muon tracking detector (MTD) of the KASCADE observatory [32, 33] and the study of the flatness of the distributions measured with the KASCADE muon array (see C.4). The former has revealed that the maxima of the muon production height distributions occur at lower altitudes than in MC simulations, while the latter has shown that the measured muon LDF’s are steeper than the ones obtained from the MC models. That increases when the shower maximum is closer to the detector level might be verified at the KASCADE-Grande data from the studies performed in C.6. There, the variation of the muon attenuation length with the atmospheric ground pressure or, equivalently, the atmospheric depth was calculated. In particular, an increment of of seems to be observed in the KASCADE-Grande data when decreasing the ground pressure by . Again, we should remark that this only works when the maximum of the muon longitudinal profile is close to the ground, which seems to be the case for the EAS measured at KASCADE-Grande.
Larger values can also be achieved in simulations by requiring a harder energy spectrum for shower muons at production site [23]. It is worth to notice that if muons have a harder spectrum and hence a larger attenuation length, then the maximum of the muon longitudinal profile will be closer to the ground. This will further increase the magnitude of if the maximum is already close to the observation level. Therefore, one of the factors which could have a remarkable effect on is the muon energy spectrum at production site. Amongst the models analyzed in this work, QGSJET-II-04 and EPOS-LHC are the ones with the hardest spectra of muons, respectively. This might be the reason why they predict the largest muon attenuation lengths in comparison with the other models. There are two possible ways to achieve a harder muon spectrum in MC simulations: by an increase in the amount of high energy muons in the EAS or by a decrease in the number of low energy muons in the shower101010In both cases the discrepancy would depend also on the atmospheric grammage decreasing at altitudes closer to the height where the maximum number of shower muons is reached.. In order to discriminate between these physical situations in the present models an analysis of the muon data at different energy thresholds is compelling111111Fortunately, such analysis can be performed at KASCADE-Grande using the surface muon array, the underground muon tracking detector (MTD) and/or the tracking chambers from the central detector [34]. Since such analysis is underway, further hints to check the deficiencies of the models concerning the energy spectrum of muons may be obtained in the future..
In addition to the muon attenuation length, the coefficients may also provide some information about overall differences between the energy spectrum of muons from MC and measured data. What we have seen in fig. 6 is a deviation, which seems to increase with the radial distance to the shower core (measured at the shower plane). This behavior might point out important deficiencies of the hadronic interaction models in describing also the correct proportion of low energy muons to high energy ones but as a function of the lateral distance, . At closer distances to the EAS core, fig. 6 seems to suggest that an increase in the amount of high energy muons could be appropriate at least for QGSJET-II-04 in order to reproduce the experimental data on , since the contribution of high energy muons to the LDF’s becomes more important close to the shower axis [5, 35, 36].
On the other hand, at larger distances from the EAS core, where low energy muons are more important, the aforesaid figure seems to indicate that modifications are necessary for all the studied models. In this case, the observed deviations might call not only for a reduction in the amount of low energy muons in the simulated EAS, but also for an increment in the content of muons at higher energies. The latter in view of the fact that as the zenith-angle increases, both the experimental energy threshold and the mean energy of the muons rise [30]. This way, the muon content in inclined showers becomes more sensitive to the high energy part of the spectrum, which can lead to a rise in the value of at large distances from the core if the number of high energy muons is increased.
Role of the low-energy hadronic interaction models
We are assigning the discrepancy between the measurements and the simulations to the influence of the high-energy hadronic interaction models. But, as we measure muons with a energy threshold at sea level, both the muon number of EAS and the lateral density of muons are affected by the decay products of low energy charged mesons from the last part of the shower development [35, 37, 38]. Thus, a change in the description of the low-energy hadronic interactions might also have important modifications to the magnitudes of and , mainly at large distances from the core. Therefore, low-energy hadronic interaction models might be playing a relevant role in the discrepancy. The issue will be investigated in detail in forthcoming studies.
Consequences of the anomaly
Due to the rapid attenuation of the simulated data in comparison with the actual one, the discrepancy has some implications for the energy spectrum and the composition studies of cosmic rays when air-shower data from different zenith angles are employed. In the first case, the anomaly will introduce a shift to higher energies on the primary spectra of cosmic rays reconstructed with data from inclined showers. This shift was observed in the analysis of [21], where it was shown that, for measured EAS with , the anomaly introduces an uncertainty of at and at in the respective all-particle cosmic ray flux when using QGSJET-II-02 as a framework for the energy calibration of the data.
As a consequence of the above shift, the elemental composition of cosmic rays as inferred from the measured data using the high-energy hadronic interaction models appears heavier with increasing zenith angles. Indeed, inside the framework of the discussed hadronic interaction models, the analyses of the muon densities at different bins and zenith-angle intervals (c.f. fig. 7) show that the actual distributions move gradually towards a heavier composition for inclined showers. As an example, EPOS-LHC favors a light composition at around for vertical EAS, while for inclined showers the model indicates that a mixed composition is dominant in the experimental data at roughly the same energy.
The source of disagreement between the measured and the predicted in KASCADE-Grande could be also responsible for another anomaly detected at higher energies by the Pierre Auger collaboration. Measurements performed with the Auger observatory have shown an excess of the total -content () in experimental data at ultra-high energies in comparison with expectations from modern MC simulations. Such anomaly has been observed also with the Yakutsk array () [39]. The discrepancy seems to be energy [7] and zenith-angle dependent [40] and can not be described by any of the available hadronic interaction models. Remarkably the largest deviations observed with the Auger detector between MC predictions and experimental data seems to occur for inclined showers and the highest energies. The latter might imply that model predictions can not even match the muon attenuation length of EAS at ultra-high energies and that such effect could evolve with the shower energy. A possible energy dependence of the anomaly will be investigated in future studies at KASCADE-Grande by adding EAS data with shower energies below from the KASCADE array.
With the aim of having a better understanding of the muon deviation measured at the KASCADE-Grande detector, independent studies from other observatories on the matter could be useful, specifically, at the energy range explored in this paper, using the current MC models. Unfortunately, such studies are absent at the moment. Muon data exist around from HiRes-MIA () [41], the EAS-MSU array () [42] and the IceTop () experiment [43], but the analyses have been restricted only to look for a possible muon excess in the measured data over model predictions in a zenith-angle independent way. Hence, it is not possible to say whether the anomalies are also present at the experimental conditions (i.e., muon energy thresholds, radial ranges and air grammages) of such observatories. Undoubtedly these information would help to provide a wider picture of the above problem and narrow down the number of possible solutions.
Remarks about
Regarding our results corresponding to the attenuation length of (see D), we see a better agreement between the experiment and the MC simulations than in the case of . In fact, the deviations of the measured from model predictions are less than . By comparing the results obtained with the QGSJET-II models, we observe that the post-LHC improvements performed in the last version of QGSJET-II did not spoil the agreement between the predicted and measured values of . That is an important constraint that, among other ones (such as the electron-muon correlations [44]) must be supervised when applying modifications to the models.
Since, at the energies and zenith angles involved in the analysis, is dominated by shower electrons, the fact that the value of is closer to the predictions of the models might indicate that the cause of the anomaly observed in the longitudinal development of in the atmosphere has not a strong impact on the atmospheric attenuation of the electromagnetic component of the EAS.
We observed that the magnitude of is smaller than . This is expected due to the stronger attenuation of in comparison with and the dominance of electrons over muons in for our selected data set. Following the same reasoning, we should also expect to be closer to the attenuation length for the number of electrons, . In order to verify the consistency of the results, we calculated and compared it with . By applying the CIC method to the experimental data on , we obtained from fits to the data in the interval (only the error from the global fit is quoted)121212The result is in full agreement with the measurements performed with KASCADE at lower energies. In this case, was found to vary between and using the CIC method in the interval of [48].. This value is just below . Therefore, in light of the previous discussions, we found that, inside the corresponding experimental uncertainties, the measurements of and are not inconsistent between each other.
7 Implications for the features of hadronic interaction models
The physical origin of the discrepancy is not yet clear. Insofar, as the attenuation of muons in matter is concerned, this process is almost completely described by QED (with the exception of deep inelastic scattering, which contributes to the energy loss only less than %). Assuming that electromagnetic processes in air showers are well described by the EGS4 [45] code used in COSIKA, any inconsistency between the measured and predicted muon attenuation lengths must be attributed to the modeling of hadronic interactions or to the description of the hadronic shower development in the atmosphere. This way, our results would indicate that the high-energy hadronic interaction models QGSJET-II-02, SIBYLL 2.1, EPOS-LHC and QGSJET-II-04 need modifications to resolve the discrepancy with the muon data from KASCADE-Grande.
In the last section we discussed some possible modifications of EAS characteristics in the models, which might help to solve the muon attenuation length problem observed at KASCADE-Grande, e.g., an increase in the depth of the first hadronic interaction in the EAS, a deeper muon production height and a harder muon energy spectrum at production site. Now, we will discuss some changes of the characteristics of the internal parameters of the high-energy hadronic interaction models that might produce the variations in the EAS observables desired to explain the anomaly.
In order to change the depth of the first interaction of the incident cosmic ray, , the relevant parameter is the cross section for inelastic collisions with air, . Since, [24], the depth of the first interaction can be increased by reducing . However, in this regard, there is not much room left due to the strong constraints set on the models by the LHC proton-proton data [46, 47]. Consequently, this possibility might just have a minor contribution to the discrepancy after all.
A bigger effect could be obtained from a deeper muon production depth (MPD) in the atmosphere, . The latter can be achieved by modifying the description of pion-nucleus interactions, which is an important source of uncertainty in the models. More specifically, from detailed studies performed in [49, 50], can be augmented principally through an increase of pion elasticity, a smaller pion-air inelastic cross section, harder secondary hadron spectra in pion-air collisions and/or a copious production of (anti-)baryons. The last option, however, it is not useful to enlarge as we will explain later, therefore it might be discarded as a possibility to reduce the anomaly. The remaining options, on the other hand, could be coherent with an increase of . Here, special care must be taken to be consistent also with the Pierre Auger measurements on the average value of , i.e. the maximum of the profile [6]. In case of EPOS-LHC, for example, a further increase of is not supported by the Auger data. The reason is that the respective model predictions are well above the experimental values at ultra-high energies. In this case a reduction of is imperative. This can be achieved, for example, through a decrease of the elasticity in pion interactions [49] and/or a suppression of forward production of baryon-antibaryon pairs [50]. The first change could lead to an opposite effect in to the one desired, while the second one could be coherent with the intended objective.
Of great importance for the problem could be the hadron and resonant production processes that keep energy of the shower in the hadronic channel and which could be misrepresented in the models. They can modify the expected energy spectra of muons and, hence, the predicted muon attenuation lengths. To this category belongs the creation of (anti-)baryons in pion-air interactions. It is known that the abundant production of baryon-antibaryon pairs enhances [51, 52], but it also increases the proportion of low energy muons in the shower. Thus, if it is overestimated, it might shorten the muon attenuation length and, hence, it could increase the discrepancy. That seems to be happening in EPOS-LHC as it is suggested by Auger data on . In principle, solving the problem of low energy muons in EPOS-LHC will put higher in the atmosphere in agreement with the Auger observations, but it will also produce a harder muon energy spectrum and hence an increase of the distance between the MPD (where the muons are created) and the maximum of the muon longitudinal profile putting the latter closer to the ground, which is an important factor to increase .
A further mechanism that changes the muon energy spectra of EAS and is not well described in some models is the production of resonances in pion-nucleus interactions. This process could also prove to be valuable to reduce the proportion of low energy muons at ground and to increase the magnitude of in the models. The reason is that this mechanism enhances the production of high energy muons during the early stages of the EAS. After production, the mesons decay almost immediately into a pair of charged pions [52]. At the early stages of shower development, these pions have a bigger probability to decay than to interact in the air (because the density of the atmosphere is low at high altitudes) resulting in the creation of high energy muons [53]. In particular, QGSJET-II-02, SIBYLL 2.1 and EPOS-LHC underestimate the fixed-target experimental results on the very forward spectrum of -mesons in pion-nucleus interactions [54]. Consequently, an enhancement of the above mechanism in these high-energy hadronic interaction models is necessary. This improvement might decrease the differences between models and experiment in these cases.
The transverse momentum () distributions of charged pions generated in pion-nucleus collisions may also need further tuning inside the current high-energy hadronic interaction models, as revealed by the results of the NA61/SHINE experiment about the spectra of charged pions in interactions [54]. The distributions of ’s have a relevant influence on the muon LDF’s. Hence, it seems plausible that they would have also some impact on the magnitude of as extracted from the local measurements of muons in EAS at KASCADE-Grande.
Finally, one could question the role of the approximations implemented in EGS4 [45] in the discrepancy. This is an open issue, which has not been fully investigated. One might argue, therefore, that the observed anomaly could receive some contributions from an inaccurate description of the electromagnetic process behind both the attenuation of muons in the atmosphere or the photoproduction of low energy muon pairs. In spite of that, we might stress the role of the hadronic interaction models in the observed anomaly, as there are no direct experimental evidence for the existence of problems with such approximations which could give further support to the aforesaid hypothesis.
8 Conclusions
In this paper, the QGSJET-II-02, SIBYLL 2.1, EPOS-LHC and QGSJET-II-04 high-energy hadronic interaction models have been tested by comparing their predictions for the attenuation length of muons in EAS with the measurements performed with the KASCADE-Grande experiment at the energy interval . In particular, it was found that the experimental value is above and from the QGSJET-II-02 and SIBYLL 2.1 expectations, respectively, and just and from the corresponding QGSJET-II-04 and EPOS-LHC predictions. The above implies that the studied pre-LHC models do not match the measured value of , while the post-LHC models are in relatively good agreement with the data. Despite of the latter, however, the fact that the expected muon attenuation lengths from the post-LHC models are below the actual value seems to suggest that these models need further tuning to describe the KASCADE-Grande data.
To investigate the possible origin of the above deviations, predictions for the average muon densities at different zenith angles and along attenuation curves in shower size were also confronted with the experiment. In general, it was found that the measured absorption lengths of the aforesaid mean muon density distributions become bigger than the predictions of the high-energy hadronic interaction models analysed in this work at large distances from the EAS core. According to complementary tests performed with MC simulations, we found that the aforesaid discrepancies could be the cause of the observed differences between the measured and the expected values.
Finally, the attenuation length of was also measured and compared with the predictions of the hadronic interaction models. In this case, good agreement between the experiment and expectations was observed with differences ranging from to .
In conclusion, the QGSJET-II-02, SIBYLL 2.1, EPOS-LHC and QGSJET-II-04 hadronic interaction models do not reproduce consistently the zenith-angle behavior of the selected KASCADE-Grande data on the local muon content (with threshold energies at vertical incidence) of EAS.
Acknowledgments
The authors would like to thank the members of the engineering and technical staff of the KASCADE-Grande Collaboration, who contributed to the success of the experiment. The KASCADE-Grande experiment was supported in Germany by the BMBF and by the ’Helmholtz Alliance for Astroparticle Physics - HAP’ funded by the Initiative and Networking Fund of the Helmholtz Association, by the MIUR and INAF of Italy, the Polish Ministry of Science and Higher Education, the Romanian Authority for Scientific Research UEFISCDI (PNII-IDEI grants 271/2011 and 17/2011), and the German-Mexican bilateral collaboration grants (DAAD-CONACYT 2009-2012, 2015-2016). J.C.A.V. acknowledges the partial support of CONACyT (grant CB-2008/106717) and the Coordinación de la Investigación Científica de la Universidad Michoacana.
Appendix A Muon Correction function
The location of the muon detectors at the fringe of the Grande array, the limited size of the muon array and the detection and reconstruction procedures introduce a systematic error on the muon size, which depends on the arrival angle, the core position and the shower size. In order to improve the accuracy of the EAS observable and eliminate, as much as possible, the influence of the muon systematic errors on the study, a muon correction function is applied. The correction is achieved by using a single function that is derived from MC data, in particular, the QGSJET-II-02 data set, which has a better statistics and hence a reduced statistical error. Herein the shape of the function is parameterized in terms of the shower core position at ground, the shower size and the EAS zenith and azimuth angles. In the derivation of the correction function, the mixed composition scenario is assumed obeying to the uncertainty of the elemental abundances in cosmic rays. Also a spectral index is employed.
The use of a single correction function on the muon data is justified since it is nearly independent of the composition and the hadronic interaction models explored here. Using other hadronic models and/or different composition assumptions just introduces small relative differences (within ) in the correction function. This can be appreciated in fig. A1 (left), where the mean value of the muon correction function from QGSJET-II-02 is plotted against the uncorrected for showers with cores inside the KASCADE-Grande fiducial area and EAS axes between and . The plots are shown along with two error bands that cover the range of results for alternative correction functions derived individually from different hadronic interaction models and composition scenarios. In fig. A1, (left) with low , the correction on the reconstructed muon number is large. That is because for low energy events located outside the KASCADE detector area the number of muons is overestimated. The reason is well known and it is due to the fact that the LDF that is used to get on an event-by-event basis is steeper than the expected distribution of local muon densities for the EAS with the abovementioned characteristics [13]. At high energies, this difference decreases, which reduce the uncertainty of the reconstructed and thus the magnitude of the applied muon correction as observed in fig. A1 (left).
The mean systematic errors of the corrected muon number are displayed in
fig. A1 (right) and fig. A2 as a function of the the muon
size, the core position and the shower zenith angle in the full efficiency
and maximum statistics regime. We can see that the final systematic errors are
less than . Although, this remaining bias is small we have not neglected it
and have considered it in the evaluation of the final uncertainties of the
muon attenuation length.
Appendix B Error estimation on
In table B1 the total uncertainties for are shown with the individual contributions from statistical and systematic errors. For the case of MC simulations the total errors vary in the range from to , while for experimental data they are found to be between and . In the following, we will list both the main statistical and systematic uncertainties that we have taken into account in the above estimations and briefly describe how they were calculated.
Statistical error. For the estimation of the influence of statistical fluctuations on the measured , intensities are randomly drawn from the original KASCADE-Grande muon shower size spectra by allowing the number of events per interval and angular bin to fluctuate according to a Poisson distribution. For each trial, the integral intensities are then calculated from the drawn spectra for each zenith-angle interval according to eq. 2. Afterwards, the attenuation length is estimated with the usual method. The statistical error is therefore computed from the observed variability of after 50 trials. In case of MC simulations, the procedure is similar, but with a single difference: as the MC data are weighted we use the formalism of the equivalent number of unweighted events [55] in the construction of the trial spectra, which allow us to properly evaluate the influence of statistical uncertainties on the expected values.
Let be the number of simulated events in a given -bin and , the individual weights of such events, where . Then the number of events in the corresponding bin of the weighted histogram is , with , the respective statistical error. In general, does no follow a Poisson distribution, therefore, we replaced it by the equivalent number of unweighted events . This quantity is Poisson distributed and has the same relative statistical uncertainty as . From here, we obtain the trial spectra that we require by allowing to fluctuate in each -bin according to a Poisson distribution and after multiplying the result with a corresponding factor to properly normalize the content of the bin.
| QGSJET-II-02 | QGSJET-II-04 | SIBYLL 2.1 | EPOS-LHC | KG data | |
|---|---|---|---|---|---|
| Statistical error () | |||||
| Statistical fluctuations | |||||
| Systematics () | |||||
| Muon systematics | |||||
| Core far from KASCADE | |||||
| () | |||||
| Core close to KASCADE | |||||
| () | |||||
| Bin size | |||||
| Global fit | |||||
| Muon correction function uncertainties | |||||
| Broader zenith-angle interval | |||||
| (Four angular bins) | |||||
| Number CIC cuts | |||||
| Narrower CIC interval | |||||
| () | |||||
| Spectral index uncertainties | |||||
| () | |||||
| Composition | |||||
| Total () | |||||
Error from the remaining systematic bias of the corrected muon number. Its contribution to the total error is obtained by propagating the uncertainties of the corrected to the differential spectra and then to the integral spectra employed in the derivation of the attenuation length. The systematic biases of the corrected were estimated from MC data (see, for example, figs. A1 and A2). In case of simulations, they were applied in correspondence with the composition scenario and the hadronic model under study. In contrast, for measured data, all systematic biases that are predicted by the hadronic models for several composition scenarios (i.e. five pure primary nuclei, from H to Fe, and a mixed composition assumption) were used. We then compared the biases introduced in the measured muon attenuation length by these different hypotheses. The highest and lowest deviations are quoted as the errors of the measured from the uncertainties of the corrected muon number. We proceeded in this way due to the lack of knowledge of the actual systematic bias of the observed , the real hadronic interaction model and the primary composition of cosmic rays. As a matter of fact, this is the reason why the contribution of the systematic bias of the corrected is one of the biggest ones to the total experimental error. For MC simulations, on the other hand, this contribution was found to be small. The latter due to the fact that both the composition and the model are known.
Influence of the EAS core position in the systematic uncertainty of . The contribution of this systematic source was investigated by dividing the central area into two smaller regions with approximately the same statistics. The division was done by applying a radial cut around from the center of the KASCADE array. To estimate the systematic errors, the muon attenuation lengths from the data collected on each surface were calculated independently and were later compared with the standard result for the whole area. The two differences obtained in this way were then cited independently as the errors due to the EAS core position. Using this analysis, we found a dependence of the measured attenuation length on the radial distance to the KASCADE center (see table B1), which is the origin of a major contribution to the total experimental uncertainty. By performing additional studies, we arrive at the result that the aforesaid EAS core dependence is due to a small decrease of the estimated number of muons, which is more important for vertical showers, as we move far away from the center of the KASCADE array. In MC data, this behaviour was not observed. In this case, the error analysis yielded just a mild dependence of the predicted with the EAS core position.
Uncertainty from the CIC method. This contribution covers the propagation of errors arising from the global fit and the variation of the results with the size of the zenith-angle intervals (studied by dividing the full zenith-angle range in four intervals with the same aperture), the number of CIC cuts applied (using seven and three cuts instead of five), the width of the CIC interval (employing a narrower muon range for the fit: ) and the size of the -bins. The total experimental error arising from the uncertainties in the CIC method is found roughly between and , while the corresponding MC error lies between and . As we can see, both contributions are almost of the same order of magnitude and constitute also an important source of uncertainty in the estimation of the measured and predicted muon attenuation lengths, respectively.
Errors of the parameters of the muon correction function. To evaluate the influence of this contribution on the final results, we propagated the errors in the determination of the parameters of the correction function (obtained under a mixed composition assumption with the QGSJET-II-02 model) to the data and hence to the muon attenuation lengths. From table B1, we observe that the resulting shifts in the predicted and measured values are in both cases small. Therefore this systematic source is not dominant.
Uncertainties in the spectral index of the primary cosmic ray spectrum. Only the uncertainties of the MC based predictions take into account this source of systematic error, which is evaluated by using two different values for the spectral index: and , in the simulated data. The range of variation found in the corresponding results with respect to the standard value with is quoted as the systematic error from this contribution. In general, it results that the uncertainty in the spectral index has no major influence on the magnitude of expected from the high-energy hadronic interaction models.
Uncertainties in the primary composition. Systematic uncertainties for MC predictions include also the spreading of values when pure primary cosmic ray composition scenarios are considered. For these estimations, we employed five distinct elemental primary nuclei: H, He, C, Si and Fe. On the other hand, in order to reduce the influence of possible statistical effects, we have increased, in each case, the size of the zenith-angle bins employed in the CIC method. For this purpose, we reduced the number of intervals in the analysis. In particular, we employed four zenith-angle ranges, i.e. and , all of them with approximately equal aperture. We then extracted using the standard procedure for each primary composition assumption. The biggest and smallest values of derived in this way for each model were considered as the errors of the expected associated with the cosmic ray composition uncertainty. As we can see from table B1, they constitute the major source of uncertainty in MC predictions. It is worth to point out that, for measured data, this source of systematic error is already taken into account. Specifically, it is considered when calculating the contribution to the total experimental uncertainty due to the systematic biases of the corrected for each of the aforementioned primary nuclei.
Appendix C Further systematic checks
In this part of the paper, we evaluate the influence of suspected
sources of systematic errors that might be at work in this analysis.
Aging of the muon detectors From the experimental point of view, one of these possibilities is the natural aging of both the plastic scintillator detectors and the PMT’s of the KASCADE muon detectors. To quantify this effect, the measured data was divided in three subsamples with effective observation times of approximately the same order of magnitude and ordered in time. For each subset of data, the muon attenuation length was estimated (table C1). No dependency of the measured on the time is observed. All values for the three different periods are in very good agreement within their own errors and are in accordance with the mean value shown in table 1 for the whole measured data sample (considering only statistical uncertainties, deviations are between and ). In consequence, it can be concluded that the aging of the muon detectors is not responsible for the observed discrepancy between the measured and the predicted muon attenuation lengths.
C.1 Evolution of the elemental abundances of cosmic rays
As we know from detailed studies performed in [20, 56, 57], the chemical composition of cosmic rays in the energy interval analysed is changing from light to heavy. Therefore the actual event samples contain a wide range of early and late developing showers, which might lead to a significant increase of in comparison to the results with a single or equal-abundance composition scenarios. To quantify the influence of this effect, we used a toy model for the elemental composition of cosmic rays between and following the results of [20, 56, 57]. The model included the spectral features observed in the light and heavy components. Using the data from QGSJET-II-02 along with this elemental abundances, we calculated . The result was just smaller than the one obtained for the mixed composition assumption based on equal abundances. Therefore, the changing elemental abundances of cosmic rays in the studied energy regime is not causing the observed anomaly.
| Period | Effective time (s) | () | |
|---|---|---|---|
| Sample 1 | |||
| Sample 2 | |||
| Sample 3 |
C.2 Fluctuations on the number of registered muons per station
Another interesting possibility is the influence of fluctuations on the number of registered muons per KASCADE detector. The number of muons collected by a muon station is in general small, therefore fluctuations may play an important role here. In addition, fluctuations from MC simulations for might be different from the experimental ones. All these effects together may lead to a bias in the reconstructed explaining the observed deviations. In order to find out whether fluctuations on are responsible for the deviations, QGSJET-II-02 simulations were employed. First, fluctuations were obtained from the distributions of the density of muons as a function of the distance to the core at the shower plane (see as an example, fig. C1). The muon densities, , were built event-by-event by dividing the EAS plane in concentric rings ( width each) and then by dividing, for each radial interval, the corresponding amount of detected muons by the sum of projected effective areas of the active detectors located in that particular bin.
Fluctuations were extracted from both, MC and experimental data for the different zenith-angle ranges and for several intervals, where was corrected for attenuation effects in the atmosphere using the CIC method. To separate the data, the charged number of particles was chosen instead of because in the former both the observed resolution and the agreement between the corresponding measured attenuation length and the MC predictions are better. MC fluctuations were obtained only for proton and iron nuclei as primaries, respectively. For experimental data, fluctuations might be overestimated since they might contain contributions from different primary elements. Once fluctuations were calculated, they were applied with a simulation program event-by-event to the MC data sets to estimate the number of particles detected per KASCADE muon station per simulated shower under each of the above fluctuation scenarios. For a given MC event with true muon content , the number of muons hitting each KASCADE muon station is estimated according to the geometry of the station and the muon lateral distribution function of equation (1). For this estimation the true values of the shower core position and arrival direction are needed. They are taken from the input parameters used in CORSIKA to simulate the shower. Once the number of muons per station is known, this quantity is allowed to fluctuate using the corresponding statistical distributions obtained from the experiment or simulated data. Then, the new set of values are stored and the mean deposited energy per muon station is estimated. Henceforth, the standard KASCADE-Grande reconstruction software is applied. The muon attenuation lengths are finally obtained from the reconstructed MC data sets using the standard procedure described in section 4.
Interestingly, the final results with MC simulations showed that the value obtained with experimental fluctuations stays above the corresponding result derived when using the MC ones, however the differences are small, just below for QGSJET-II-02. In consequence, the effect of the fluctuations on the number of muons per KASCADE muon station can not explain the observed discrepancy between measured and predicted data.
C.3 Uncertainties of air shower parameters
The influence of systematic errors coming from uncertainties in the reconstruction of the core position, arrival direction and the number of muons per detector from the deposited energy were also studied. For this purpose, new MC data sets were generated based on QGSJET-II-02 and by using the true shower location, arrival direction and number of muons hitting the KASCADE muon detectors in the reconstruction stage of the MC events. This way, the estimated for the resulting data sets has no influence from the systematic errors due to mislocation of the core, misalignment of the reconstructed shower axis or wrong estimation of per station. For the new data sets, the values are extracted and are compared with the corresponding attenuation lengths from the data where the uncertainties on the shower parameters are considered (for simplicity, in both cases, no muon correction function was applied). From the comparison, it is concluded that the effect of the abovementioned systematic errors on is to modify its magnitude, but by a negligible amount ().
These are conservative predictions associated with the effects of core and angular resolutions. One can ask what would happen if the actual magnitude of systematic errors of the core position and arrival direction were somewhat different. For this possibility there is not much room left, since the resolution of the Grande detector has been checked out with the KASCADE array, which works independently of the former as mentioned in section 2. By introducing these errors [13] in our MC simulations the muon attenuation length varies just within . Therefore, in light of the above results, it is unlikely that systematic errors due to shower core position and arrival direction could be the main cause for the deviation between experimental data and MC expectations.
C.4 Uncertainties of the muon LDF
The fact that there is an intriguing dependence of the muon attenuation length on the core position, which is not predicted by simulations, suggests the presence of another source of systematic error of (see B). One possibility could be found at the shape of the muon lateral distribution function. During reconstruction the slope of the LDF is kept constant due to the fact that the KASCADE muon detectors only sample a limited portion of the EAS. However, it is known that, although the measured LDF for muons is bracketed by simulation results, the observed slopes are different from MC predictions [58]. By comparing the slopes of the mean muon lateral distribution functions expected from MC simulations and the ones observed in experimental data, we found that, on average, the MC distributions are flatter than the measured ones. These differences clearly suggest the presence of a potential source of systematic error of , which may be also contributing to the observed anomaly. To estimate the possible contribution from this effect to the systematic error of , first, for each zenith-angle interval and the range discussed in section 5, we fitted the QGSJET-II-02 and the experimental mean muon density distributions with formula (1) but using and as free parameters. This was done in order to get an estimation of the flatness of the muon density distributions and to quantify the differences between the slopes of the experimental and the expected LDF’s. The fits were performed on the radial interval . For MC, we applied the fits on the data sets for pure elements and mixed composition. From the fitted values of , it was found that, in general, the actual mean muon radial density distributions are on average steeper than the MC simulated ones.
To evaluate the effect of using a flatter muon LDF to fit our data, we considered the MC data sets of QGSJET-II-02 for a mixed composition scenario and proceeded to reconstruct event-by-event with a flatter muon LDF. The latter was performed by decreasing the magnitude of by in the LDF formula employed for the standard EAS reconstruction, see eq. (1). This percentual decrement corresponds to the upper limit of the interval found for the difference between the values of the MC and measured muon LDF’s. For the above variation, we found that is shifted by . In addition, the dependence of on the distance to the KASCADE muon cluster became larger than the one observed in table B1 for QGSJET-II-02. In particular, decreases by for events with cores between to , and increases by at farther distances (). If now the magnitude of the parameter of formula (1) is increased by , in order to have a steeper muon LDF as suggested by the measured data, then we observe that the experimental is reduced only by (), while the core dependence of remains still high (). Therefore, we see that the systematic errors of are not enough to be the cause of the discrepancy.
To give a better estimation of the effect of the differences between the measured and the MC data and with the aim of confirming the conclusion of the previous analysis, we used an alternative approach: we weighted the distributions of the QGSJET-II-02 events for the mixed composition assumption to reproduce a steeper LDF in closer agreement with the one observed from the measurements. Then we applied the standard KASCADE-Grande reconstruction algorithm to the aforementioned MC events to obtain from which we calculated . Finally, the latter is compared with the standard result obtained from the unmodified data sets. The weight was applied by multiplying the number of events recorded in each station by the factor , where is the mean difference in obtained from the study described in the previous paragraph. Since , we used the lower limit of this interval for the estimation of the systematic uncertainty. The result was an increase of (), which is of the order of magnitude of the systematic error already calculated in the aforementioned paragraph.
One may argue that the individual differences between the LDF’s at different zenith-angles may be contributing in some way to the systematics too. In general, we have observed that both the MC and measured mean muon radial density distributions become flatter as the zenith-angle increases. However, the slope of the measured LDF’s decreases faster than that derived from MC simulations. To quantify the influence of these effects on the muon anomaly, first we modelled the above differences based on the observed as obtained for the interval . The differences were derived by comparing the experimental data with the results from the QGSJET-II-02 model for a mixed composition scenario and primary spectrum . Then we weighted the muon LDF’s from the QGSJET-II-02 data sets by using the factor , with , with in radians. Finally, we reconstructed event-by-event and obtained by the usual procedure. The result was a shift of on the simulated .
In summary, we conclude that it is improbable that the uncertainty on the slope of the LDF is the main cause of the deviation on the muon attenuation length.
C.5 Influence of the muon correction function
The prime suspect behind the anomaly is the muon correction function applied to the data. In general, the effect of this function on the estimated is to shift its magnitude by for MC simulations and for experimental data with respect to the value extracted from the uncorrected . It is observed that the amount of shift for the experimental value is bigger than that for MC estimations. However, it does not explain the discrepancy. In fact, a more detailed analysis based on the mean lateral muon densities (see section 5) revealed that the differences between the measured and expected muon attenuation lengths are not an artefact from the application of the muon correction function on the data. In particular, it was observed that they can be tracked down to differences between the experimental and predicted evolutions of the local mean muon densities in the shower front with the angle . This asseveration can be probed by modifying in an artificial way the zenith-angle evolution of the muon lateral distribution functions obtained from MC simulations. We have employed the same simulated MC data sets used to study the impact of the uncertainties in the slope of the muon LDF’s on , and we have multiplied the corresponding muon densities by the factor . Here, is the average value of the muon absorption length for the experimental data in the radial interval and the shower size range (see fig. 6). On the other hand, is the corresponding value for the QGSJET-II-02 based simulations (mixed composition data in fig. 6). After applying the full reconstruction procedure to the new simulated data, we found that , which is in pretty good agreement with the measured value.
C.6 Fluctuations on the local values of atmospheric temperature and pressure
The influence of local variations of the air pressure and temperature on our results were investigated. At the site, the mean pressure at ground during the DAQ period used for our analysis was , which is pretty close (within the experimental RMS variations) to the nominal value of () used for the MC simulations. To evaluate the influence of this small difference in the measured , data within a small interval around was chosen and the corresponding muon attenuation length was evaluated. In particular, we used . This range was selected in such a way that coincides with the median of the pressure distribution for the corresponding interval. The result for is shown in table C2. This value is just (for statistical errors only) below that corresponding to the full experimental data set. Therefore, the difference between the values in the interval selected and can not be the main cause of the discrepancy.
To go further, we investigated the effect of the tails of the distribution. For this purpose, we considered two additional data sets: one with and another one with , and we calculated for each case. The extracted values are presented in table C2. They are within and (using only statistical uncertainties for the comparison), respectively, from the main result obtained for the whole KASCADE-Grande data set. The magnitude of these deviations can not explain the observed anomaly of the muon attenuation length. If the smallest value of obtained from the present analysis with different intervals is compared with the MC predictions of table 1, deviations from to arise (employing only statistical errors).
On the other hand, it is also worth mentioning that a possible hint for a dependence of the discrepancy with the mean atmospheric pressure seems to be observed in the data (see table C2). In particular, the results seem to suggest that the disagreement between the measured and predicted parameters grows when decreasing the mean value of . The effect seems to be the result of an apparent reduction in the estimated number of muons at lower pressures, which is more important for vertical showers. For example, when comparing the muon attenuation curves derived for the data sets with and , respectively, at the same CIC cut: , it is observed that for showers closer to the zenith (first angular bin), the magnitude of derived from the CIC method for the interval with highest is bigger than that obtained for the interval of lowest atmospheric pressure, while for inclined showers (last zenith-angle bin) the difference is negligible and it amounts to . The interpretation of the results given here is still tentative as the statistical errors for the subsamples of table C2 are not small.
| Interval | Mean | Effective time (s) | () |
|---|---|---|---|
| (, ) | |||
| (, ) | |||
| (, ) | |||
| (, ) | |||
| (, ) | |||
| (, ) |
Regarding the influence of the local variations of temperature on , we have found that it is not significant. The temperature at the site was continuously monitored from the top of a tower at above the ground. From the records of the temperature during the DAQ period of the analysed data, we found that the mean value of the temperature was with a standard deviation of . To study the effect of the local temperature variations on the muon attenuation length, we divided our data in three subsets according to the following temperature intervals: , and , each of them with approximately the same statistics. Then we applied our standard analysis to find in each case (table C2). The results show variations from to from the measured value reported in table 1 for the whole experimental data set (comparisons were performed using only statistical uncertainties). Therefore, it is unlikely that the variations in the local temperature could be the cause of the observed anomaly.
Appendix D The attenuation length for
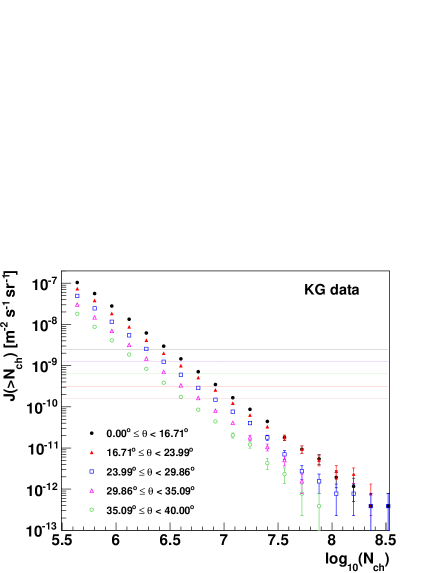
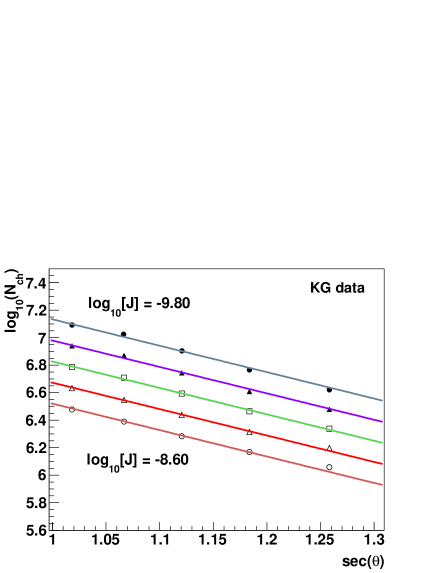
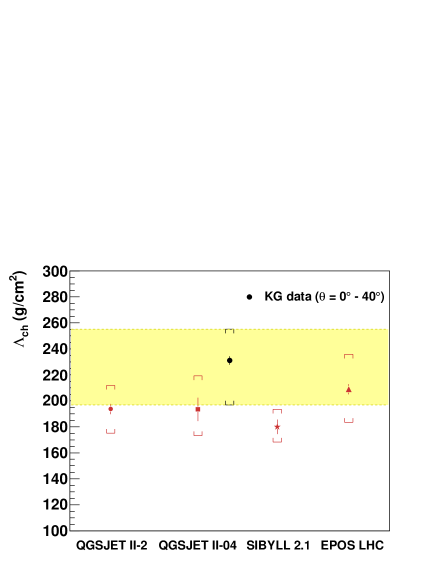
In order to complement the present study, a last check was performed, but on , which includes the number of muons and electrons of the shower. In this check, the attenuation length, , was estimated from the KASCADE-Grande measurements of air showers and the result was compared with the predictions from the hadronic interaction models of section 3. The extraction procedure of was identical to the one employed with , with the only exception that no correction function was applied. The latter was not necessary for the analysis, since in KASCADE-Grande the charged particle content of EAS is determined with a better precision than the muon number131313In turn, the number of electrons can be estimated even with a better precision than in KASCADE-Grande. For example, for our data set, after applying quality cuts, MC predictions indicate that for shower sizes , the systematics on are , while for are . [13].
| QGSJET-II-02 | QGSJET-II-04 | SIBYLL 2.1 | EPOS-LHC | KG data | |
|---|---|---|---|---|---|
| Deviation () | |||||
| CL (%) |
The measured integral spectra upon which the analysis is performed are presented on the left side of fig. D1 along with the applied CIC cuts. On the right side of the same figure, the attenuation curves extracted with the CIC method are also shown. As before, the is obtained from a global fit with a relationship like (3) to the measured attenuation curves. The resulting value is plotted on fig. D2 together with the predictions from QGSJET-II-02, SIBYLL 2.1, QGSJET-II-04 and EPOS-LHC. The magnitudes of the measured and predicted values of are displayed in table D1.
| QGSJET-II-02 | QGSJET-II-04 | SIBYLL 2.1 | EPOS-LHC | KG data | |
|---|---|---|---|---|---|
| Statistical error () | |||||
| Statistical fluctuations | |||||
| Systematics () | |||||
| Nch systematics | |||||
| Global fit | |||||
| Core far from KASCADE | |||||
| () | |||||
| Core close to KASCADE | |||||
| () | |||||
| Bin size | |||||
| Narrower CIC interval | |||||
| () | |||||
| Broader zenith-angle interval | |||||
| (Four angular bins) | |||||
| Number CIC cuts | |||||
| Spectral index uncertainties | |||||
| () | |||||
| Composition | |||||
| Total (%) | |||||
To investigate the agreement between the measurement and the predictions from MC simulations, a simple statistical analysis was applied. Deviations of the experimental from estimations of the models were computed and confidence levels for agreement with the predictions of the hadronic interaction models were derived. The results are presented in table D1. Herein a good consistency between experimental data and the predictions of the high-energy hadronic interaction models can be seen, since the statistical analysis gives deviations between and , with a CL from to , respectively, which are as a matter of fact quite satisfactory.
The total uncertainties of are presented in table D2 along with their corresponding statistical and systematic errors. All of them were calculated in the same way that for . The results were found to vary in the range from to . In experimental data, an important contribution to the total error of (between and ) is the systematic uncertainty of . The latter was estimated from MC simulations and confirmed with experimental investigations [13]. On the other hand, in contrast to the case, here no relevant dependence of the measured with the radial distance was found, for the corresponding variations of were within (see table D2). The reason is that, for the charged component of EAS the LDF is well measured event-by-event across the Grande detector area. Regarding MC simulations, a sizeable contribution in this case came from the uncertain knowledge of the primary composition of the experimental sample. This was estimated from the data sets for the pure and mixed composition scenarios (as in the case of ). It resulted that this source of uncertainty has a contribution from to to the total MC error depending of the hadronic interaction model.
References
- [1] S. Ostapchenko, Czech. J. Phys. 56 (2006) A149.
- [2] T. Pierog, R. Engel, D. Heck, Czech. J. Phys. 56 (2006) A161.
- [3] W.D. Apel et al., KASCADE-Grande Collaboration, Astrop. Phys. 24 (2005) 1.
- [4] L. Cazon, R.A. Vazquez, A.A. Watson, E. Zas, Astrop. Phys. 21 (2004) 71; L. Cazon, R.A. Vazquez, E. Zas, Astrop. Phys. 23 (2005) 393.
- [5] C. Meurer, J. Bluemer, R. Engel, A. Haungs, M. Roth, Czech. J. Phys. 56 (2006) A211.
- [6] A. Aab et al., (Pierre Auger Coll.) Phys. Rev. D 90 (2014) 012012, erratum: Phys. Rev. D 92 (2015) 019903(E).
- [7] A. Aab et al., (Pierre Auger Coll.) Phys. Rev. D 91 (2015) 032003, erratum: Phys. Rev. D 91 (2015) 059901.
- [8] S. Ostapchenko, Nucl. Phys. B (Proc. Suppl.) 151 (2006) 143; S. Ostapchenko, Phys. Rev. D 74 (2006) 014026.
- [9] E.J. Ahn et al., Phys. Rev D 80 (2009) 094003.
- [10] T. Pierog et al., Phys. Rev. C 92, (2015) 034906.
- [11] S. Ostapchenko, Phys. Rev. D 83 (2011) 014018.
- [12] J. Hersil et al., Phys. Rev. Lett. 6 (1961) 22; D. M. Edge et al., J. Phys. A 6 (1973) 1612.
- [13] W.D. Apel et al., KASCADE-Grande Collaboration, NIM A 620 (2010) 202.
- [14] K. Kamata, J. Nishimura, Prog. Theor. Phys. Suppl. 6 (1958) 93; K. Greisen in: J. G. Wilson (Ed.), Progress in Cosmic Ray Physics, Vol. III, J. G. Wilson (Ed.), North-Holland Publishing Co., 1956.
- [15] A.A. Lagutin and R.I. Raikin, Nucl. Phys. B (Proc. Suppl.) 97 (2001) 274.
- [16] D. Heck et al., Report FZKA 6019, Forschungszentrum Karlsruhe, Germany (1998).
- [17] Daniel Fuhrmann, KASCADE-Grande measurements of energy spectra for elemental groups of cosmic rays, Ph.D. thesis, University of Wuppertal, Germany (2012).
- [18] A. Fassò et al., Report CERN-2005-10, INFN/TC-05/11, SLAC-R-773 (2005).
- [19] R. Brun, F. Carminati, GEANT-detector description and simulation tool, CERN Program Library Long Writeup, 1993.
- [20] W.D. Apel et al., KASCADE-Grande Collaboration, Phys. Rev. D 87 (2013) 081101(R).
- [21] W.D. Apel et al., KASCADE-Grande Collaboration, Astrop. Phys. 36 (2012) 183.
- [22] S. Ostapchenko, EPJ Web of Conferences 52 (2013) 02001.
- [23] T. Pierog and D. Heck, in: Proc. 33rd ICRC, Rio de Janeiro, Brazil (2013) #icrc163; T. Pierog, J. Phys.: Conf. Ser. 409 (2013) 012008.
- [24] P. K. F. Grieder, Extensive air showers: High energy phenomena and astrophysical aspects, a tutorial, reference manual and data book, Vol. I, Springer, 2011 edition.
- [25] W.D. Apel et al., KASCADE-Grande Collaboration, Phys. Rev. D 80 (2009) 022002.
- [26] M. Honda et al., Phys. Rev. Lett. 70 (1993) 525.
- [27] C.J. Bell et al., J. Phys. A: Math., Nucl. Gen. 7 (1974) 990.
- [28] M. Ave et al., Proc. 27th ICRC, Hamburg, Germany (2001) 381.
- [29] F. Riehn, R. Engel, A. Fedynitch, T. K.Gaisser and T. Stanev, in: Proceedings of Science, PoS (ICRC2015) 558, Proc. 34rd ICRC, The Hague, Netherlands.
- [30] L. Cazon et al., Astropart. Phys. 36 (2012) 211.
- [31] W.D. Apel et al., KASCADE-Grande Collaboration, Phys. Rev. D 80 (2012) 022002; J.R. Hörandel, J. Phys. G: Nucl. Part. Phys. 29 (2003) 2439.
- [32] W.D. Apel et al., KASCADE-Grande Collaboration, Astrop. Phys. 34 (2011) 476.
- [33] P. Luczak et al. KASCADE-Grande Collaboration, in: Proceedings of Science, PoS (ICRC2015) 386, Proc. 34rd ICRC, The Hague, Netherlands.
- [34] T. Antoni et al., KASCADE Collaboration, NIM A 513 (2003) 490.
- [35] J. Zabierowski et al. KASCADE-Grande Collaboration, in: Proc. 29th ICRC, Vol. 6 (2005) 357, Pune, India.
- [36] H.J. Drescher and G.R. Farrar, Astrop. Phys. 19 (2003) 235.
- [37] R. Engel, Rapporteur talk: Particle and interaction physics, in: Proc. 27th ICRC, Hamburg, Germany (2001), p. 181.
- [38] A. Haungs et al. (KASCADE Coll.), The primary energy spectrum of cosmic rays obtained by muon density measurements at KASCADE, in: Proc. 27th ICRC, Hamburg, Germany (2001), p. 63.
- [39] A.V. Glushkov, et al., Yakutsk EAS array Coll., JETP Lett. 87 (2008) 190.
- [40] A. Yushkov, et al., Pierre Auger Coll., Eur. Phys. J. Web. Conf. 53 (2013) 07002; L. Nellen et al., Pierre Auger Coll., J. Phys.: Conf. Ser. 409 (2013) 012107.
- [41] T. Abu-Zayyad et al., Phys. Rev. Lett. 84 (2000) 4276.
- [42] Y.A. Fomin, et al., Astrop. Phys. 92 (2017) 1.
- [43] J. G. Gonzalez et al., IceCube Coll., J. Phys.: Conf. Ser. 718 (2016) 052017.
- [44] W.D. Apel et al., KASCADE-Grande Collaboration, J. Phys. G: Nucl. Part. Phys. 36 (2009) 035201.
- [45] W.R. Nelson, H. Hirayama and D.W.O. Rogers, Report SLAC (1985) 265.
- [46] G. Antchev et al., TOTEM Coll., Europhys. Lett. 96 (2011) 21002; 101 (2013) 21002; 101 (2013) 21003; 101 (2013) 21004; Phys. Rev. Lett. 111 (2013) 012001.
- [47] G. Aad, et al., ATLAS Coll., Nucl. Phys. B 889 (2014) 486. M. Aaboud et al., ATLAS Coll., Phys. Lett. B 761 (2016) 158.
- [48] T. Antoni et al., Astrop. Phys. 19 (2003) 703.
- [49] T. Pierog, et al., in: Proceedings of Science, PoS (ICRC2015) 337, Proc. 34rd ICRC, The Hague, Netherlands.
- [50] S. Ostapchenko, Phys. Rev. D 93 (2016) 051501(R).
- [51] T. Pierog et al., Report FZKA 7516, Forschungszentrum Karlsruhe, Germany (2009) 133.
- [52] J. Allen et al., EPJ Web of Conferences 53 (2013) 01007.
- [53] R. Ulrich et al., Phys. Rev. D 83 (2011) 054026.
- [54] A. E. Hervé for the NA61/SHINE Collaboration, in: Proceedings of Science, PoS (ICRC2015) 330, Proc. 34rd ICRC, The Hague, Netherlands.
- [55] G. Zech, Comparing Statistical Data to Monte Carlo Simulation - Parameter Fitting and Unfolding, DESY 95-113 (1995); G. Bohm, G. Zech, NIMA 691 (2012) 171.
- [56] W.D. Apel et al. KASCADE-Grande Collaboration, Phys. Rev. Lett. 107 (2011) 171104.
- [57] W.D. Apel et al. KASCADE-Grande Collaboration, Astrop. Phys. 47 (2013) 54.
- [58] V. de Souza et al., KASCADE-Grande Collaboration, in: Proc. 32nd ICRC, Vol. 1580 1/11 (2011) 295, Beijing, China.