Evidence of an improper displacive phase transition in Cd2Re2O7 via time-resolved coherent phonon spectroscopy
Abstract
We have used a combination of ultrafast coherent phonon spectroscopy, ultrafast thermometry, and time-dependent Landau theory to study the inversion symmetry breaking phase transition at K in the strongly spin-orbit coupled correlated metal Cd2Re2O7. We establish that the structural distortion at is a secondary effect through the absence of any softening of its associated phonon mode, which supports a purely electronically driven mechanism. However, the phonon lifetime exhibits an anomalously strong temperature dependence that decreases linearly to zero near . We show that this behavior naturally explains the spurious appearance of phonon softening in previous Raman spectroscopy experiments and should be a prevalent feature of correlated electron systems with linearly coupled order parameters.
The strongly spin-orbit coupled metallic pyrochlore Cd2Re2O7 undergoes an unusual cubic-to-tetragonal phase transition below a critical temperature K that breaks structural inversion symmetry yamaura2002 . Unlike many other pyrochlore 5 transition metal oxides such as Cd2Os2O7 mandrus2001 or members of the Ir2O7 ( = rare earth) family matsuhira , which undergo paramagnetic metal-to-antiferromagnetic insulator transitions below a similar temperature scale, the phase transition in Cd2Re2O7 is from metal-to-metal hanawa ; sakai2001 ; jin2002 and does not appear to be accompanied by any long-range magnetic order vyaselev ; arai ; sakai2002 . Extensive efforts to determine the underlying mechanism of the phase transition in Cd2Re2O7 using x-ray diffraction jin2002 ; castellan2002 ; yamaura2002 ; huang2009 , local magnetic probes vyaselev ; arai ; sakai2002 , optical spectroscopy kendziora2005 ; petersen2006 ; harter2017 and various theoretical approaches sergienko2003 ; sergienko2004 ; fu2015 ; dimatteo2017 have produced conflicting pictures.
For many years, the leading hypothesis was that the transition is driven by the freezing of a soft zone-centered phonon mode with symmetry sergienko2003 . This mechanism is described by a Landau free energy , where is the structural order parameter, and requires the natural frequency of the phonon to monotonically approach zero near , as illustrated in Fig. 1(a). Such a scenario is supported by Raman spectroscopy experiments kendziora2005 , which detect the apparent softening of an phonon near , as well as by density functional theory calculations that find an unstable oxygen phonon at zero temperature sergienko2004 .
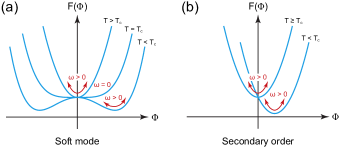
A competing hypothesis is that the phase transition is driven by an electronic order. Specific theoretical proposals include an odd-parity electronic nematic order fu2015 ; wu2004 ; wu2007 , which arises from a Pomeranchuk instability in the -wave spin interaction channel fu2015 , as well as a combination of odd-parity quadrupolar and even-parity octupolar magnetic orders dimatteo2017 . Recent optical second harmonic generation (SHG) measurements have indeed uncovered an odd-parity electronic order parameter with symmetry that exhibits a scaling behavior harter2017 , which is consistent with the behavior of a primary order parameter. Based on a symmetry analysis of the Landau free energy, it was deduced that an additional even-parity electronic order parameter with symmetry must exist, which together with induces the structural distortion as a so-called “improper” secondary order parameter harter2017 . This mechanism is described by and does not require the phonon to soften near , as illustrated in Fig. 1(b). The hypothesis of an electronically driven phase transition in Cd2Re2O7 is further supported by x-ray diffraction experiments castellan2002 , which show an anomalous temperature dependence of superlattice Bragg peaks below , as well as by the extreme weakness of the structural distortion yamaura2002 ; huang2009 contrasted with the pronounced changes in resistivity and magnetic susceptibility jin2002 across .
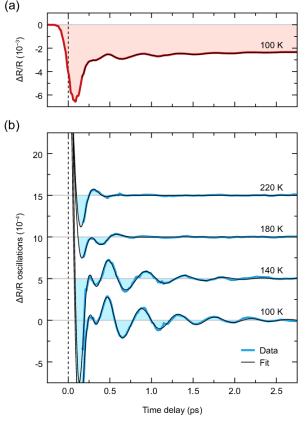
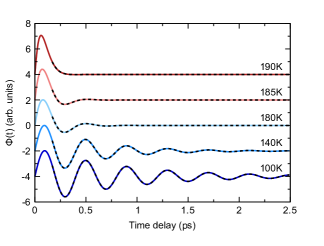
To determine which of the two proposed hypotheses is correct and to understand the reasons for conflicting pictures, we carried out time-resolved optical reflectivity measurements on a Cd2Re2O7 single crystal to coherently drive the phonon and directly probe its temperature dependence in the time domain. Figure 2(a) shows a characteristic differential reflectivity transient for , with being the delay time between pump and probe pulses. The reflectivity sharply decreases after pump excitation, after which it recovers towards a quasi-steady state less than the initial value. The recovery features oscillations due to the coherent excitation of two Raman-active phonon modes superposed atop a smoothly decaying background. To extract the properties of the modes, we fit the recovery to the function
| (1) |
where the two exponential decay terms describe a fast and slow relaxation process and the two damped harmonic oscillator terms describe the phonon modes. We take to be the generic response of an underdamped harmonic oscillator [] with initial conditions and , given by
| (2) |
| (3) |
Here, is the natural frequency of the oscillator, is its inverse damping parameter, and is the actual frequency of damped oscillations. We emphasize the important fact that observing the oscillation frequency approach zero () does not necessarily imply that the mode is softening (). Instead, as we will show, this kind of behavior can also be explained by a diverging damping rate (). Indeed, based on the temperature dependence of the raw data alone [Fig. 2(b)], it is clear that the phonon lifetime rapidly diminishes upon approaching .
The values of and for the two phonon modes extracted from the fits at different temperatures are displayed in Fig. 3. These best-fit values are uniquely determined because of the exponential decay factor in the oscillator response . A number of salient features may be drawn from the results. First, both mode frequencies have a weak temperature dependence and, as illustrated by the gray curve in Fig. 3(a), do not show any signatures of soft mode behavior (where one would expect at ). Instead, the observed temperature dependence is fully consistent with a small negative linear slope expected for “normal” phonons scott1974 . Second, mode 1 only exists below the phase transition whereas mode 2 survives above . Indeed, the frequency and lifetime of mode 1 extracted from our data very closely match a previous Raman study kendziora2005 in which the mode symmetry was identified as deriving from an distortion that only becomes Raman-active (and therefore experimentally observable) below . In contrast, mode 2 is likely a fully symmetric breathing mode because it survives above . The absence of mode 2 in the Raman data is possibly the result of its short lifetime and correspondingly broad bandwidth. Third, as shown in Fig. 3(b), the lifetime of mode 1 has a very strong temperature dependence, plunging to nearly zero as the temperature is increased to . The lifetime of mode 2, on the other hand, is relatively short and independent of temperature. These facts strongly disfavor the soft-phonon scenario and suggest that the structural distortion is a secondary order parameter that does not drive the phase transition.
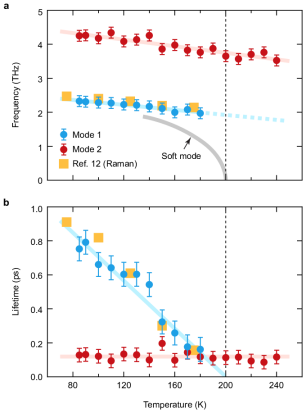
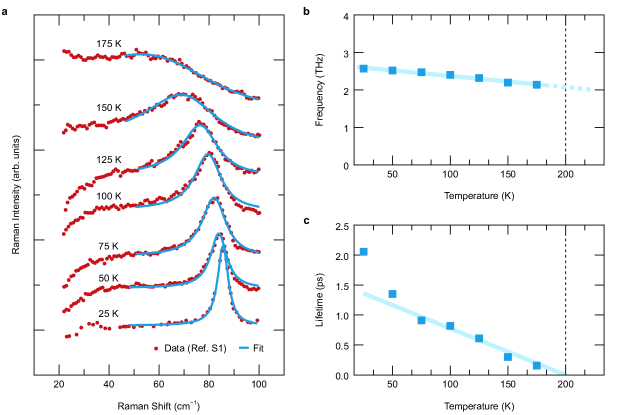
Raman spectroscopy data kendziora2005 were originally interpreted as evidence of a softening of the phonon and therefore of a structurally-driven phase transition; with our data we see that this interpretation is incorrect. Instead, the reported decrease in the Raman peak frequency near is due to a decrease in the lifetime of the phonon rather than a softening of its natural frequency. This new interpretation is fully consistent with the Raman data if we re-analyze the data using a driven damped harmonic oscillator model EPAPS , where the frequency of the resulting Raman peak does not necessarily correspond to the oscillator natural frequency—a phenomenon well-established in the literature didomenico1968 ; burns1970 . As shown in Fig. 3, the values of and extracted from this revised analysis of the Raman data fully agree with our time-domain analysis, offering an independent consistency check of our results.
Although nontrivial temperature dependencies of mode lifetimes near phase transitions are well established for primary order parameters silverman1972 ; demsar1999 ; taniguchi2007 ; torchinsky2014 ; chu2017 , it is unusual to observe such behavior for a secondary order parameter. To examine why the lifetime of the phonon mode has such a strong temperature dependence near despite it not going soft, we analyzed the interaction between the primary and secondary modes in Cd2Re2O7 by performing a time-dependent Landau theory analysis of its full free energy proposed by Ref. 14:
| (4) | ||||
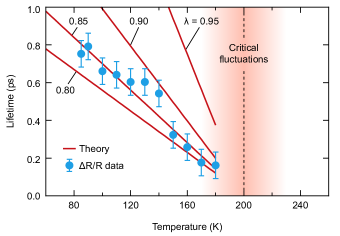
By expanding about the equilibrium values of the structural () and electronic () order parameters and considering the linearized dynamical response to deviations from the equilibrium values, which is valid at temperatures sufficiently below where critical fluctuations are irrelevant, our calculations show that there exists a linear coupling between the primary and secondary modes EPAPS . This coupling allows the mode to be damped by the critical slowing down of the modes. Assuming overdamped dynamics for the modes and oscillatory dynamics for the mode, our theory produces a mode lifetime in agreement with our measurements. Figure 4 shows the calculated temperature dependence of for various values of the coupling strength using the experimentally determined phonon natural frequency (2.5 THz). We see that the linear temperature scaling relation is a robust feature of our theory and, for suitably chosen values of the model parameters, can quantitatively reproduce the experimental data.
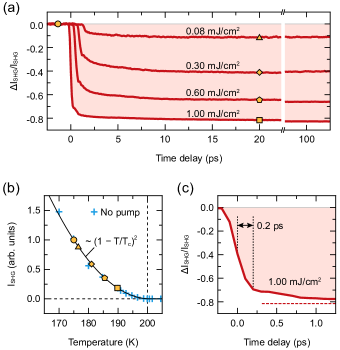
It is surprising that the data are so well captured by time-dependent Landau theory because an ultrafast optical pulse typically excites the system far away from equilibrium on short timescales, during which the electronic and lattice temperatures can be very different. To measure how quickly the electron and lattice subsystems thermally equilibrate in Cd2Re2O7, we performed time-resolved SHG measurements. The second-order electric-dipole susceptibility has been shown to couple linearly to the structural order parameter below petersen2006 ; harter2017 , therefore the SHG intensity can be used as a sensitive measure of the lattice temperature. Figure 5(a) shows time-resolved SHG transients acquired at = 175 K. For all pump fluences tested, we observe the SHG intensity drop to a lower value quickly upon pump excitation, indicating a rapid heating of the lattice, and then stay nearly constant at this value for over 100 ps. Since this far exceeds typical electron-lattice equilibration timescales, the equilibration must be complete once the intensity flattens. The long ( 100 ps) recovery time is likely due to slow heat diffusion away from the excited region, which is consistent with the reported low “amorphous-like” thermal conductivity of Cd2Re2O7 he2010 . To further verify that the system is equilibrated upon the flattening of intensity, we compared the actual temperature rise in this regime to the expected pump-induced temperature rise for an electron-lattice equilibrated system. The actual temperature rise can be obtained from the SHG intensity versus temperature curve measured from an un-pumped sample [Fig. 5(b)], which exhibits a scaling relation. For the data set in Fig. 5(a) acquired using a fluence of 1.00 mJ/cm2 for example, the curve yields a temperature rise of K at = 20 ps. The expected temperature rise can be calculated using the equation , where is the reflectivity, is the fluence, is the volumetric heat capacity, and is the optical penetration depth. Inputting = 1.00 mJ/cm2, J/cmK at = 175 K jin2002 ; he2010 ; tachibana2010 , and nm at a pump wavelength of 1400 nm wang2002 , we find K, in good agreement with the actual measured temperature rise. This shows that the entirety of the pump pulse energy is accounted for by the increase in lattice temperature, which rules out the existence of a hotter electron subsystem since that would imply an incomplete transfer of energy to the lattice. Given that the equilibrated lattice temperature is nearly reached within a resolution limited timescale ( 0.2 ps) as shown in Fig. 5(c), the system can be well approximated as being in equilibrium over the time window that the coherent phonons are observed [Fig. 2(b)], which explains the efficacy of our time-dependent Landau theory. The rapid transfer of energy from the electronic to lattice subsystem is consistent with previous reports of strong electron-phonon coupling in Cd2Re2O7 vyaselev ; bae2006 and further supports our theory that the reciprocal process - a dissipation of the phonon energy into the electronic bath - is responsible for the observed phonon damping.
Although our analyses have focused on the electronically driven phase transition in Cd2Re2O7, these results are generic to any system possessing a linear coupling between primary and secondary orders with different symmetries and may be an effective strategy to differentiate primary from secondary order parameters in a wide class of materials. For example, improper ferroelectrics bousquet2008 ; oh2015 are driven by coupled primary structural order parameters, and the ferroelectric mode of secondary nature in such systems should behave in much the same way as the phonon mode in Cd2Re2O7 observed here.
Acknowledgements.
This work was supported by the U. S. Department of Energy under Grant No. SC-0010533. D.H. also acknowledges funding from the David and Lucile Packard Foundation and support for instrumentation from the Institute for Quantum Information and Matter, an NSF Physics Frontiers Center (PHY-1125565) with support of the Gordon and Betty Moore Foundation through grant GBMF1250. J.-Q.Y. and D.G.M. were supported by the U.S. Department of Energy, Office of Science, Basic Energy Sciences, Materials Sciences and Engineering Division. Z.Y.Z. acknowledges the Center for Emergent Materials, an NSF Materials Research Science and Engineering Center under grant DMR-1420451. The work of D.M.K. and A.J.M. on this project was supported by the Basic Energy Sciences Program of the U. S. Department of Energy under Grant No. SC-0012375 and D.M.K. also acknowledges DFG KE 2115/1-1.References
- (1) J.-I. Yamaura & Z. Hiroi, J. Phys. Soc. Jpn. 71, 2598-2600 (2002).
- (2) D. Mandrus, J. R. Thompson, R. Gaal, L. Forro, J. C. Bryan, B. C. Chakoumakos, L. M. Woods, B. C. Sales, R. S. Fishman & V. Keppens, Phys. Rev. B 63, 195104 (2001).
- (3) K. Matsuhira et al., J. Phys. Soc. Jpn. 76, 043706 (2007).
- (4) M. Hanawa, Y. Muraoka, T. Tayama, T. Sakakibara, J. Yamaura & Z. Hiroi, Phys. Rev. Lett. 87, 187001 (2001).
- (5) H. Sakai et al., J. Phys.: Condens. Matter 13, L785-L790 (2001).
- (6) R. Jin et al., J. Phys.: Condens. Matter 14, L117-L123 (2002).
- (7) O. Vyaselev, K. Arai, K. Kobayashi, J. Yamazaki, K. Kodama, M. Takigawa, M. Hanawa & Z. Hiroi, Phys. Rev. Lett. 89, 017001 (2002).
- (8) K. Arai, K. Kobayashi, K. Kodama, O. Vyaselev, M. Takigawa1, M. Hanawa & Z. Hiroi, J. Phys.: Condens. Matter 14, L461-L466 (2002).
- (9) H. Sakai, H. Kato, S. Kambe, R. E. Walstedt, H. Ohno, M. Kato, K. Yoshimura & H. Matsuhata, Phys. Rev. B 66, 100509(R) (2002).
- (10) J. P. Castellan, B. D. Gaulin, J. van Duijn, M. J. Lewis, M. D. Lumsden, R. Jin, J. He, S. E. Nagler & D. Mandrus, Phys. Rev. B 66, 134528 (2002).
- (11) S.-W. Huang et al., J. Phys.: Condens. Matter 21, 195602 (2009).
- (12) C. A. Kendziora, I. A. Sergienko, R. Jin, J. He, V. Keppens, B. C. Sales & D. Mandrus, Phys. Rev. Lett. 95, 125503 (2005).
- (13) J. C. Petersen et al., Nat. Phys. 2, 605-608 (2006).
- (14) J. W. Harter, Z. Y. Zhao, J.-Q. Yan, D. G. Mandrus & D. Hsieh, Science 356, 295-299 (2017).
- (15) I. A. Sergienko & S. H. Curnoe, J. Phys. Soc. Jpn. 72, 1607-1610 (2003).
- (16) I. A. Sergienko, V. Keppens, M. McGuire, R. Jin, J. He, S. H. Curnoe, B. C. Sales, P. Blaha, D. J. Singh, K. Schwarz & D. Mandrus Phys. Rev. Lett. 92, 065501 (2004).
- (17) L. Fu, Phys. Rev. Lett. 115, 026401 (2015).
- (18) S. Di Matteo & M. R. Norman, Phys. Rev. B 96, 115156 (2017).
- (19) C. Wu & S.-C. Zhang, Phys. Rev. Lett. 93, 036403 (2004).
- (20) C. Wu, K. Sun, E. Fradkin & S.-C. Zhang, Phys. Rev. B 75, 115103 (2007).
- (21) J. F. Scott, Rev. Mod. Phys. 46, 83-128 (1974).
- (22) See Supplemental Material, which includes Refs. [36-37].
- (23) M. DiDomenico, Jr., S. H. Wemple, S. P. S. Porto & R. P. Bauman, Phys. Rev. 174, 522-530 (1968).
- (24) G. Burns & B. A. Scott, Phys. Rev. Lett. 25, 167-170 (1970).
- (25) B. D. Silverman, Solid State Commun. 10, 311-314 (1972).
- (26) J. Demsar, K. Biljakovic & D. Mihailovic, Phys. Rev. Lett. 83, 800-803 (1999).
- (27) H. Taniguchi, Y. J. Shan, H. Mori & M. Itoh, Phys. Rev. B 76, 212103 (2007).
- (28) D. H. Torchinsky, F. Mahmood, A. T. Bollinger, I. Bozovic & N. Gedik, Nat. Mater. 12, 387-391 (2013).
- (29) H. Chu et al., Nat. Mater. 16, 200-203 (2017).
- (30) J. He, D. Hitchcock, I. Bredeson, N. Hickman, Terry M. Tritt & S. N. Zhang, Phys. Rev. B 81, 134302 (2010).
- (31) M. Tachibana, N. Taira, H. Kawaji & E. Takayama-Muromachi, Phys. Rev. B 82, 054108 (2010).
- (32) N. L. Wang, J. J. McGuire, T. Timusk, R. Jin, J. He & D. Mandrus, Phys. Rev. B 66, 014534 (2002).
- (33) J. S. Bae et al., J. Korean Phys. Soc. 48, 946-950 (2006).
- (34) E. Bousquet et al., Nature 452, 732-736 (2008).
- (35) Y. S. Oh et al., Nat. Mater. 14, 407-413 (2015).
- (36) J. He et al., J. Electron. Mater. 36, 740-745 (2007).
- (37) J. W. Harter, L. Niu, A. J. Woss & D. Hsieh, Opt. Lett. 40, 4671-4674 (2015).
S1 Methods summary
Sample growth and characterization. Single crystals of Cd2Re2O7 were grown by vapor transport he2007 . X-ray diffraction measurements were performed on pulverized single crystals using a PANalytical X’Pert Pro powder x-ray diffractometer with Cu radiation. No impurity peaks were observed. An elemental analysis was performed using a Hitachi TM-3000 scanning electron microscope equipped with a Bruker QUANTAX 70 energy dispersive x-ray system. The analysis confirmed an equal amount of Cd and Re within the resolution of the instrument. Magnetic susceptibility measurements were performed using a Quantum Design Magnetic Property Measurement System at temperatures from 2 to 350 K. The results indicated high quality crystals without the presence of ReO2 inclusions.
Time-resolved reflectivity measurements. Pump-probe linear reflectivity experiments were performed using a regeneratively amplified Ti:sapphire laser system operating at a 10 kHz repetition rate with a center wavelength of 795 nm and a pulse duration of 80 fs. Pump and probe beams were cross polarized and focused onto the (111) surface of a Cd2Re2O7 single crystal at near-normal incidence. The relative change in reflectivity of the probe beam was measured with a lock-in amplifier referenced to the pump beam mechanically chopped at 5 kHz. For pump fluences between 0.5 mJ/cm2 and 3 mJ/cm2, the reflectivity transients were found to scale linearly with fluence. Data shown in Fig. 2 of the main text were acquired with a pump fluence of 1.4 mJ/cm2, well within the linear response regime, and a probe fluence of less than 100 J/cm2.
Time-resolved SHG measurements. Pump-probe SHG experiments were performed using a regeneratively amplified Ti:sapphire laser system operating at a 100 kHz repetition rate with a center wavelength of 800 nm and a pulse duration of 100 fs. An optical parametric amplifier was used to convert the pump beam wavelength to 1400 nm. The obliquely incident 800 nm probe beam was -polarized [parallel to the (111) surface] with a fluence of 600 J/cm2 and the -polarized response of the reflected SHG at 400 nm was measured with an electron-multiplying charge-coupled device camera. The scattering plane was oriented at the angle of maximum SHG intensity. Further details of the nonlinear optical setup can be found in Ref. 37.
Time-dependent Landau theory. Here we sketch a calculation of the damping of a secondary phonon mode due to its coupling to primary critical modes. Further details can be found in Section S4. We make the assumption that a linearized theory applies (we are sufficiently far from that true critical fluctuations are irrelevant), and that the primary modes have simple overdamped dynamics. The key point is that in the ordered phase, there is a linear coupling between fluctuations of the primary and secondary order parameters which leads to a damping of the secondary mode by the critical slowing down of the primary mode. In addition, because we have a linear coupling between the two modes, momentum is conserved and we need only consider the excitations. A nonlinear coupling of the mode fluctuations would induce additional effects.
We start from Eqn. (4) of the main text and simplify the notation by rescaling so that , rescaling so that , and defining and . Dropping the constant term, defining , and rearranging, we obtain
| (S1) |
with . Here, is required for stability. This equation is minimized when and , with
| (S2) |
[Note: our assumption that and appear symmetrically in the free energy makes the analytical calculations much simpler. But the main results will not change even if this symmetry is not assumed].
We now expand the free energy around these equilibrium values, finding
| (S3) |
with and force constant matrix given by
| (S4) |
We see that decouples. Assuming oscillating dynamics for the mode (our units imply the dynamical term is , with the bare oscillation frequency of the mode) and overdamped dynamics for the modes (bare relaxation rate ), we find that the dynamical matrix giving the response of the coupled modes is
| (S5) |
The overdamped dynamics of the mode is nontrivial. If the mode is a long wavelength electronic fluctuation, the damping of the component would vanish in a clean system. We expect that the real damping will be sample-dependent and involve the sample mean free path as well as spin-orbit coupling.
The experimental response is proportional to the Fourier transform of the - component of the dynamical matrix. The result can be written in terms of the frequency as
| (S6) |
with mode self-energy
| (S7) |
where the effective relaxation rate
| (S8) |
diverges as . We are interested in the case where . For (), the mode self energy is small and is the observed mode frequency. As increases towards , the mode broadening (inverse lifetime) becomes appreciable and proportional to (see Fig. 4 of the main text). For the lifetime of the mode, we thus obtain , in accordance with the experiment. As is further decreased, the real part of starts to become important and the mode frequency shifts up. The experimental data, which indicate a weak effect on the frequency but a large effect on the damping, thus favor a scenario where is relatively large and .
S2 Reflectivity transients close to
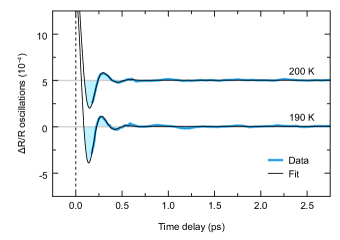
Time-resolved reflectivity transients were also acquired from Cd2Re2O7 in the temperature window 180 K K. However in this temperature window the lifetime of mode 1 becomes so short that it is impossible to reliably extract the mode parameters by fitting the data. As shown in Fig. S1, the data at = 190 K and = 200 K look nearly indistinguishable from the data above (see Fig. 2 of main text) and do not exhibit a clear presence of mode 1. Therefore no fit parameters for mode 1 are plotted above = 180 K in Fig. 3 of the main text. Note that the lifetime we report is the 1/ value. Therefore even though is less than one period of mode 1 just below 180 K, mode 1 is still detectable for some time beyond and so, in practice, we fit to more than one period.
S3 Analysis of Raman data
In this section, we re-analyze the Raman spectroscopy data of Ref. 12. In particular, we fit the data shown in their Fig. 2(b) using a model of an underdamped harmonic oscillator identical to that discussed in the main text. Such an analysis is well-established in the Raman literature didomenico1968 ; burns1970 . Fig. S2a shows the Raman data for a selection of temperatures, as well as fits to the equation
| (S9) |
where and are extrinsic constants capturing background and signal intensity, respectively, is the oscillator lifetime (inverse damping constant), and is the natural frequency of the oscillator. This equation represents the response of a damped harmonic oscillator [] to a periodic drive at frequency and has been used to describe Raman spectroscopy of underdamped phonon modes didomenico1968 ; burns1970 . Most notably, the resulting peak position of the equation is , which can deviate significantly from , especially when is small. Reinterpreting the Raman data using this analysis, we see that the data is consistent with a weak temperature dependence of the oscillator natural frequency (Fig. S2b) and a strong temperature dependence of the oscillator lifetime (Fig. S2c), which grows from near zero at , as discussed in the main text.
S4 Time-dependent Landau theory details
Numerical solutions. Here we take the full analytical expression of given by Eqns. (S6) and (S7) of Section S1 and solve numerically for different parameter values. Results are summarized in Fig. S3. The weak linear temperature dependence of the mode frequency observed by experiment is beyond the scope of our theory. We find instead a fairly constant mode frequency, with a slight upturn in the regime close to . Indications of this upturn are not apparent in the data, likely because the mode lifetime becomes so short near that it becomes difficult to extract meaningful phonon parameters from the experimental data in this regime. To construct Fig. S3, we use the fact that is a ratio of polynomials and is causal, and so it can be represented as a sum of poles in the lower half complex frequency plane. Finding the poles and their residues and Fourier transforming gives
| (S10) |
where the term with coefficient is a pole on the imaginary axis representing overdamped dynamics of the mode (which is induced by its coupling to the modes), and the term with coefficient represents the oscillations of the mode, with the imaginary part of the pole giving the relaxation rate and the real part giving the frequency of oscillation . One can in fact express the full solution for the poles analytically, but the equations are lengthy and we refrain from giving them here. Instead, we evaluate them numerically. If , the long-time dynamics are dominated by the third term of the above equation and the dynamics of the mode are damped oscillations. If , the long-time dynamics are dominated by the monotonic behavior of the second term. We note that away from we find , while the region close to has . How well the crossover can be identified experimentally depends crucially on the prefactors and as well as the available temporal range of the data.
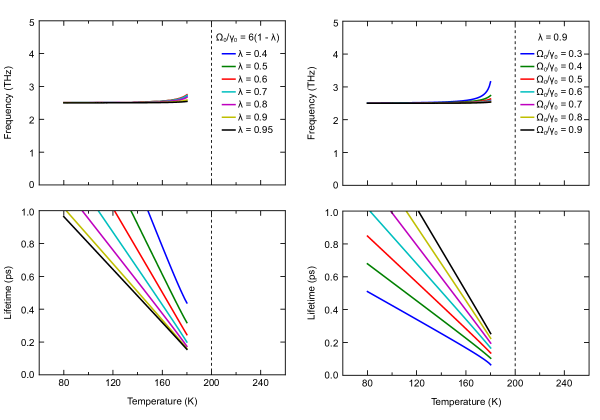
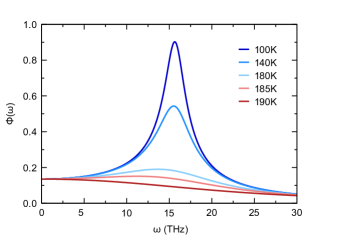
Next we consider the time domain, which is important because that is what is measured in experiment. Fig. S4 summarizes some numerical results for , , and THz. One can clearly identify a dominant frequency up to a temperature K, above which the monotonic relaxation becomes dominant and the subleading oscillatory behavior cannot be extracted reliably (we can still determine analytically where the poles sit and find that at K such that the oscillatory term becomes subdominant). The same can be concluded from the Fourier transform of the mode at real frequency , which is shown in Fig. S5.
Details of calculation. We begin with the free energy given in Eqn. (S1). By expanding around the equilibrium values given in Eqn. (S2) we find
| (S11) |
with force constant matrix given by
| (S12) |
If we assume overdamped dynamics (bare relaxation rate ) for the modes, coherent dynamics for the mode, and scale all frequencies to the bare oscillator frequency , we get the equation of motion
| (S13) |
The response to the probe that excites the “bare” mode is the (1,1) component of
| (S14) |
This result is completely general. We can simplify in this particular case because couples equally to and and the dynamical matrix for the fields is symmetric. Defining , we have
| (S15) |
with
| (S16) |
so the component decouples. The matrix that gives the response of the coupled ( modes is
| (S17) |
In particular the experimentally measured - response is given by the (1,1) component, which is
| (S18) |
We identify the coefficient , relating changes in the field to the applied electric field (called “Source” in the calculation), as the conductivity, which is proportional to the measured change in the reflectivity. Let us rearrange this equation as
| (S19) |
with dimensionless mode self-energy
| (S20) |
where we have used the expressions for and in the second equality.
From the experimental data, we do not observe a large frequency shift as is varied, implying that the real part of depends only weakly on for the relevant parameters. Thus, we must assume that so that the frequency shift remains negligible. This inequality must break down as , but if there is a wide range of where it applies. In this limit, which is obtained for sufficiently large (), . Defining the low-temperature renormalized (observable) mode frequency
| (S21) |
we have
| (S22) |
with
| (S23) |
and
| (S24) |
Our theory therefore has only two fundamental degrees of freedom, and , and a range of and describes the data. The range is constrained by the requirement that . To construct Fig. 4 of the main text, we assumed THz and adjusted as shown in the figure. Our best fit of implies that the bare mode frequency is THz. Of course, other fits with slightly different would also be possible.