Plastic pinning replaces collective pinning as the second magnetization peak disappears in the pnictide superconductor Ba-KFe2As2
Abstract
We report a detailed study of isofield magnetic relaxation and isothermal magnetization measurements with c on an underdoped Ba0.75K0.25Fe2As2 pnictide single crystal, with superconducting transition temperature = 28 K. The second magnetization peak (SMP) has been observed at temperatures below /2 and vanished at higher temperatures. The observed behaviour of the SMP has been studied by measuring the magnetic field dependence of relaxation rate, and by performing the Maley’s analysis. The results suggest that the crossover from collective to plastic pinning observed in the SMP disappears above 12 K with plastic pinning replacing collective pinning. An interesting - phase diagram is obtained. The critical current density () was estimated using Bean’s model and found to be A/m2 at 10 K in the SMP region, which is comparable to an optimally doped Ba-KFe2As2 superconductor and may be exploited for potential technological applications. The pinning mechanism is found to be unconventional and does not follow the usual and pinning models, which suggest the intrinsic nature of pinning in the compound.
pacs:
74.70.Xa,74.25.Wx,74.25.Sv,74.25.UvI Introduction
The study of vortex-dynamics in type-II superconductors and especially in high temperature superconductors (HTSC) including the iron-pnictides is of great interest due to their high superconducting transition temperature () and the potential for future technological applications.Blatter et al. (1994); Yeshurun et al. (1996) Vortex-dynamics in iron-based superconductors (IBS) Kamihara et al. (2008) has been the subject of intensive research interest because of their moderately high , Zhi-An et al. (2008) high upper critical field (), Senatore et al. (2008); Jaroszynski et al. (2008) small anisotropy Yuan et al. (2009); Altarawneh et al. (2008) and strong inter-grain connectivity, Katase et al. (2011a); Weiss et al. (2012) which also makes them suitable for applications. Aswathy et al. (2010); Zhou et al. (2016); Puri et al. (2015); Taen et al. (2015); Mishev et al. (2016) Among the different phases existing in the vortex-phase diagram of type-II superconductors, one of the most interesting and possibly the most studied is the second magnetization peak (SMP), which is present in isothermal M(H) curves and associated to a peak in the critical current. During the past few years, numerous studies have been performed to understand the origin of SMP in different families of iron-pnictides and there is still an ongoing research with newly prepared materials. Zhou et al. (2016); Ge et al. (2013); Ahmad et al. (2014) In the literature, it has been found that the mechanism responsible for the SMP appears to be system dependent, with explanations including a crossover from elastic to plastic, Zhou et al. (2016); Salem-Sugui Jr et al. (2010) order-disorder transition, Miu et al. (2012); Hecher et al. (2014) vortex-lattice phase transitions, Kopeliansky et al. (2010); Pramanik et al. (2011) and it is even still unclear for few compounds. Salem-Sugui Jr et al. (2011, 2013) For most of the systems exhibiting SMP, the associated line in the phase diagram corresponding to the peak field () extends from very low temperatures (with an exception in the case of Bi-2212 Tamegai et al. (1993); Yeshurun et al. (1994)) up to the temperatures close to the irreversibility line, where, in the case of pnictides, the SMP disappears only as approaches . Despite the origin of SMP being known for many compounds, a fundamental question still remains: why is this feature absent in some samples? A recent study by Song et. al. Song et al. (2016) probed the doping dependence of the superconducting properties in Ba1-xKxFe2As2. Surprisingly, it was found that the critical current density is higher in the = 0.30 underdoped compound, and not in the optimally doped = 0.40 composition, which is most commonly employed for application. Gao et al. (2015)
This result motivated us to perform a thorough study of vortex dynamics in an underdoped Ba1-xKxFe2As2 compound. We employed a hole doped Ba0.75K0.25Fe2As2 single crystal with = 28 K and measured isothermal and magnetic relaxation with the field parallel to the c axis (c) of the sample. We observed that the SMP exists only up to approximately /2 and disappear at higher temperatures. To the best of our knowledge, this is the only system, where the SMP doesn’t lie in the whole temperature range below . This unusual and interesting phenomenon, the disappearance of the SMP at higher temperatures, allowed us to study in detail how the vortex dynamics evolves as the SMP fades out. In principle, the pinning mechanisms above and below temperature /2 should be of different nature. In order to identify the relevant pinning mechanism across the phase diagram of the compound, we performed detailed measurements of magnetic relaxation below the SMP onset (), above the SMP () and in the region between and for various isothermal measurements. To address the question of why the SMP in the present sample exists up to and disappears at higher temperatures, we compared the magnetic relaxation measured above and below . At selected isothermal curves, magnetic relaxation data were taken for magnetic field values ranging from just above up to field values close to the irreversibility point . We estimated the activation energy using magnetic relaxation data and studied the vortex-dynamics in different and ranges of interest. We also measured the distribution over the sample surface and concluded that the sample inhomogeneity does not play a significant role in the pinning distribution. Our analysis showed that the disappearance of the SMP above /2 is due to plastic pinning replacing collective pinning. We also obtained the values using isothermal measurements and compared them with other underdoped and overdoped Ba1-xKxFe2As2 superconductors. Song et al. (2016)
II Experimental
In the present work, we studied a single crystal of Ba1-xKxFe2As2 with = 0.25, in the underdoped region. The crystal was prepared using the flux method. Luo et al. (2008) Magnetic measurements were performed with a vibrating sample magnetometer (VSM, Quantum Design, USA). The magnetic field dependence of the magnetization, and the magnetic relaxation, were measured with c axis in zero field cooled (zfc) mode. Isothermal magnetization, was obtained at different temperatures, ranging from 2 K to with varying from 0 to 9 T. Relaxation data, were taken over a period of approximately 2 hours in the increasing field branch of selected isothermal curves, and for fixed magnetic fields at various different temperatures. The sample quality ( distribution) was investigated using a scanning Hall probe, with a 5 m 5 m active area Hall sensor (1 m thick InSb epilayer on undoped GaAs substrate). Perkins et al. (2002) To map the values over the sample, the Hall voltage profile was recorded while scanning the sample surface. The resolution of the recorded Hall image is 256 pixels 256 pixels. A 4 T split coil superconducting magnet and a continuous flow helium cryostat (Oxford Instruments Ltd.) were used to perform the measurements. The data was collected with an applied field of 0.01 T parallel to the c axis. X-ray diffraction analysis was performed using the transmission Laüe method. A Philips X-ray generator, model PW1024 was used, with a molybdenum anode X-ray tube (15 mA and 30 kV) and a 0.8 mm collimator, to generate the x-rays. The lauegrams were obtained with the single crystal at 35.0 mm from the film and 4 hours of irradiation. Lauegrams simulations were performed using the OrientExpress software, version 3.4. Laugier and Bochu
III Results and discussion
Figure 1a shows the distribution of superconducting transition temperatures across the sample surface. A rather wide distribution of is observed, ranging from 22 to 28 K. However, a major part ( 80) of the sample shows 25-28 K. Our current sample is an interesting case in the sense that, in-spite of its somewhat wide distribution, the results show the presence of SMP and also a relatively high critical current density at low temperatures. It is also unusual that the SMP vanishes for temperatures above . In this work, we studied this unexpected behavior of the SMP, using magnetic relaxation measurements. The single crystal was also analysed through X-ray diffraction using the transmission Laüe method. Fig. 1b shows the lauegram measured with the primary X-ray beam oriented perpendicular to the major face of the crystal. The distribution of reflections indicates that the direction normal to the larger plane of the sample corresponds to a quaternary axis of rotation (C4), which allows us to identify it with the direction of the c-axis of the tetragonal network of the compound. The spots have a slightly filamentous shape and were indexed from the cell parameters provided in Ref. [Johrendt and Pöttgen (2009)]. The x-ray diffraction results are characteristic of a single crystal material. The lauegram pattern was simulated by taking in to account the dispersion of cell parameters arising from a small variation of potassium concentration () within the sample, as inferred from the distribution in Fig. 1a. The observed simulated reflections (not shown) suggest that the slightly filament-shaped spots might be related to crystalline domains in the sample with slightly different cell parameters, which in turn are associated with a small variation of potassium content within the sample. Overall, the x-ray results confirm the good crystalline character of the sample under study.
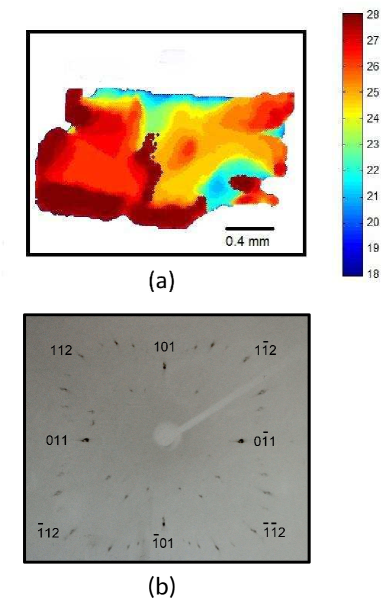
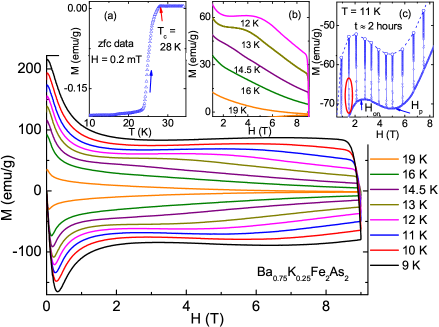
Figure 2 shows selected isothermal () curves evidencing the SMP appearing as the temperature decreases below 14.5 K. Figure 2 shows the transition temperature . Figure 2 shows a detail of the upper branch of selected () curves evidencing that the SMP only develops below 14.5 K. Figure 2 shows magnetic relaxation data, (), obtained for selected fields over the lower branch of isothermals () curves; at 11 K the onset field of the SMP, , and the peak field, , are well defined. Interestingly, the circle in this inset represents the first 30 seconds of relaxation, which corresponds to about 40 of the total magnetic relaxation in a 2 hour period. All magnetic relaxation curves showed the usual logarithmic behavior with time, log() and plots of ln vs. ln allowed us to obtain the relaxation rate = dln/dln.
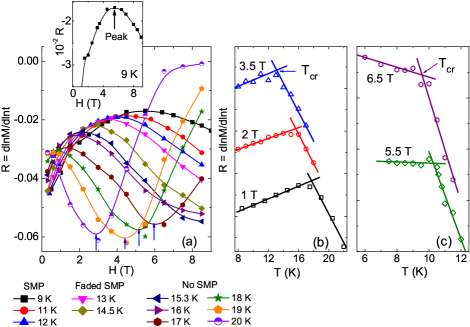
Figure 3 shows plots of vs. , where each curve represents values of obtained for a given isothermal (H. All () isothermal in Fig. 3 show a peak which shifts to lower fields as the temperature increases. While the peaks show some correspondence with in the respective () curves showing the SMP, the argument fails as there is no SMP above 14 K. The peak in each curve suggests a crossover from single vortex or collective pinning (depending on how high is the magnetic field in the region below the peak) to plastic pinning as plasticity is expected as increases. But as shown in Fig. 3, as increases an inverted peak appears for the higher temperature isothermals. Although the inverted peak would suggest some relation with () curves that do not show the SMP, it seems instead, that the effect is related to a proximity to the irreversible field, as probably the inverted peak would appear if a higher magnetic field were available for the lower temperature isothermals. Figures 3 and 3 show plots of the isofield vs. where two well defined different behaviors are observed evidencing a possible crossover at temperature in the pinning mechanism. Salem-Sugui Jr et al. (2015); Kopeliansky et al. (2010); Pramanik et al. (2011); Miu et al. (2012) It is interesting to observe that below the slope of the decreases slowly with increasing fields and shows only a change of slope and not a clear peak at higher fields (Fig. 3). As seen in Fig. 3, the crossing points identified as appear to be related to the position of in the () curves that show the SMP, but again the argument fails as there is no SMP in the isothermals above 14 K. These observations suggest that the vortex-dynamics in the different temperature regimes are different and we need a deeper insight to understand the suppressed SMP behaviour above 14 K (/2).
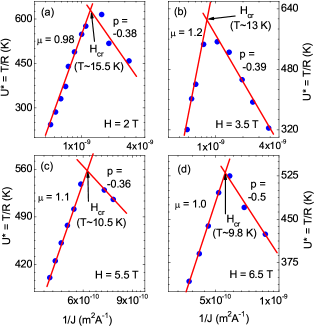
The dependence discussed in the previous paragraph shows the validity of the collective pinning theory in the present case. Hence, it is useful to understand the vortex dynamics in the realm of collective pinning theory, using vs. plot, as previously exploited in recent studies. Taen et al. (2012); Zhou et al. (2016) The activation energy in the collective pinning theory varies with the current density () as, Feigel man et al. (1989), where and depends on the dimensionality and size of the vortex bundles under consideration. In the case of a 3-dimensional system, values were predicted to be 1/7, 3/2, 7/9 for single-vortex, small-bundle and large-bundle regimes, respectively. Feigel man et al. (1989); Griessen et al. (1997) Hence, the exponent can easily be extracted by a double logarithmic plot of vs. , shown in Fig. 4 for different fields. Our experiments yield values about at low temperatures (left side of ), which lies in between 1/7 (single-vortex) and 3/2 (small-bundle). Similar values were reported in numerous other studies of IBS Zhou et al. (2016); Salem-Sugui Jr et al. (2010); Miu et al. (2012); Haberkorn et al. (2011); Taen et al. (2012) and YBCO superconductor, Thompson et al. (1993) and suggest the different types of pinning contributions. On the other hand, the slope at high temperatures (right side of ) is found to be about -, which is consistent with the exponent observed in plastic-creep theory, Abulafia et al. (1996) where the negative exponent is usually denoted as with a value of -. These observations suggest that there is a crossover from a collective pinning behaviour to plastic pinning, which gives rise to the SMP. However, the - phase diagram (Fig. 5) shows that the crossover point observed in vs. plot lies in the region where SMP doesn’t exist. This discrepancy casts a shadow on the use of the analysis of vs. to show the collective to plastic-pinning crossover.
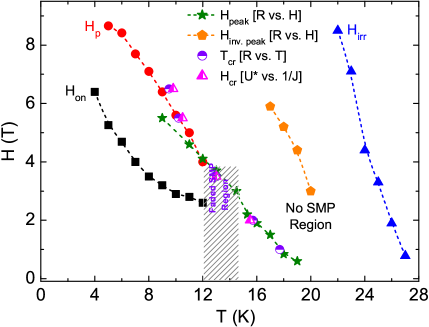
To analyse the behaviour of vortex-dynamics in different temperature regimes, we plotted the different characteristic temperature and field values in the phase diagram shown in Fig. 5. Both and exist well below line. The shaded portion in the diagram shows a region where SMP is not well defined, (named as faded-SMP), above which the typical signature of SMP in vanishes (named as no-SMP). The line (from ) up to 12 K lies within the line, as also seen in Ref. Zhou et al. (2016), which shows that the SMP is associated with the peak in in this temperature range. However, is also present in the region above 12 K, where no SMP is observed. The and lines follow the line in the faded-SMP and no-SMP regimes, whereas, in the SMP regime (below 12 K), it follow the line. This suggests that the crossover points and in vs. and vs. respectively are rather misleading in the faded-SMP and no-SMP temperature regimes. Hence, we employed another technique to investigate the vortex-dynamics in the SMP, faded-SMP and no-SMP temperature regimes, which is discussed below.
To investigate the reason for the vanishing of the SMP above /2, we studied the mechanism of vortex-dynamics using activation energy () vs. magnetic moment () curves. In this analysis, the activation energy is obtained for each curve by exploiting the approach developed by Maley et al., Maley et al. (1990)
| (1) |
where C is a constant which depends on the hoping distance of the vortex, the attempt frequency and the sample size. The activation energy is plotted with respect to the magnetic moment (obtained at fixed and during ) in Fig. 6. Panels (), () and () display the vs. curves for = 1.5 T, 4.5 T and 8.5 T corresponding to the , and respectively. The reason for choosing these field values for the Maley’s plot is that the characteristic pinning mechanism in the field above and below the SMP might be different. The insets of Fig. 6, 6 and 6 show the results of Maley’s analysis for = 40, which is justified below, similar C value has also been observed in the literature. McHenry et al. (1991) In Fig. 6, it is clear that the curves do not show the smooth behaviour as has been observed for temperatures close to . McHenry et al. (1991) To obtain a smooth curve of , we have to scale the activation energy curves with scaling function. McHenry et al. (1991) As suggested by McHenry et al., McHenry et al. (1991) in Fig. 6, we have used the scaling form to obtain the smooth curves, which depends on the pinning length scale close to .
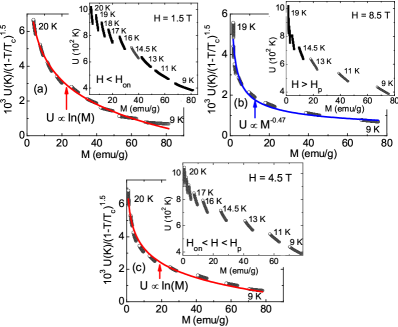
The results of Fig. 6 show that the scaled curve for = 4.5 T () follows a power law with . On the other hand, for fields = 1.5 T ( ) and 8.5 T ( ), the scaled curves follow a logarithmic behaviour. Maley et al. (1990); McHenry et al. (1991) It is to be noted that the parameter is obtained to get a best smooth curve of . Using this analysis, we estimated = 40, which is then used to estimate the activation energy, , for each curve in different temperature regimes (namely, SMP, faded-SMP, no-SMP).
The insets of Fig. 7 show the curves obtained at = 9 K for different field ranges. Since, the SMP is clearly observed at this temperature, we wish to investigate if the pinning mechanism is different for fields and . As discussed previously Feigel man et al. (1989); Blatter et al. (1994) and further exploited by Abulafia et. al., Abulafia et al. (1996) the expression for the activation energy in the collective creep theory is described as, , where the critical exponents and depend on the specific pinning regime. It is known that in the collective pinning, the activation energy increases with increasing magnetic field and later Abulafia et al. (1996) shown that the activation energy above is described in terms of plastic pinning, where the activation energy decreases with increasing field. It suggests that the positive or negative values of exponent defines the collective (elastic) and plastic pinning mechanisms respectively. With this understanding, we scaled the curves shown in the insets for each panel of Fig. 7 for different magnetic field regimes at = 9 K with a different exponent of . The scaled curves are shown in the main panels of Fig. 7 with smooth behaviour. It is interesting to observe that each scaled curve follow a power law behaviour with . Using Ref. Abulafia et al. (1996), we may unambiguously state that in , the vortex pinning is collective (Fig. 7) in nature and it changes to plastic pinning for (Fig. 7). Hence, the results of Fig. 7 clearly demonstrates that the SMP is due to a crossover from collective (elastic) to plastic pinning behaviour.
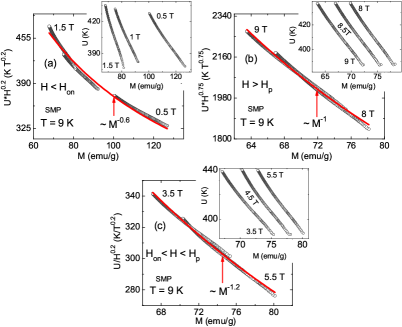
On the other hand, the fitting of the scaled curve in Fig. 7, suggests that the vortex pinning for is also dominated by the plastic behaviour as for . However, the activation energy increases with in the region, which is not consistent with the plastic behaviour of vortex-pinning. It is to be noted that the scaled curve in Fig. 7 is obtained by considering that the has a power law dependence with of the form . This apparent contradiction in pinning behaviour for has been observed by Abulafia et al. Abulafia et al. (1996) and later by other researchers Salem-Sugui Jr et al. (2010); Zhou et al. (2016) and negates the possibility of plastic pinning for . It also eliminates the possibility of collective pinning as observed for . The nature of the pinning below may be understood in terms of the single vortex pinning, which changes to the collective pinning above and renders a peak at . However, this peak is entirely different than the SMP observed at which arises due a pinning crossover (collective to plastic) below and above .
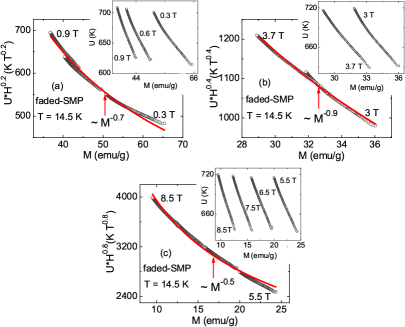
Similarly to Fig. 7, the activation energy was also estimated from curves measured at = 14.5 K, as shown in Fig. 8. In Fig. 2 the data at = 14.5 K shows a very subtle feature of SMP (faded-SMP). By comparing the pinning behavior at different field regimes shown in each panel of Fig.8, we can clearly state that the vortices show no pinning crossover (collective to plastic) as observed in Fig. 7. This is an expected result for 14.5 K, where no distinct SMP is observed. The scaling shown in Fig. 8 points to a plastic pinning behaviour but in fact the plastic pinning is not valid in the mentioned field range and follows the single-vortex elastic pinning as also discussed in case of Fig. 7. Exactly the same results as at 14.5 K, are also observed for measurements at = 19 K (not shown). Figure 8 emphasizes that the absence of SMP above is due to the absence of a pinning crossover (collective to plastic) at intermediate fields. This behaviour is somewhat unusual and to our knowledge has not been observed before.
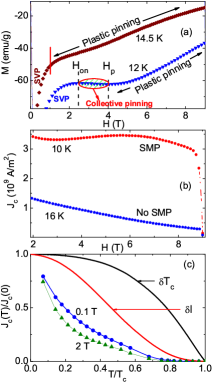
Figure 9 shows data, measured at 12 K and 14.5 K, to emphasize the difference in vortex creep and pinning in the SMP and faded-SMP temperature regimes respectively. In the SMP regime, a pinning crossover from collective to plastic creep is observed, whereas, in the faded-SMP regime, no such crossover is noticed, suggesting that plastic pinning takes the place of collective pinning. In the low field side, single vortex pinning (SVP) described the behavior of vortices. It must be noticed that the change in the pinning properties responsible for the disappearance of SMP above , is not related with the sample inhomogeneity. Separate regions with different within the sample are distributed inhomogeneously, with a major part ( 80) having 25-28 K and a small part of the sample with a lower down to 22 K. Since the regions of different are spatially distributed quite separately from each other, it is unlikely that such inhomogeneity would contribute to the pinning mechanism of the sample. Dew-Hughes (1971)
Figure 9 shows the magnetic field dependence of the critical current density, , at = 10 K and 16 K, estimated from the irreversibility in isothermal above the field of full penetration. The was estimated with Bean’s critical state model, Bean (1964) using the expression , where is the difference between the field decreasing and field increasing branches of (ref.Sundar et al. (2015)). The parameters 2 and 2 are the dimensions of the sample to get the cross sectional area perpendicular to field direction. The value at = 10 K in the SMP regime is about A/m2 and is even higher at lower temperatures. High values of have been reported for YBCO tapes (epitaxial deposition and biaxially textured tapes), where the maximum is reported to be A/m2 in zero field at 77 K. Goyal et al. (1996); Norton et al. (1996) In Co-doped BaFe2As2 iron-pnictide superconductors, the maximum value is found to be even higher than 1010A/m2 at 4.2 K for thin films. Katase et al. (2010, 2011b, 2011a) However, the polycrystalline bulk and round wires of Ba0.6K0.4Fe2As2 show a maximum of about 109A/m2 at 4.2 K in self field, Weiss et al. (2012) which is claimed to be more than 10 times higher than that of any other round untextured ferropnictide wire and even 4-5 times higher than the best textured flat wire. Weiss et al. (2012) Therefore, the value in the present study ( A/m2) is comparable as found by the Weiss et al. Weiss et al. (2012) for optimally doped BaKFe2As2 superconductor. This suggests that an underdoped BaKFe2As2 superconductor is also a potential candidate for application. These results are consistent with the recent observations by Song et. al. Song et al. (2016)
Figure 9 shows the reduced temperature () dependence of at 0.1 T and 2 T. This figure clearly shows that the pinning mechanism in the present sample is much different than the conventional () and () pinning models, which has been observed in the other IBS of 122 family. Vlasenko et al. (2015) It has also been argued that this unconventional pinning behaviour in the 122 family is directly related with the strong intrinsic pinning and need further attention. Vlasenko et al. (2015) However, the literature Ghorbani et al. (2012) suggests that, in Ba0.72K0.28Fe2As2 superconductor, both the and pinning co-exist and their contributions are strongly temperature and magnetic field dependent.
IV Conclusions
In conclusion, we presented a study of isofield magnetic relaxation and isothermal magnetization on an underdoped Ba1-xKxFe2As2 ( = 0.25) single crystal, with a superconducting transition temperature = 28 K. The sample exhibits the second magnetization peak (SMP) for temperatures below and this feature is suppressed completely at higher temperatures. The temperature regime below 12 K is defined as the SMP regime and above 14.5 K, as the no-SMP regime, whereas, at intermediate temperatures, we call it the faded-SMP regime. The gradual suppression of the SMP above 12 K has been studied initially through the field dependence of relaxation rate, . It shows a peak behavior at the low field side with an inverted peak at higher fields and both of these peaks shift to the lower field side at higher temperatures. The peak in shows good resemblance with the observed position () of the SMP and extends up to the no-SMP temperature region. The crossover point () in the plot of the inverse current density (1/) vs. activation energy () also follows the peak position in in the no-SMP region, and in the SMP region, it follows the SMP line. The crossover point suggests the elastic to plastic pinning crossover even in the no-SMP region. To resolve this apparent controversy, relaxation data, , was used to study the vortex-dynamics in different regimes, using Maley’s approach. The results suggest that the observed SMP below 12 K is due to collective to plastic pinning crossover whereas in the temperature regime above 12 K, no pinning crossover has been observed and plastic pinning replaces the collective pinning behavior. In addition, the critical current density, was estimated using Bean’s model and found to be about A/m2 at T = 10 K (in SMP regime), which is comparable to the value observed for optimally doped BaKFe2As2 superconductor. The pinning mechanism in the present case is much different than the conventional and pinning models, and, is similar to the other IBS of 122 family. The higher value of in this underdoped pnictide suggests its usefulness for technological application over optimally doped samples.
V ACKNOWLEDGMENTS
This work was supported by the Brazillian agencies CAPES (Science without Borders program), FAPERJ and CNPq.
References
- Blatter et al. (1994) G. Blatter, M. V. Feigel’man, V. B. Geshkenbein, A. I. Larkin, and V. M. Vinokur, Rev. Mod. Phys. 66, 1125 (1994).
- Yeshurun et al. (1996) Y. Yeshurun, A. P. Malozemoff, and A. Shaulov, Rev. Mod. Phys. 68, 911 (1996).
- Kamihara et al. (2008) Y. Kamihara, T. Watanabe, M. Hirano, and H. Hosono, J. Am. Chem. Soc. 130, 3296 (2008).
- Zhi-An et al. (2008) R. Zhi-An, L. Wei, Y. Jie, Y. Wei, S. Xiao-Li, L. Zheng-Cai, C. Guang-Can, D. Xiao-Li, S. Li-Ling, Z. Fang, and Z. Zhong-Xian, Chin. Phys. Lett. 25, 2215 (2008).
- Senatore et al. (2008) C. Senatore, R. Flükiger, M. Cantoni, G. Wu, R. H. Liu, and X. H. Chen, Phys. Rev. B 78, 054514 (2008).
- Jaroszynski et al. (2008) J. Jaroszynski, F. Hunte, L. Balicas, Y. J. Jo, I. Raicevic, A. Gurevich, D. C. Larbalestier, F. F. Balakirev, L. Fang, P. Cheng, Y. Jia, and H. H. Wen, Phys. Rev. B 78, 174523 (2008).
- Yuan et al. (2009) H. Q. Yuan, J. Singleton, F. F. Balakirev, S. A. Baily, G. F. Chen, J. L. Luo, and N. L. Wang, Nature (London, United Kingdom) 457, 565 (2009).
- Altarawneh et al. (2008) M. M. Altarawneh, K. Collar, C. H. Mielke, N. Ni, S. L. Bud ko, and P. C. Canfield, Phys. Rev. B 78, 220505(R) (2008).
- Katase et al. (2011a) T. Katase, Y. Ishimaru, A. Tsukamoto, H. Hiramatsu, T. Kamiya, K. Tanabe, and H. Hosono, Nat. Commun. 2, 409 (2011a).
- Weiss et al. (2012) J. D. Weiss, C. Tarantini, J. Jiang, F. Kametani, A. A. Polyanskii, D. C. Larbalestier, and E. E. Hellstrom, Nature Mater. 11, 682 (2012).
- Aswathy et al. (2010) P. M. Aswathy, J. B. Anooja, P. M. Sarun, and U. Syamaprasad, Supercond. Sci. Technol. 23, 073001 (2010).
- Zhou et al. (2016) W. Zhou, X. Xing, W. Wu, H. Zhao, and Z. Shi, Sci. Rep. 6, 22278 (2016).
- Puri et al. (2015) A. Puri, A. Marcelli, N. Poccia, A. Ricci, U. Zeitler, and D. D. Gioacchino, Physics Procedia 67, 890 (2015).
- Taen et al. (2015) T. Taen, F. Ohtake, S. Pyon, T. Tamegai, and H. Kitamura, Supercond. Sci. Technol. 28, 085003 (2015).
- Mishev et al. (2016) V. Mishev, M. Nakajima, H. Eisaki, and M. Eisterer, Sci. Rep. 6, 27783 (2016).
- Ge et al. (2013) J. Ge, J. Gutierrez, J. Li, J. Yuan, H.-B. Wang, K. Yamaura, E. Takayama-Muromachi, and V. V. Moshchalkov, Phys. Rev. B 88, 144505 (2013).
- Ahmad et al. (2014) D. Ahmad, B. H. Min, J. H. Lee, G. C. Kim, Y. C. Kim, and Y. S. Kwon, Journal of Physics: Conference Series 507, 012027 (2014).
- Salem-Sugui Jr et al. (2010) S. Salem-Sugui Jr, L. Ghivelder, A. D. Alvarenga, L. F. Cohen, K. A. Yates, K. Morrison, J. L. Pimentel, H. Luo, Z. Wang, and H.-H. Wen, Phys. Rev. B 82, 054513 (2010).
- Miu et al. (2012) D. Miu, T. Noji, T. Adachi, Y. Koike, and L. Miu, Supercond. Sci. Technol. 25, 115009 (2012).
- Hecher et al. (2014) J. Hecher, M. Zehetmayer, and H. W. Weber, Supercond. Sci. Technol. 27, 075004 (2014).
- Kopeliansky et al. (2010) R. Kopeliansky, A. Shaulov, B. Y. Shapiro, Y. Yeshurun, B. Rosenstein, J. J. Tu, L. J. Li, G. H. Cao, and Z. A. Xu, Phys. Rev. B 81, 092504 (2010).
- Pramanik et al. (2011) A. K. Pramanik, L. Harnagea, C. Nacke, A. U. B. Wolter, S. Wurmehl, V. Kataev, and B. Buchner, Phys. Rev. B 83, 094502 (2011).
- Salem-Sugui Jr et al. (2011) S. Salem-Sugui Jr, L. Ghivelder, A. D. Alvarenga, L. F. Cohen, H. Luo, and X. Lu, Phys. Rev. B 84, 052510 (2011).
- Salem-Sugui Jr et al. (2013) S. Salem-Sugui Jr, L. Ghivelder, A. D. Alvarenga, L. F. Cohen, H. Luo, and X. Lu, Supercond. Sci. Technol. 26, 025006 (2013).
- Tamegai et al. (1993) T. Tamegai, Y. Iye, I. Oguro, and K. Kishio, Physica C 213, 33 (1993).
- Yeshurun et al. (1994) Y. Yeshurun, N. Bontemps, L. Burlachkov, and A. Kapitulnik, Phys. Rev. B 49, 1548 (1994).
- Song et al. (2016) D. Song, S. Ishida, A. Iyo, M. Nakajima, J. ichi Shimoyama, M. Eisterer, and H. Eisaki, Sci. Rep. 6, 26671 (2016).
- Gao et al. (2015) Z. Gao, K. Togano, A. Matsumoto, and H. Kumakura, Supercond. Sci. Technol. 28, 012001 (2015).
- Luo et al. (2008) H. Q. Luo, Z. S. Wang, H. Yang, P. Cheng, X. Zu, and H.-H. Wen, Supercond. Sci. Technol. 21, 125014 (2008).
- Perkins et al. (2002) G. K. Perkins, J. Moore, Y. Bugoslavsky, L. F. Cohen, J. Jun, S. M. Kazakov, J. Karpinski, and A. D. Caplin, Supercond. Sci. Technol. 15, 1156 (2002).
- (31) J. Laugier and B. Bochu, Orientexpress v3.4.
- Johrendt and Pöttgen (2009) D. Johrendt and R. Pöttgen, Physica C 469, 332 (2009).
- Salem-Sugui Jr et al. (2015) S. Salem-Sugui Jr, J. Mosqueira, A. D. Alvarenga, D. S ora, E. P. Herculano, D. Hu, G. Chen, and H. Luo, Supercond. Sci. Technol. 28, 055017 (2015).
- Taen et al. (2012) T. Taen, Y. Nakajima, T. Tamegai, and H. Kitamura, Phys. Rev. B 86, 094527 (2012).
- Feigel man et al. (1989) M. V. Feigel man, V. B. Geshkenbein, A. I. Larkin, and V. M. Vinokur, Phys. Rev. Lett. 63, 2303 (1989).
- Griessen et al. (1997) R. Griessen, A. Hoekstra, H. Wen, G. Doombos, and H. Schnack, Physica C 282-287, 347 (1997).
- Haberkorn et al. (2011) N. Haberkorn, M. Miura, B. Maiorov, G. F. Chen, W. Yu, and L. Civale, Phys. Rev. B 84, 094522 (2011).
- Thompson et al. (1993) J. R. Thompson, Y. R. Sun, L. Civale, A. P. Malozemoff, M. W. McElfresh, A. D. Marwick, and F. Holtzberg, Phys. Rev. B 47, 14440 (1993).
- Abulafia et al. (1996) Y. Abulafia, A. Shaulov, Y. Wolfus, R. Prozorov, L. Burlachkov, Y. Yeshurun, D. Majer, E. Zeldov, H. Wuhl, V. B. Geshkenbein, and V. M. Vinokur, Phys. Rev. Lett. 77, 1596 (1996).
- Maley et al. (1990) M. P. Maley, J. O. Willis, H. Lessure, and M. E. McHenry, Phys. Rev. B 42, 2639 (1990).
- McHenry et al. (1991) M. E. McHenry, S. Simizu, H. Lessure, M. P. Maley, J. Y. Coulter, I. Tanaka, and H. Kojima, Phys. Rev. B 44, 7614 (1991).
- Dew-Hughes (1971) D. Dew-Hughes, Rep. Prog. Phys. 34, 821 (1971).
- Bean (1964) C. Bean, Rev. Mod. Phys. 36, 31 (1964).
- Sundar et al. (2015) S. Sundar, M. Chattopadhyay, L. S. Chandra, and S. Roy, Physica C 519, 13 (2015).
- Goyal et al. (1996) A. Goyal, D. P. Norton, J. D. Budai, M. Paranthaman, E. D. Specht, D. M. Kroeger, D. K. Christen, Q. He, B. Saffian, F. A. List, D. F. Lee, P. M. Martin, C. E. Klabunde, E. Hartfield, and V. K. Sikka, Appl. Phys. Lett. 69, 1795 (1996).
- Norton et al. (1996) D. P. Norton, A. Goyal, J. D. Budai, D. K. Christen, D. M. Kroeger, E. D. Specht, Q. He, B. Saffian, M. Paranthaman, C. E. Klabunde, D. F. Lee, B. C. Sales, and F. A. List, Science 274, 755 (1996).
- Katase et al. (2010) T. Katase, H. Hiramatsu, T. Kamiya, and H. Hosono, Appl. Phys. Express 3, 063101 (2010).
- Katase et al. (2011b) T. Katase, H. Hiramatsu, V. Matias, C. Sheehan, Y. Ishimaru, T. Kamiya, K. Tanabe, and H. Hosono, Appl. Phys. Lett. 98, 242510 (2011b).
- Vlasenko et al. (2015) V. A. Vlasenko, K. S. Pervakov, S. Y. Gavrilkin, and Y. F. Eltsev, Physics Procedia 67, 952 (2015).
- Ghorbani et al. (2012) S. R. Ghorbani, X. L. Wang, M. Shahbazi, S. X. Dou, and C. Lin, Applied Physics Letters 100, 212601 (2012).