New Spectral Model for Constraining Torus Covering Factors
from Broadband X-ray Spectra of Active Galactic Nuclei
Abstract
The basic unified model of active galactic nuclei (AGN) invokes an anisotropic obscuring structure, usually referred to as a torus, to explain AGN obscuration as an angle-dependent effect. We present a new grid of X-ray spectral templates based on radiative transfer calculations in neutral gas in an approximately toroidal geometry, appropriate for CCD-resolution X-ray spectra (FWHM130 eV). Fitting the templates to broadband X-ray spectra of AGN provides constraints on two important geometrical parameters of the gas distribution around the supermassive black hole: the average column density and the covering factor. Compared to the currently available spectral templates, our model is more flexible, and capable of providing constraints on the main torus parameters in a wider range of AGN. We demonstrate the application of this model using hard X-ray spectra from NuSTAR (3–79 keV) for four AGN covering a variety of classifications: 3C 390.3, NGC 2110, IC 5063 and NGC 7582. This small set of examples was chosen to illustrate the range of possible torus configurations, from disk-like to sphere-like geometries with column densities below, as well as above, the Compton-thick threshold. This diversity of torus properties challenges the simple assumption of a standard geometrically and optically thick toroidal structure commonly invoked in the basic form of the unified model of AGN. Finding broad consistency between the our constraints and those from infrared modeling, we discuss how the approach from the X-ray band complements similar measurements of AGN structures at other wavelengths.
1 Introduction
According to the simple unification model of active galactic nuclei (AGN), a toroid-like structure (popularly, torus) provides the anisotropic obscuration needed to explain the diversity of AGN observed across the electromagnetic spectrum (Antonucci 1993, Urry & Padovani 1995). The torus absorbs and reprocesses radiation from the accretion disk and the innermost regions around the supermassive black hole (SMBH). Reprocessed thermal emission from dust in the torus is observed primarily in the infrared part of the spectrum (see, e.g., Hönig 2012, Netzer 2015 for recent reviews). Signatures of reprocessing in the X-ray band—narrow fluorescent emission lines (most notably, neutral iron lines around 6.4 keV) and the Compton hump broadly peaking at 10–30 keV—arrise primarily from interaction of X-ray photons with the surrounding gas (e.g., Leahy & Creighton 1993, Ghisellini et al. 1994, Krolik et al. 1994). These spectral features have been observed in nearly all X-ray spectra of non-blazar AGN with sufficient energy coverage and data quality (e.g., Nandra & Pounds 1994, Turner et al. 1997, Risaliti 2002, Dadina 2008, Rivers et al. 2013, Vasudevan et al. 2013, Kawamuro et al. 2016).
A large body of literature on X-ray spectroscopy of AGN is based on models computed for reprocessing in a semi-infinite plane geometry, the most popular of which is pexrav (Magdziarz & Zdziarski, 1995). Spectral models in which the signature of the torus is approximated with pexrav have been popular for describing the phenomenology of broadband X-ray spectra of AGN because this simple geometry is easily parametrized, and because the quality of hard X-ray data ( keV) was such that deviations from this assumption were generally not considered significant. Reprocessed continua are known to vary as a function of geometry of the reprocessing material (e.g., Nandra & George 1994, Yaqoob 1997, Murphy & Yaqoob 2009, Ikeda et al. 2009, Brightman & Nandra 2011, Liu & Li 2014, Furui et al. 2016); however, the ability to constrain the geometry of the reprocessing material is clearly lacking in the pexrav-based phenomenological approach. The 100-fold increase in sensitivity in the hard X-ray band ( keV) brought by NuSTAR (Harrison et al., 2013) made it possible to study the spectral signatures of the torus in detail.
Empirically motivated spectral models with approximately toroidal geometry have been calculated by Murphy & Yaqoob (2009, MYtorus hereafter), Ikeda et al. (2009), Brightman & Nandra (2011, BNtorus hereafter), Liu & Li (2014, ctorus hereafter) and Furui et al. (2016), and some were made available to the community. These models, especially MYtorus and BNtorus, have been used extensively for detailed spectroscopic studies of nearby obscured AGN observed with NuSTAR (e.g., Arévalo et al. 2014, Baloković et al. 2014, Annuar et al. 2015, Rivers et al. 2015, Ricci et al. 2016, Boorman et al. 2016, Gandhi et al. 2017), as well as studies using broadband data with hard X-ray coverage from Suzaku/PIN, Swift/BAT and INTEGRAL instruments (e.g., Fukazawa et al. 2011, Tazaki et al. 2011, Yaqoob 2012, Braito et al. 2013, Vasylenko et al. 2013, Miniutti et al. 2014, Yaqoob et al. 2015).
These torus models are limited in the range of physical scenarios they describe. In MYtorus, with a geometry of an actual torus, the covering factor is fixed (50 % of the sky covered as seen from the SMBH). This assumption limits the range of spectral shapes that the model can reproduce without decoupling it into several independent components. This leads to the normalizations of the reprocessed spectrum no longer being consistent with the torus geometry. Such a decoupling is often required in spectral analyses of high-quality broadband X-ray spectra (e.g., Puccetti et al. 2014, Bauer et al. 2015, Guainazzi et al. 2016). As described in detail by Yaqoob (2012), the user typically needs to assume presence of reprocessing spectral components for both edge-on and pole-on inclination with arbitrary relative normalization, disconnected from the normalization of the observed intrinsic continuum.
In the BNtorus model, the torus opening angle is a free parameter, but the torus column density is assumed to be equal to the line-of-sight column density () for any obscured AGN. While this assumption does not hold in general (e.g., Risaliti et al. 2010, Marchese et al. 2012, Yaqoob et al. 2015), and is also dependent on the specific modeling used (i.e., phenomenological versus physically motivated), it does describe some AGN well (e.g., Gandhi et al. 2014, Annuar et al. 2015, Koss et al. 2015). In particular, Compton-thick (CT; cm-2) AGN represent 20–50 % of the local AGN population (e.g., Ricci et al. 2015, Akylas et al. 2016, Koss et al. 2016), and it is widely believed that our line of sight crosses their tori in most cases (Ricci et al., 2017b). BNtorus may therefore be applicable to CT AGN spectra, and Brightman et al. (2015) used it to measure the torus covering factors in a sample of 10 NuSTAR-observed CT AGN.
Many multi-epoch X-ray studies have shown that varies on timescales of hours to months, as clouds of gas pass in and out of our line of sight (e.g., Risaliti et al. 2002, Lamer et al. 2003, Risaliti et al. 2010, Marchese et al. 2012, Braito et al. 2013, Markowitz et al. 2014, Rivers et al. 2015, Guainazzi et al. 2016, Marinucci et al. 2016, Ricci et al. 2016). The average column density of the torus, which is a large parsec-scale structure, can only vary over significantly longer timescales (year). The ability to decouple the line-of-sight component from reprocessing in the spatially extended torus is essential for multi-epoch modeling of a wide variety of AGN. While this is possible with MYtorus and ctorus, they do not feature the covering factor as a free parameter.
The covering factor of the torus is one of its most basic geometric parameters. It may be affected by winds and outflows from the innermost regions around the SMBH, therefore providing insight into physics of AGN feedback and the interaction of SMBHs with their host galaxies (e.g., Elvis 2000, Hopkins et al. 2006, Fabian 2012, Heckman & Best 2014, Netzer 2015). Studies in the infrared band indicate that the torus covering factor may be a function of luminosity (e.g., Maiolino et al. 2007, Treister et al. 2008, Assef et al. 2013), and may correlate with other measurable properties (e.g., presence of broad lines in optical spectra; Mateos et al. 2016). It has been suggested that the covering factor depends on the Eddington ratio (e.g., Ezhikode et al. 2017, Buchner & Bauer 2017, Ricci et al. 2017b), and that its dependence on luminosity or the Eddington ratio changes with redshift (e.g., Aird et al. 2015, Buchner et al. 2015). AGN population studies in the X-ray band suggest that the fraction of obscured AGN drops as a function of luminosity (e.g., Sazonov & Revnivtsev 2004, Hasinger 2008, Burlon et al. 2011, Vasudevan et al. 2013). A tentative trend for lower covering factors at higher luminosity was also found from analyses of individual AGN both in the infrared (Alonso-Herrero et al., 2011) and in the X-ray band (Brightman et al., 2015).
The next step toward systematically probing the properties of the torus from the X-ray band will be analyses of AGN samples with good-quality hard X-ray data. A large, representative sample of nearby obscured AGN observed with NuSTAR will be presented in an upcoming paper (B18 hereafter).111See Baloković (2017) for preliminary results. This study revealed that the local AGN population exhibits a broad range of Compton hump strengths when modeled with pexrav222In pexrav and pexmon (extension of pexrav, including fluorescent line emission; Nandra et al. 2007), the contribution of reprocessed continuum is parametrized with the spectral parameter . To avoid confusion, because this parameter can formally take on negative values, we define . corresponds to the amount of reprocessing created by an infinitely optically thick plane covering one half of the sky as seen from the X-ray source. While small deviations from unity can be interpreted as the reprocessing medium covering a solid angle of , this interpretation clearly fails for deviations greater than a factor of , which are often found in X-ray spectral analyses., including a significant fraction with high values (e.g., Ricci et al. 2011, Rivers et al. 2013, Vasudevan et al. 2013, Kawamuro et al. 2016, B18), which may be indicative of the increased (or decreased) prominence of the Compton hump as a function of the covering factor of the torus and its average column density. While this idea is not new (e.g., Madejski et al. 2000; Krolik et al. 1994; Ghisellini et al. 1994), the operational tool for measuring the covering factor from X-ray spectra independently from the line-of-sight component has thus far not been available.
In this paper we present a new tool for probing the torus structure from the X-ray band. With its increased flexibility in comparison with currently available models, we aim to enable studies of the main torus parameters in AGN of any class. Our grid of spectral templates is made available to the community in the form of a new Xspec table model (Arnaud, 1996). Construction of the spectral template grid is presented in § 2. In § 3 we demonstrate its use on NuSTAR spectra of four different AGN in order to highlight its features and capabilities. In § 4 we briefly discuss the results for this small and diverse set of examples, and their interpretation. We also make a comparison to relevant measurements from the literature, with particular emphasis on the infrared, and discuss the prospect for future synergy with other methods of constraining torus geometry.
2 New Spectral Templates
Reprocessed components of AGN X-ray spectra are formed in interaction of the intrinsic X-ray continuum of AGN with the surrounding medium. In order to investigate the details of the complex relationship between the geometry of this material and the observed spectra, we have built a new Monte Carlo radiative transfer code BORUS (Baloković et al., in prep.). Radiative transfer simulations using this code can be performed in an arbitrary geometry, and at energy resolution matching high-resolution X-ray calorimeters similar to Hitomi/SXS (Mitsuda et al., 2014), e.g., Athena/XIFU (Barret et al., 2016), and the Hitomi successor XARM (X-ray Astronomy Recovery Mission). Details of the radiative transfer calculations in a range of geometries appropriate for AGN tori will be presented in the aforementioned paper; here we only outline the main properties, and then focus on the particular subset of low-resolution spectral templates used in this paper. The spectral templates are available on the Web333http://www.astro.caltech.edu/~mislavb/download, and can be obtained directly from the authors.
2.1 Model Setup
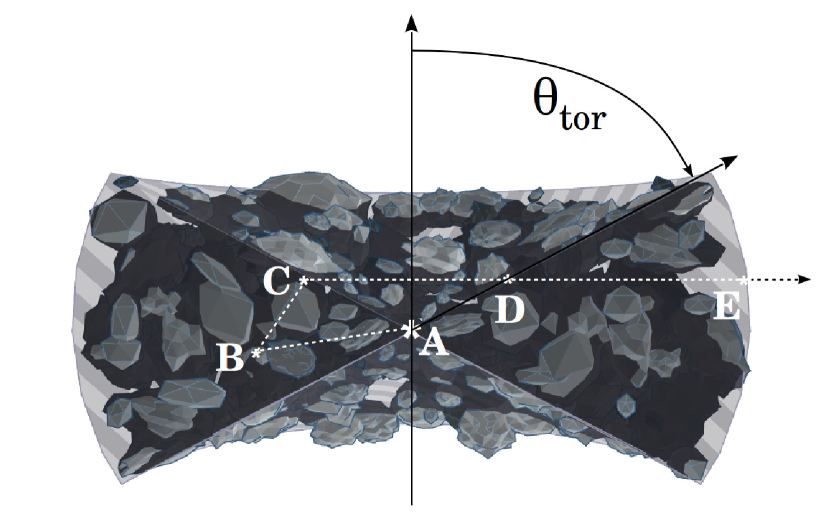
The BORUS radiative transfer code is capable of computation in an arbitrary 3-dimensional space within which matter density can be represented as a mathematical function of position, or as a data cube. It is therefore possible to calculate output spectra for complex matter distributions expected from hydrodynamical simulations of the circumnuclear environment (e.g., Wada 2012). However, for fitting limited-quality X-ray data, these structures need to be simplified and parametrized. For the spectral templates presented here, we choose the same simple, approximately toroidal geometry employed in Brightman & Nandra (2011). They used a uniform-density sphere with two conical polar cutouts with the opening angle as a free parameter of the model.444Specifically, this geometry is assumed for the Xspec table model torus1006.fits. This simplification should be thought of as a smoothed distribution of individual clouds comprising the torus, as illustrated in Figure 1. The adopted geometry implicitly assumes that any individual cloud is much smaller than the torus itself, and that clouds take up most of the approximately toroidal volume. Although we used the same geometry as Brightman & Nandra (2011), our new calculation is more detailed, flexible, includes features that the original calculation lacks, and resolves some known problems and errors (see, Liu & Li 2014). We directly compare our new spectral templates with those from BNtorus in § 2.3.
BORUS calculates Green’s functions for initial photon energies between 1 keV and 1 MeV. These functions are convolved with a parametrized intrinsic continuum in post-processing. The medium is assumed to be cold, neutral, and static. Photons are propagated through this medium until they are absorbed without fluorescent re-emission or until they escape the system. At each step, relative probabilities of photoelectric absorption and Compton scattering are computed based on photoelectric absorption cross-sections from the NIST/XCOM database555Available on the Web at https://www.nist.gov/pml/xcom-photon-cross-sections-database; originally Berger & Hubbell (1987)., elemental abundances from Anders & Grevesse (1989), and the Klein-Nishina scattering cross-section formula. In the case of absorption, fluorescent photons are emitted according to fluorescent yields for K, K and K lines from Krause (1979), for all elements up to zinc ().
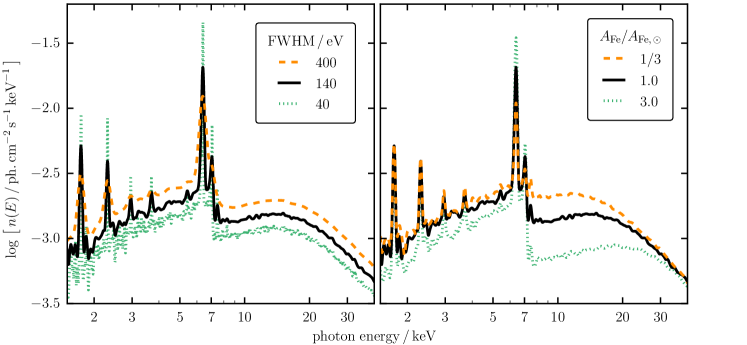
Compton scattering for the spectral templates presented here does depend on atomic species, but we neglect the internal structure of the scattering atoms for the low-resolution templates discussed in this paper (see Furui et al. 2016 for a calculation that includes these effects). The Compton shoulder is computed for all fluorescent spectral lines. Although our models are calculated on an energy grid with resolution sufficient for modeling of X-ray spectra from high-resolution calorimeter instruments, early versions of Xspec tables used in this paper have limited photon statistics and therefore lower energy resolution, sufficient for NuSTAR and CCD-based spectroscopy (see the left panel of Figure 2). We compute spectral templates with a range of relative abundance of iron () between 1/10 and 10. Changing the iron abundance parameter results in a self-consistent modification of iron fluorescent line intensity and of the shape of the reprocessed continuum, which is affected by the change in the total photoelectric cross-section. An example is given in the right panel of Figure 2.
2.2 Xspec Table Model borus02
The grid of spectral templates computed using BORUS in the particular geometry shown in Figure 1 is named borus02. The covering factor of the torus, as seen from the X-ray source in the center, is simply related to the half-opening angle of the torus, , as . We note that this equality holds as long as clouds take up most of the torus volume; in cases where the space between dense clouds dominates the volume of the putative torus, the relation is more complicated (see, e.g., Nenkova et al. 2008). Angles and (inclination) both increase away from the axis of symmetry of the torus. We calculate the spectral templates for covering factors at 10 points equally spaced in . The minimal and maximal values of , corresponding to the covering factors of 100 % and 10 %, are zero and , respectively. The output of the radiative transfer simulation is arranged so that exit angles of each photon are separated into 10 bins in , each with a width of 0.1. The centers of the first and the last bins are at equal to 0.05 and 0.95, which corresponds to inclination angles of and , respectively. Note that corresponds to a pole-on and corresponds to an edge-on view. Azimuthal angles are averaged over because of axial symmetry.
We utilize the additive table model option available in Xspec to enable fitting our parametrized grid of spectral templates to X-ray data. The FITS-format tables containing the spectra for the full range of parameters are named borus02_vYYMMDDx.fits, where YYMMDD stand for the release date, and x marks a particular table version. For simplicity and convenience, we also make available versions of tables with a reduced number of parameters, with parameters in different units (, , or their cosines), and with only line or only continuum emission.666In particular, the borus01_vYYMMDDx.fits models represent a spherical absorber (covering factor fixed at unity, which is included in borus02 tables). It can be directly compared to the Brightman & Nandra (2011) model with the uniform sphere geometry (Xspec table sphere0708.fits), and the plcabs model (Yaqoob, 1997), which is a limited analytic approximation of radiative transfer in the same geometry. Note that the table naming scheme corresponds to a wider set of torus geometries computed using BORUS, but not discussed in this paper. The photon statistics of tables dated 170323, which we use for fitting examples in § 3, are sufficient for analysis of NuSTAR data and medium-quality CCD-based soft X-ray spectra (FWHM 130 eV), as shown in Figure 2. Their use on the highest-quality soft X-ray data or X-ray grating spectra (FWHM 130 eV) is not recommended; future versions, however, will be adequate for such analyses. All borus02 tables contain only the spectral components arising from reprocessing in the torus. The angular function of the transmitted line-of-sight component would be just a step function in the geometry assumed for this model. Such a component can be represented adequately by line-of-sight extinction models already available in Xspec.
In the set of spectral templates presented in this paper, the intrinsic continuum is assumed to be a power law with an exponential cutoff, . The photon index () can be varied between 1.4 and 2.6, and the high-energy cutoff () has a range between 20 keV and 2 MeV. Normalization of the intrinsic continuum follows the Xspec convention and is therefore defined in units of photons s-1 cm-2 keV-1 at 1 keV. These parameters can be linked to other basic spectral components in Xspec in order to construct a complete spectral model for fitting AGN X-ray spectra.
A basic model may be defined with the following command sequence in Xspec:
| m | ||||
In the expression above, c1 and c2 stand for instrument cross-normalization and the relative normalization of a leaked or scattered unabsorbed reflection of the intrinsic continuum, respectively. phabs accounts for foreground Galactic absorption, while zphabscabs represents line-of-sight absorption at the redshift of the X-ray source (generally independent from the average column density of the torus), including Compton scattering losses out of the line of sight.777The line-of sight absorption model phabs may be freely replaced with a more updated absorption model, such as tbabs (Wilms et al., 2000). Here we use phabs in order to consistently use elemental abundances adopted for calculation of the reprocessed spectra. The parameter of both zphabs and cabs needs to be the same in order to correctly account for total extinction along the line of sight. cutoffpl represents the intrinsic continuum, and its parameters should be linked to the , , and normalization parameters of the borus02 table.
We recommend formulating the model so that the borus02 table is the first additive component. In that case the allowed parameter range for and will be read from the table, ensuring that in parameter optimization Xspec will not step out of the limited parameter space. The model can also be used in a setup with line-only and continuum-only tables, e.g., when one wishes to measure the flux of those components separately. In that case, the atable term in the definition of an Xspec model given above should be separated into a sum of the line and continuum components, with all their parameters linked.
The line-of-sight column density, , and the torus column density, , should generally not be linked – the main feature of our new table model is that the equality of these two quantities can be tested with the data. However, the user may still choose to make the assumption that in order to reduce the number of free parameters. For increased linearity of the parameter space, it is often better to use logarithmic units for , fitting for instead. Likewise, we recommend fitting for the torus covering factor, , and the cosine of the inclination angle, instead of fitting for and directly. Due to the likely complex landscape of the parameter space, the use of Markov chain Monte Carlo (MCMC) sampling or more advanced Bayesian methods (Buchner et al., 2014) should be preferred over the straightforward minimization with many free parameters. In order to facilitate the application of our new Xspec table model to X-ray data, in § 3 we present a two-step approach demonstrated on four AGN with NuSTAR data of different quality.
2.3 Direct Comparison with BNtorus
In this section we highlight the differences between our new set of X-ray spectral templates and the frequently used, publicly available Xspec table model BNtorus. The physics of radiative transfer employed in both calculations is nearly the same; the BORUS code is more versatile in terms of geometry, operates at higher energy resolution, and takes into account a greater number of atomic species and their fluorescent lines. For borus02 we adopted the same approximately toroidal geometry assumed in calculating the BNtorus spectral templates, at least in principle.
As Liu & Li (2015) recently pointed out, there is significant disagreement between BNtorus and their simulations for the same geometry. Their ctorus model qualitatively agrees with MYtorus and etorus models, although direct comparisons are not straightforward due to different assumed geometries (see the Appendix for more details). These models, as well as previous calculations by Ghisellini et al. (1994) and Krolik et al. (1994), suggest that BNtorus produces a significant excess of soft X-ray flux at nearly edge-on inclination. A comparison of BNtorus spectra to our new calculations (see Figure 3) confirms such a discrepancy. We trace the problem back to an error in the original calculation of the BNtorus model.
The issue with the Brightman & Nandra (2011) calculation arises from absorption not being applied to the reprocessed light emitted from the inner side of the torus (the side opposite the observer). All obscured sightlines are affected by this to some degree. The photon path shown with white dashed lines in Figure 1 exemplifies the issue: by error, photons scattered toward an edge-on observer at point C (near the inner surface of the torus) reach the observer without any further absorption or scattering. In the assumed geometry, these photons should additionally interact with the torus material between points D and E. As a result of the missing absorption, within the BNtorus model there is very little difference in the spectral shapes of reprocessed components for pole-on and edge-on inclinations.
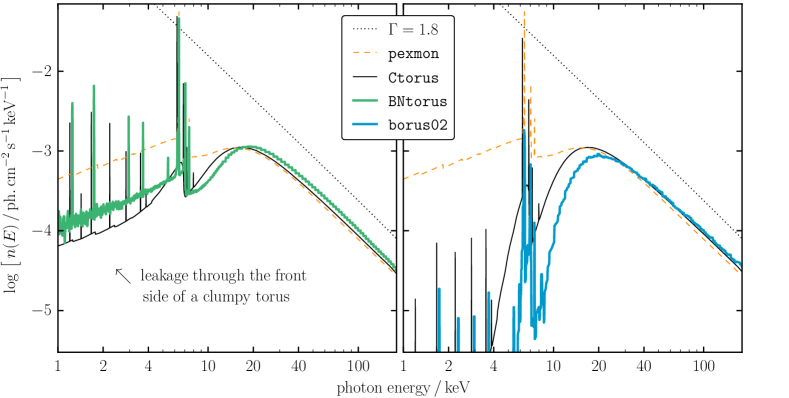
The disagreement between BNtorus and our new calculation is demonstrated in Figure 3. In order for the reprocessed component to dominate below 30 keV, we compare model spectra for . The BNtorus spectrum shows an excess of soft X-ray flux (20 keV), which should be heavily absorbed for an edge-on view of a uniform-density torus. We further compare the spectra to the clumpy ctorus model, which features the average number of clouds along and equatorial line of sight (, ranging from 2 to 10) as a free parameter. For , it emulates a torus sparsely populated with clouds, which results in less absorption and scattering on the side of the torus closer to the observer. In the other extreme, for , the torus volume is filled out more and therefore more similar to a uniform-density torus. The former situation matches BNtorus well, while the latter is closer to borus02. Figure 3 shows the difference only for ; for higher and lower , the differences are more and less severe, respectively.
While BNtorus does not correctly reproduce spectra for the geometry described in Brightman & Nandra (2011), it may approximate spectral features produced by the more general and more realistic class of clumpy tori. In the example given in Figure 1, the photon path passes the cross-section of the torus (between points D and E) through a region with no clouds. This is a physically plausible scenario in which photons emitted from the inner side of the torus would be able to escape unimpeded toward an edge-on observer. The inner-side reprocessed component, which shows some similarity to that reproduced by BNtorus (see Figure 3), could in principle be directly observable through the front side of the torus as long as the gas distribution is not uniform, i.e., is clumpy. Evidence that this is a possible, if not likely, scenario in AGN is abundant from detailed spectroscopy (e.g., Arévalo et al. 2014, Baloković et al. 2014, Annuar et al. 2015) and studies of line-of-sight absorption variability (e.g., Risaliti et al. 2002, Torricelli-Ciamponi et al. 2014, Markowitz et al. 2014). A more detailed, quantitative assessment of the error introduced by BNtorus, which could lead to deducing a correction factor for existing results, is a complex task, and will be the aim of future work.
In addition to resolving the issue of missing absorption, borus02 supersedes BNtorus with additional features that make it significantly more flexible. Separation of the line-of-sight and reprocessed components is not possible with BNtorus. This limits its application only to AGN for which it is justified to assume that the line-of-sight column density () is equal to the average column density of the torus (). With borus02 one can self-consistently model multi-epoch data assuming that the varies, while does not, as observed in many AGN with multi-epoch X-ray data (e.g., Marchese et al. 2012, Braito et al. 2013, Ricci et al. 2016). This important feature allows us to test commonly made assumptions regarding and , and to more directly probe the structure of AGN obscuration. Furthermore, borus02 includes the high-energy cutoff () and the relative abundance of iron () as additional model parameters. They enable complex spectral models to be used with a greater degree of self-consistency. These parameters will also make it possible to include torus reprocessing components in spectral models of AGN in which these parameters appear to have extreme values (e.g., Brenneman et al. 2011, Kara et al. 2015, Xu et al. 2017).
3 Examples of Application for
Fitting Hard X-ray Spectra
In order to demonstrate the usage and potential of our model, we choose four AGN observed with NuSTAR: 3C 390.3, NGC 2110, IC 5063 and NGC 7582. This is by no means a complete or representative sample – the targets are primarily chosen for the diversity of their physical properties. 3C 390.3 is a broad-line radio galaxy (a radio-loud type 1 Seyfert), IC 5063 is a radio-loud type 2 Seyfert, and NGC 2110 and NGC 7582 are radio-quiet type 2 Seyferts. Except for IC 5063, which is part of a large sample presented in B18 (as are NGC 2110 and NGC 7582), detailed spectral analyses of the NuSTAR spectra of these sources have already been published: 3C 390.3 by Lohfink et al. (2015), NGC 2110 by Marinucci et al. (2015) and NGC 7582 by Rivers et al. (2015). In the case of NGC 7582, we additionally include a new NuSTAR observation taken in 2016 (obsID 60201003002), which has not yet been published elsewhere. The reader is referred to the references listed above for the description of the observations, data processing procedures, and spectral analyses using spectral models commonly employed in the literature. For simplicity, in this paper we choose to use only the NuSTAR data (3–79 keV) for fitting our model.
We performed spectral analyses in Xspec, fitting FPMA and FPMB spectra simultaneously, without coadding. Our basic model is defined as in § 2.2, but with the factor c2 (relative normalization of the secondary continuum) fixed to zero, and fixed to 300 keV, unless explicitly stated otherwise. Parameter optimization is based on the statistic. We use 5 % as the threshold in null-hypothesis probability (; the probability of the observed data being drawn from a particular model, given its and the number of degrees of freedom) for a model to be formally acceptable as a good representation of the data; i.e., models with % are rejected. We quote uncertainties on the fitted model parameters based on marginalized probability distributions derived from converged MCMC chains produced with the built-in Goodman & Weare (2010) MCMC algorithm in Xspec. Uncertainty is quoted as the interval containing 68 % of the total probability, equivalent to 1 uncertainty. When this interval includes the edge of the finite parameter domain, we quote a 1 constraint, so that 84 % of the total probability is enclosed (conversely, 16 % is left out). We verified that the best-fit parameters are always within the uncertainty interval, although they often do not exactly match the distribution medians.
In § 3.1 we first present results based on a single epoch of NuSTAR data for each source (the first epochs for NGC 2110 and NGC 7582). However, single-epoch spectral fits may be biased by the temporary increase or decrease of the intrinsic continuum that is not accompanied by a corresponding change in the reprocessed component due to the extended nature of the torus. In § 3.2 we show how single-epoch constraints may be influenced by variability, and discuss how multi-epoch X-ray data and some justifiable assumptions can be leveraged to derive more robust self-consistent constraints and assess possible systematics.
3.1 Single-epoch Constraints on the Torus Parameters
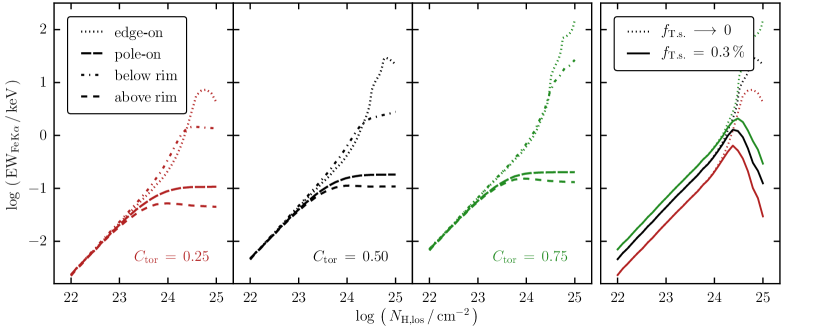
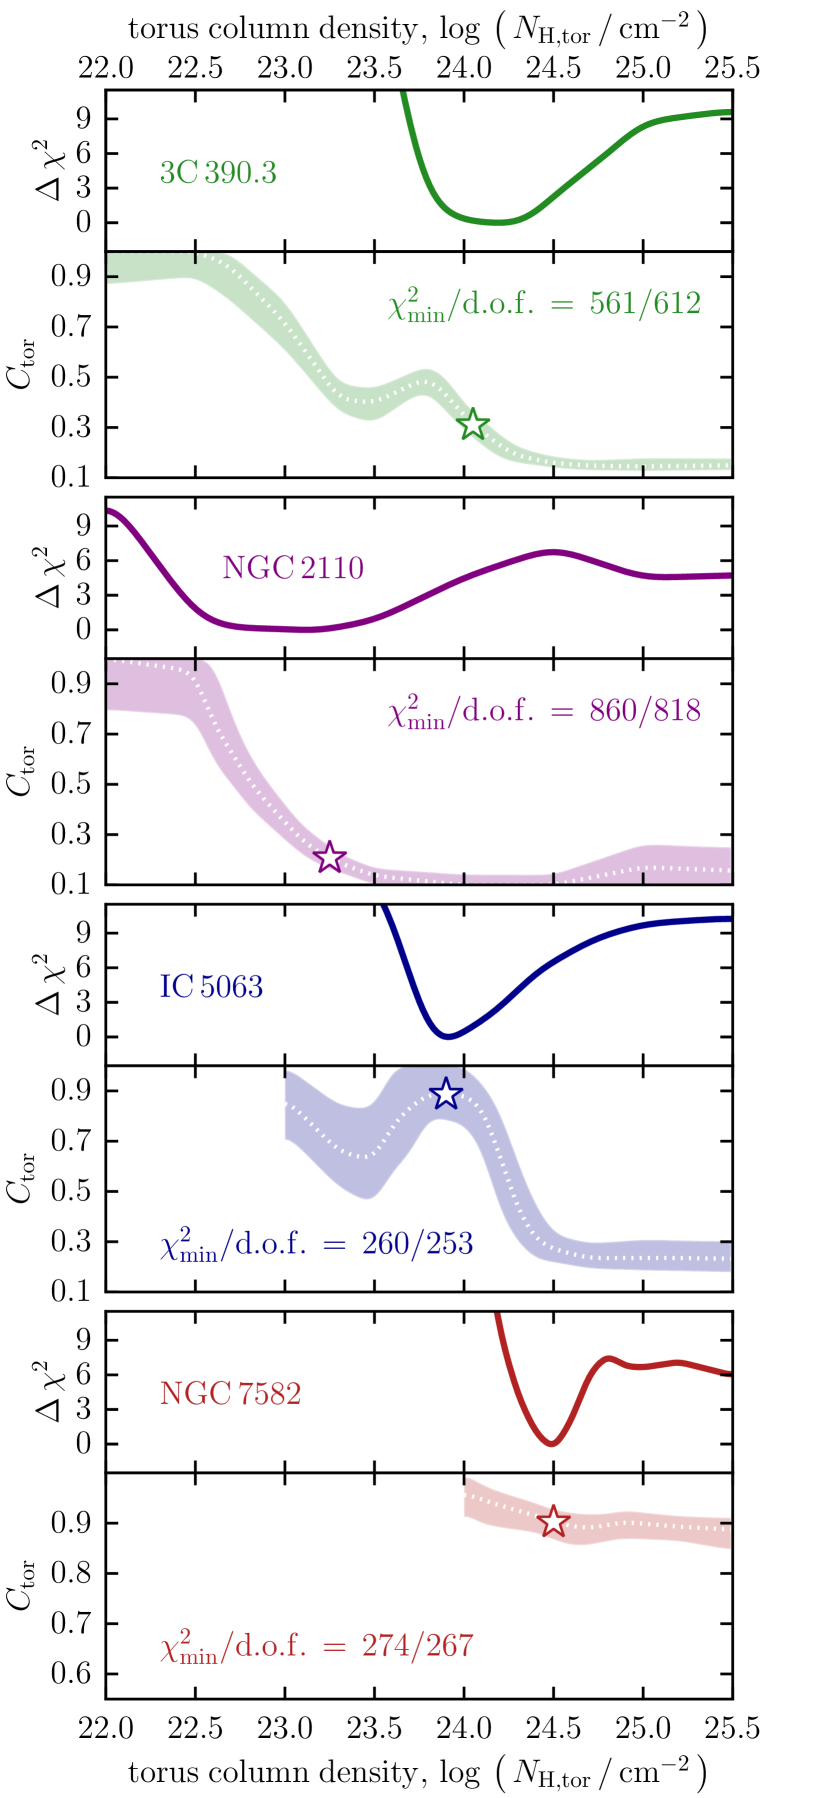
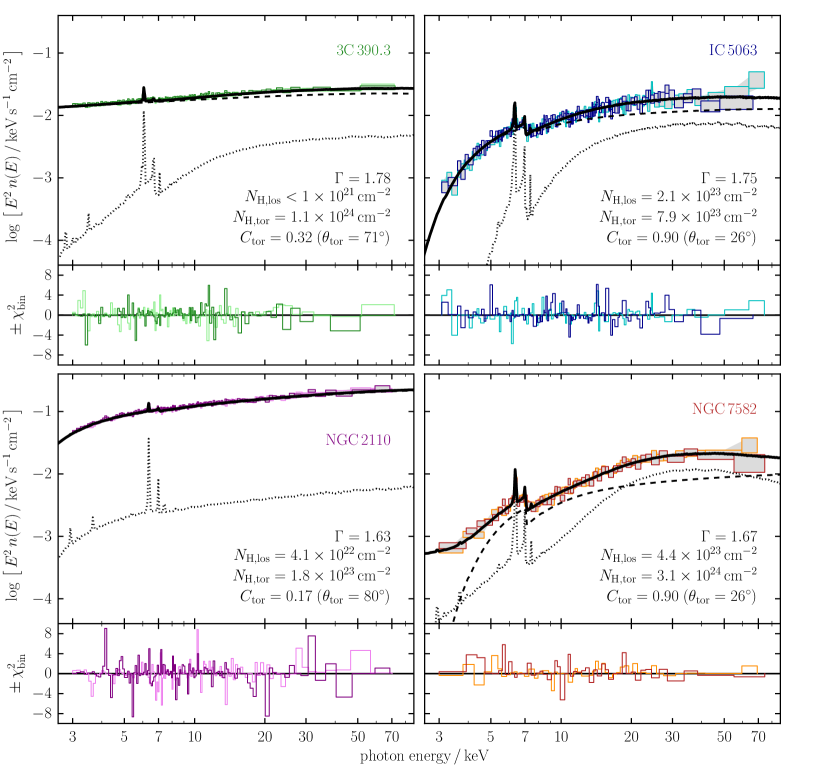
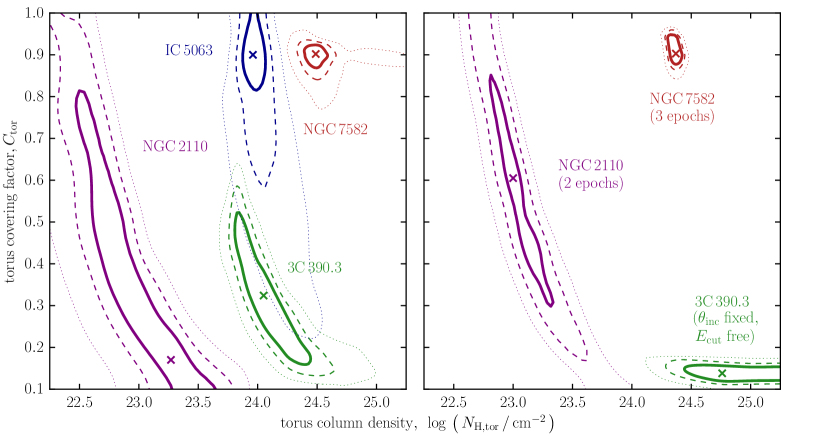
We first run a set of fits with the parameter kept fixed in order to determine whether any assumptions on this parameter result in statistically unacceptable solutions (i.e., %). The pairs of panels in Figure 4 show the constraints on for a range of assumed values of , and the associated curve. Other model parameters are left free to vary in these fits. Spectral models for each of the sources are shown in Figure 5. In Figure 6 we show two-dimensional constraints on and , where is also left free to vary in the fit.
3.1.1 3C 390.3
The unobscured 3C 390.3 is our simplest example, since the lack of line-of-sight absorption in the NuSTAR band allows us to set to zero. The top two panels in Figure 4 show that a good fit can be found for any assumed , but that there is a clear minimum in around the best fit at cm-2. For the best fit, for 612 degrees of freedom (d.o.f.). This model is shown in the top left panel of Figure 5; the flat residuals suggest that all features in the data are accounted for by this spectral solution. With fixed at the best-fit value, we find . The inclination angle is constrained to , so that our line of sight does not intercept any of the reprocessing material, consistent with the type 1 optical classification of 3C 390.3. Figure 6 shows the probability density distribution in the two-dimensional plane spanned by and , obtained from a fit in which is left free to vary. In this case, the covering factor constraint is slightly broader: . The possibility that the reprocessed component is due to the accretion disk rather than the torus is discussed in § 3.2.2.
3.1.2 NGC 2110
NGC 2110 is mildly obscured by cm-2, which is detectable as an exponential roll-off of the power-law continuum () at the lower end of the NuSTAR band. Its spectrum is remarkably featureless, except for a narrow Fe K line with an equivalent width of eV. Stepping through the range of between 22.0 and 25.5 we find that acceptable model include tori with very small covering factors, for , as well as tori with high covering but low . The difference in the best-fit over the whole range is very small (, for 819 d.o.f.). A broad minimum in at covers nearly the full range of covering factors (0.1–1.0). The best fit, with d.o.f., is found for . With fixed at this value, and . The lower left pair of panels in Figure 5 show this model and the residuals. Note that a number of narrow, isolated bins contribute substantially to the total without corresponding to any real but unmodeled spectral features. With as a free parameter in the fit, the constraints are much broader, as shown in Figure 6. The probability density distribution in the – plane is highly elongated and reaches and within 1 contours. No constraint on inclination can be given in this case.
3.1.3 IC 5063
Partly due to higher line-of-sight absorption in comparison with 3C 390.3 and NGC 2110, the NuSTAR data for IC 5063 have the constraining power to reject a part of the parameter space on statistical grounds, despite lower photon statistics. As the third pair of panels in Figure 4 shows with the lack of constraints for cm-2, no model with % can be found for a lower torus column density. as a function of has a minimum (d.o.f.) around . With fixed at this value, and . This model is shown in the upper right panels of Figure 5. Fitting for the torus column density, we find that it is very well constrained, , and that there is almost no degeneracy with the covering factor. Unlike the cases of 3C 390.3 and NGC 2110, the contours in the – plane are elongated along the axes, predominantly vertically. Constraints on and are therefore no different than those obtained with fixed. With a high and near the CT threshold, the reprocessed component contributes % of the flux in the 10–50 keV band.
3.1.4 NGC 7582
NGC 7582 exhibits the most complex X-ray spectrum of the AGN discussed here. Its is known to be variable and multiple layers of absorption have been invoked in previous spectral analyses (Rivers et al., 2015). We find it necessary to include a non-zero parameter c2 (as defined in § 2.2) in order to account for partial absorption along the line of sight; without it, the residuals show a significant excess below 4.5 keV. For the first NuSTAR observation considered here, under different assumptions for , we always find consistent with cm-2 and c (i.e. % line-of-sight covering, or % Thompson-scattered fraction). The 3–15 keV continuum is dominated by the transmitted component, while the Compton hump dominates in the 15–60 keV range (see the lower right panels of Figure 5). Stepping through the parameter space we first find that no models with are acceptable according to our % threshold. The curve shown in the lowest pair of panels in Figure 4 shows a very well defined minimum at . At this , both and are narrowly constrained to . Additionally fitting for the torus column density yields , and does not affect the other model parameters. NGC 7582 therefore seems to have a CT torus that covers % of the sky as seen from the SMBH, yet we observe it through a hole with roughly an order of magnitude lower column density. We further test this result with additional data in the following section, and discuss its interpretation in § 4.
3.2 Additional Constraints and Considerations
3.2.1 Line-of-sight and Torus Column Density
The flexibility of borus02 allows us to test the common assumption that the line-of-sight column density matches the average column density of the torus. For 3C 390.3 and NGC 7582, with and , respectively, this assumption cannot yield a good fit for any combination of other model parameters. Both AGN clearly require presence of CT material out of our line of sight. This is not necessarily true for IC 5063 and NGC 2110, since statistically acceptable models with % can be found for both AGN. For NGC 2110, such a solution ( , ) is within the 1 contour for the single epoch constraints shown in Figure 6, and within the 3 contour based on two epochs. Fitting the IC 5063 data with the assumption that increases with respect to the fit featuring independent column densities () and results in . In this case, we also find , which implies a harder intrinsic continuum than the bulk of local Seyferts (for which the distribution of is roughly Gaussian with a mean 1.8 and standard deviation 0.2; e.g., Dadina 2008, Rivers et al. 2013, B18), unlike obtained in § 3.1.
3.2.2 Additional Spectral Parameters and Components,
and External Constraints
Model parameters (the high-energy cut-off in the intrinsic continuum) and the (relative abundance of iron) have been kept constant in the analysis thus far. However, letting these parameters vary in the fitting does not lead to significantly better fits, while it does result in additional degeneracy, i.e., in poorer constraints on other model parameters. The data considered in this paper do not show preference away from the assumed values keV and . The largest deviations we find are / for NGC 7582, which does not shift other parameters by more than their 1 uncertainties, and keV for 3C 390.3, which indicates a minor shift in the torus parameters ( and ). However, the decrease in with respect to the fixed values is too small to consider these features significant (). Note that this was not the case in the analysis of Lohfink et al. (2015), where the reprocessed continuum was assumed to have a different spectral shape.
Because 3C 390.3 is a powerful radio galaxy, the orientation of its jet can be measured in order to better constrain the inclination (e.g., Alef et al. 1988). Assumption of co-alignment can then be employed to infer the inclination of the accretion disk and the torus. Based on this and constraints from other measurements, which yield similar values (e.g., Flohic & Eracleous 2008), Dietrich et al. (2012) found that the inclination of the symmetry axis of the AGN to our line of sight is degrees. If we fix the inclination and perform the fitting with free to vary, we obtain and . While these constraints still marginally overlap with those obtained with as a free parameter, the two-dimensional probability distribution is shifted appreciably toward higher and lower . In Figure 6, we show this as an example of how different assumptions may systematically shift constraints on the torus parameters.
As 3C 390.3 is a type 1 AGN, we also tested its spectrum for the presence of relativistically broadened reprocessing in the innermost part of the accretion disk by adding a relxill component (García et al., 2014) to our Xspec model. Over a variety of assumptions for the parameters of the relxill component, which we kept constant and consistent with the analysis of Lohfink et al. (2015), we find that its contribution to the iron line emission and the Compton hump is always sub-dominant. In all cases, is found to be consistent within 2 with the region outlined by contours in the two panels of Figure 6. This brief analysis indicates that the reprocessed component is dominated by material which may have a disk-like geometry, but is located at distances not affected by general relativistic effects. We agree with the analysis of Lohfink et al. (2015), which made use of Suzaku data with higher energy resolution, and only found evidence for distant reprocessing without any relativistically broadened features.
3.2.3 Multi-epoch X-ray Data
NGC 2110 and NGC 7582 have been observed with NuSTAR two and three times, respectively.8883C 390.3 has formally been observed twice, but because those observations are consecutive, we treat them as a single observation here. The advantage of multi-epoch observations is that the effects of variability in luminosity or other spectral components can be taken into account self-consistently. AGN are known to vary in luminosity of the intrinsic continuum down to very short timescales. However, the torus is expected to be a parsec-scale structure and hence the reprocessed spectral components cannot follow fast changes in the intrinsic continuum. The reprocessed components should therefore be normalized not with respect to the intrinsic continuum luminosity within a given observation, but with respect to the average luminosity. Multiple observations provide additional photon statistics that reduce statistical uncertainties, and they also provide a better estimate of the average, rather than instantaneous intrinsic luminosity of the AGN.
For NGC 2110, a joint fit of two epochs yields results similar to those from our single-epoch analysis in § 3.1, with , , and no constraint on . The two-dimensional probability distributions shown in Figure 6 seem marginally inconsistent with each other. However, it must be noted that the two-epoch analysis is significantly more robust; not only does it have better photon statistics, but it also avoids the erroneous normalization of the reprocessed components with an intrinsic continuum that is atypically luminous.
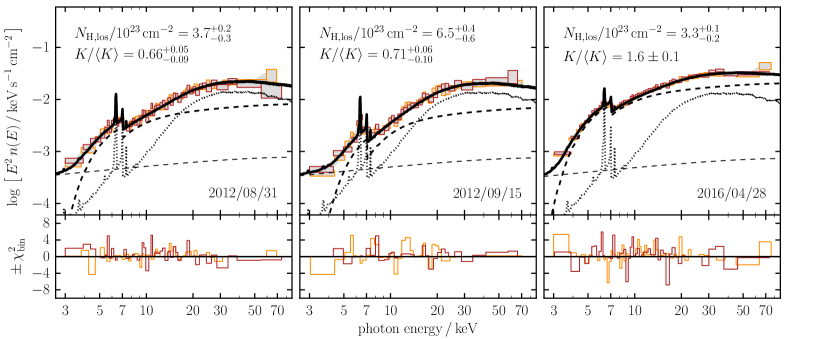
In addition to the variability of the intrinsic continuum luminosity, some AGN, like NGC 7582, also vary in the line-of-sight column density. In modeling multiple epochs of observation of such an object, we therefore allow for to be fitted to each observation in addition to the intrinsic continuum amplitude. We assume that a good representation of the average intrinsic continuum luminosity, which sets the normalization of the reprocessed components, is provided by the average of continuum luminosities between the three observations. We found no evidence that the photon index changed between observations, while and intrinsic continuum amplitude did.
We show our best-fit spectral model for NGC 7582 in all three epochs of NuSTAR observations in Figure 7. Each of the three panels lists and the continuum normalization with respect to the mean (). It is worth noting that in the first two epochs the Compton hump dominates the 15–60 keV band, while in the third epoch the increased intrinsic continuum dominates instead. This self-consistent three-epoch fit confirms our torus constraints from § 3.1, and makes them even tighter: , , and . Interestingly, Rivers et al. (2015) have already found tentative evidence for a covering factor of 80–90 % and torus column density of cm-2 using MYtorus. This was estimated from the normalization ratio of the intrinsic and the reprocessed continuum components when MYtorus was used in its decoupled configuration.
4 Discussion
4.1 New Tool for Studying the AGN Torus
In recent years, MYtorus, BNtorus, and, to a more limited extent, the torus model by Ikeda et al. (2009), have been used to probe the basic parameters of AGN tori—their average column densities () and covering factors ()—from the hard X-ray band. The average column density can be estimated using the MYtorus model assuming its particular geometry with a fixed 50 % covering factor (e.g., Braito et al. 2013, Baloković et al. 2014, Yaqoob et al. 2015), and the covering factor can, in some cases, be estimated by giving up its self-consistency (e.g., Rivers et al. 2015). BNtorus has been used to provide covering factor estimates in previous studies (e.g., Gandhi et al. 2014, Brightman et al. 2015, Koss et al. 2015); they may need reassessment in the light of issues with missing absorption that we discussed in § 2.3, which we leave for future work. Our new model is the only reliable publicly available tool for constraining the torus covering factor from X-ray data, as long as the approximation of a uniform density torus reasonably represents physical reality.
More complex torus models will become available in the near future (e.g., Liu & Li 2014, Furui et al. 2016, Paltani & Ricci 2017), motivated by the high energy resolution of X-ray calorimeters. The borus02 table used in this paper (version 170323a) is limited to low energy resolution by photon statistics. While this is sufficient for fitting NuSTAR data (see Figure 2 for an example), it is inadequate for analyses of the highest-quality CCD-based spectra or X-ray grating spectroscopy; however, future versions will feature better photon statistics and enable analyses with higher energy resolution.
As an updated and extended version of the already popular BNtorus model, borus02 may be an effective tool for better understanding the relation between new results and those already in the literature. The BORUS radiative transfer code, on which our borus02 spectral templates are based, is a versatile tool for investigating the observable effects of torus geometry and clumpiness in the X-ray band in future studies (Baloković et al., in prep.). The parametrization of geometry adopted for borus02 was chosen in particular to match the BNtorus model, in order to extend its flexibility and enable more detailed studies of torus parameters in a wider population of AGN than previously possible.
In terms of additional model parameters, borus02 tables include the high-energy cutoff and the relative abundance of iron. More importantly, it combines the features of both BNtorus and MYtorus by having a variable covering factor, as well as the reprocessed component separated from the transmitted (absorbed) component. The line-of-sight column density therefore does not need to be assumed equal to the average over the whole torus; this common assumption can be tested with the data. This important feature enables self-consistent modeling of the torus for both unobscured and obscured AGN, including those showing variability in . The clumpy torus scenario in which and generally differ is supported by the NuSTAR data in the fitting examples presented in § 3, as well as the literature.
4.2 Interpretation of Fitting Results
In interpretation of the results from spectral analyses employing borus02 tables, one needs to keep in mind that the uniform-density torus is just an approximation of a non-uniform (clumpy) distribution of matter around the SMBH. This idea is illustrated in Figure 1. We note that in cases where the torus cannot be approximated well with a smoothed distribution of clouds, such as when ”holes” in the putative torus are much larger than individual clumps, our model may not be appropriate for constraining the covering factor. We believe our choice of geometry for borus02 is a reasonable approximation based on the results in the literature; however, its assumptions will need to be tested with models assuming more complex geometries in the future. It is possible to define a covering factor (e.g., fraction of the sky covered with column density above some threshold, as seen from the SMBH at the center) and a typical column density (e.g., average over all obscured sightlines to the SMBH) for a wide variety of possible geometries. For any torus, the line-of-sight column density () can differ widely depending on its orientation with respect to the observer at a given time. Parameters and therefore provide information on the material outside of our line of sight.
In the paradigm described above, it is not difficult to understand how the tori in NGC 7582 and IC 5063 can simultaneously have a high and in the CT regime, without CT absorption in the line of sight. NGC 7582 may have a clumpy torus with cm-2 clumps covering 20 % of the sky and the rest covered with cm-2, which averages to cm-2, in agreement with our modeling in § 3. This configuration can explain the previously observed CT state, as well as the average line-of-sight column density (see Rivers et al. 2015 for a summary of previous X-ray observations of NGC 7582). Our modeling also constrains the inclination so that , implying that we are viewing at the torus close to its edge. In the uniform torus model, reprocessed emission from the inner side of the torus can only be observed for , but a clumpy torus would have such lines of sight even for (see Figure 1 and Figure 3). Constraints on from fitting borus02 should be interpreted in relation to , rather than in absolute terms.
The NuSTAR data robustly exclude the possibility that the torus in 3C 390.3 has a high covering factor; with , its reprocessed component may simply be due to the outer part of the accretion disk. The NGC 7582 torus is unlikely to be ring-like ( ) or even disk-like ( ). In § 3.2.1 we presented fitting results for NGC 2110 and IC 5063 under the assumption that , which yields acceptable, though not preferred, models for their NuSTAR spectra. With this assumption, the NGC 2110 torus appears to be sphere-like but has two orders of magnitude lower average column density than the CT torus of NGC 7582. The torus in IC 5063 fits in between the other three, with its likely high covering factor and borderline CT average column density. This is already a step forward in testing the common assumption that all Seyfert-like AGN possess essentially the same kind of a torus.
We stress that the constraints presented in this paper are based on NuSTAR data alone, and can therefore be significantly improved in more detailed studies in the future. The data used for demonstration in this study are representative of a long NuSTAR observation in the case of 3C 390.3 (100 ks), a short snapshot observation of a very bright AGN in the case of NGC 2110 (20 ks, but with photon statistics typical of a long exposure on an typical local Seyfert), and short observations of IC 5063 and NGC 7582, characteristic of the NuSTAR snapshot survey of the Swift/BAT-selected AGN (B18). Inclusion of good-quality soft X-ray data, as well as self-consistently modeled additional epochs, can help constrain the torus parameters even further (see Yaqoob et al. 2015 and Guainazzi et al. 2016, for the case of Mrk 3 without and with NuSTAR data, respectively). We anticipate that many such studies will be done within the operational lifetime of NuSTAR.
4.3 Implications for Previous Results Based
on Phenomenological Models
Despite the availability of empirically motivated torus models in recent years, a large fraction of the literature, and especially studies of large AGN samples, made use of disk reprocessing models such as pexrav to approximate the torus contribution to AGN spectra. The spectral fitting examples presented in § 3 already suggest a natural explanation for the very low Compton hump strengths measured using pexrav in some AGN (notably, radio galaxies; Ballantyne 2007, Tazaki et al. 2011). Very strong non-relativistic reprocessing signatures have been observed both in stacked hard X-ray data (Malizia et al. 2003, Ricci et al. 2011, Esposito & Walter 2016) and in spectral analyses of particular AGN (e.g., Rivers et al. 2013, Vasudevan et al. 2013, B18). Within our model, scaling of the Compton hump amplitude and shape corresponds to scaling of the torus covering factor.
The moderate strength of the narrow iron lines and the absence of a correspondingly strong Compton hump at the same time can be explained simply as a ring-like torus with CT column density and a low covering factor, such as in the case of 3C 390.3. The Compton hump in that case is weaker and broader than in the pexrav model, leading to a low normalization of the reprocessed component, as often found in the literature (e.g., Sambruna et al. 2009, Ballantyne et al. 2014, King et al. 2017). Conversely, AGN with strongly peaked Compton humps may feature sphere-like tori with high covering factors, as demonstrated by NGC 7582. However, the shape and strength of the Compton hump also scale with the torus column density, making the correspondence non-trivial in general.
In the lower panel of Figure 8 we show an indication of a correlation between relative normalization of the pexrav continuum (; taken from B18 and Lohfink et al. 2015) and the torus covering factor modeled in this work. In fact, the correlation may be stronger if all tori are assumed to have cm-2 (fixed), which effectively makes account for part of the spectral diversity that would otherwise be accounted for by differences in . Given the broad constraints for the non-CT torus in NGC 2110 and the fact that other choices of fixed weaken the observed trend, we refrain from further quantifying this relationship. A comprehensive comparison of covering factors and parameters for a large sample of NuSTAR-observed AGN will be presented in B18. We do stress that, in spite of the historical importance of models such as pexrav, we expect that the community will make a point of moving away from these outdated models in favor of models such as borus02.
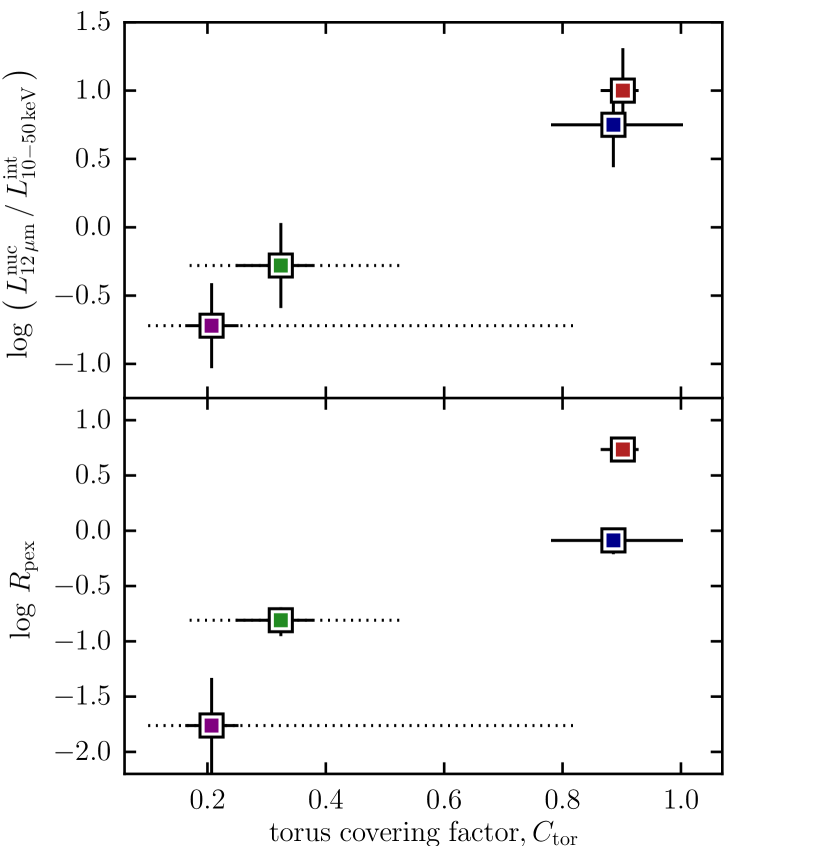
4.4 Comparison with Constraints from Infrared Data
Through a simple energetics argument, the covering factor of the dusty torus can be related to the ratio of reprocessed, infrared luminosity to the intrinsic UV or X-ray luminosity (as a proxy of the bolometric output). Naively, a larger covering factor results in more intrinsic luminosity being intercepted, absorbed and re-radiated by the torus in the infrared. In the top panel of Figure 8, we use high spatial resolution 12-m photometry from Asmus et al. (2014) and 10–50 keV intrinsic luminosities based on NuSTAR data (measured from our best-fit models with removed absorption and reprocessed continuum) to show a possible link between the luminosity ratio and the covering factor. The trend is encouraging, and calls for further investigation with larger samples (e.g., Lanz et al., submitted). Recent calculations by Stalevski et al. (2016) suggest that this simple ratio may be effectively used as an indicator of the torus covering factor (e.g., in large surveys; Maiolino et al. 2007, Treister et al. 2008), provided that anisotropy of the disk and torus radiation is properly accounted for.
Models for fitting torus SEDs in the infrared band have been available for a long time (see, e.g., Netzer 2015 for a recent review). These models have been used extensively for constraining torus properties in bright local AGN, as well as higher-redshift sources (e.g., Efstathiou et al. 2013, Roseboom et al. 2013, Podigachoski et al. 2016), to the extent possible with limited unresolved photometry. Directly comparing our constraints to the results from Alonso-Herrero et al. (2011), we find that they are broadly consistent for all three AGN included in both studies, NGC 2110, IC 5063, and NGC 7582. In all three cases, infrared-derived covering factors are high, . Our constraint for IC 5063 is entirely consistent with this, as is for NGC 7582. The covering factor for NGC 2110 torus based on infrared data is nearly 100 %, which is an acceptable solution for the X-ray data, although the NuSTAR spectra indicate a preference for a lower value. Near-complete covering is obtained under the assumption that for both NGC 2110 and IC 5063. While Ichikawa et al. (2015) also find a high dust covering factor for NGC 2110 () from infrared SED modeling, Lira et al. (2013) find a significantly lower dust covering factor () for NGC 7582, in disagreement with Alonso-Herrero et al. (2011) and our apparently very tight X-ray constraint. Torus column densities are very different between these three AGN, and may be indicative of a different spatial scale or nature of the reprocessing material (i.e., compact, possibly clumpy, torus versus gas and dust in the host galaxy).
Despite the fact that most infrared SED models include a geometrical measure such as the torus opening angle or, equivalently, covering factor, it is unclear to what extent this is comparable to of the X-ray torus. Dust-free gas, which affects X-ray reprocessing while not contributing to thermal dust emission, is thought to exist in the innermost regions of typical Seyferts (e.g., in the broad-line region; Gaskell et al. 1981). Comparing X-ray and infrared size estimates, Gandhi et al. (2015) have found that the bulk of fluorescent emission of iron likely originates from within the dust sublimation radius. The dust/infrared and gas/X-ray covering factors may therefore naturally differ depending on the overall geometry of the SMBH surroundings. Our model will enable some of the first systematic comparisons between the gas covering factor from the X-ray band and the constraints on dusty torus geometry derived from infrared modeling for single sources with high-quality data on the one hand, and large samples with lower-quality data on the other.
4.5 Multi-wavelength Synergy in Future Studies
Thus far, only a small number of studies in the literature combine multi-wavelength probes of torus parameters with geometric constraints from high-quality hard X-ray spectroscopy; e.g., Bauer et al. (2015), Koss et al. (2015), Masini et al. (2016). In a recent study of the obscured quasar IRAS 091044109, Farrah et al. (2016) combined X-ray, optical and infrared data in order to construct a self-consistent picture of its torus. While the short NuSTAR observation (15 ks) did not provide constraints as tight as those derived from the infrared data, it is encouraging that both spectral bands independently yield results in agreement with optical (spectroscopic and polarimetric) and radio data. It would certainly be better to have an internally self-consistent model including both gas and dust distributions for spectra in both the infrared and X-ray bands; however, no such models have been published yet. In future work, BORUS will be used to construct grids of spectral templates that enable simultaneous fitting of both infrared and X-ray data, including those with high energy resolution from an instrument similar to Hitomi/SXS (Mitsuda et al., 2014), such as Athena/XIFU (Barret et al., 2016), and XARM.
Placing constraints on the geometrical and physical torus parameters for single objects is possible from optical, infrared and radio observations. Ionization cone opening angles can be constrained from optical observations with the high spatial resolution of the HST (e.g., Schmitt et al. 2003, Fischer et al. 2013), and may be expected to correlate to some degree with the torus opening angle. For IC 5063, Schmitt et al. (2003) found that the ionization cone has a half-opening angle of , and that it is aligned well with the jet observed at radio frequencies. The broad-line region of IC 5063 has been observed in polarized light (Inglis et al., 1993), indicating that it is present but hidden by intervening extinction. The torus geometry favored by our spectral modeling ( , , ) is remarkably consistent with these completely independent constraints.
Additional constraints from resolved ionization cone observations may be expected in the near future from Chandra and JWST (e.g., Maksym et al. 2016). Infrared photometry and spectroscopy at high spatial resolution (Ichikawa et al., 2015), interferometry (Burtscher et al., 2013) and polarimetry (Lopez-Rodriguez et al., 2015) have significantly contributed to recent advances in probing AGN structures. Molecular gas observations resolving the torus scales in nearby AGN with ALMA are able to probe torus kinematics (García-Burillo et al., 2016). Some radio observations directly measure the orientation of the AGN structures with respect to the observer (e.g., jet, megamaser disk), while others are more indirect and model-dependent (Marin, 2016). Compared to these more traditional probes, constraints from the X-ray band have thus far been poorly explored, but they show promise for unique new insights into the nature of the AGN torus in the near future.
5 Summary
With the recent improvement in hard X-ray data quality brought about by NuSTAR, and the flexible empirically motivated spectral models, measuring the torus covering factor from the X-ray band is now possible for large samples of AGN. In this paper we present a new set of parametrized spectral templates, named borus02, made available to the public in the form of an Xspec table model, in order to facilitate studies of the torus geometry through X-ray spectroscopy. In calculation of the model spectra we assumed an approximately toroidal geometry with conical polar cutouts, following the popular BNtorus model of Brightman & Nandra (2011). borus02 is an updated, expanded, and more flexible torus model that supersedes BNtorus.
Because borus02 represents only the reprocessed spectral component (separated from the line-of-sight component), while featuring both the average column density and the covering factor as free parameters, it is applicable to a wide variety of AGN. In order to highlight its capabilities, we presented its application on four AGN observed with NuSTAR. These four examples cover different parts of the parameter space spanned by the column density ( ) and the covering factor ( ). Furthermore, we demonstrated how inclusion of multi-epoch data, external constraints and various assumptions can help with evaluating or alleviating some systematic uncertainties.
Finally, we compared our constraints on the torus covering factor with dust covering factors derived from modeling of infrared data, and found encouraging consistency. More detailed work will be required in order to understand the relationship between constraints from different wavelength regimes in terms of a physical interpretation. When combined self-consistently, the joint leverage of these different probes of torus geometry and orientation (not limited only to X-ray and infrared spectral modeling) should enable us to better characterize the complex geometry of the unresolvable innermost region surrounding SMBHs, and replace the proverbial donut-like AGN torus with a more realistic structure.
References
- Aird et al. (2015) Aird, J., Coil, A. L., Georgakakis, A., et al. 2015, MNRAS, 451, 1892
- Akylas et al. (2016) Akylas, A., Georgantopoulos, I., Ranalli, P., et al. 2016, A&A, 594, A73
- Alef et al. (1988) Alef, W., Goetz, M. M. A., Preuss, E., & Kellermann, K. I. 1988, A&A, 192, 53
- Alonso-Herrero et al. (2011) Alonso-Herrero, A., Ramos Almeida, C., Mason, R., et al. 2011, ApJ, 736, 82
- Anders & Grevesse (1989) Anders, E., & Grevesse, N. 1989, Geochim. Cosmochim. Acta, 53, 197
- Annuar et al. (2015) Annuar, A., Gandhi, P., Alexander, D. M., et al. 2015, ApJ, 815, 36
- Antonucci (1993) Antonucci, R. 1993, ARA&A, 31, 473
- Arévalo et al. (2014) Arévalo, P., Bauer, F. E., Puccetti, S., et al. 2014, ApJ, 791, 81
- Arnaud (1996) Arnaud, K. A. 1996, in Astronomical Society of the Pacific Conference Series, Vol. 101, Astronomical Data Analysis Software and Systems V, ed. G. H. Jacoby & J. Barnes, 17
- Asmus et al. (2014) Asmus, D., Hönig, S. F., Gandhi, P., Smette, A., & Duschl, W. J. 2014, MNRAS, 439, 1648
- Assef et al. (2013) Assef, R. J., Stern, D., Kochanek, C. S., et al. 2013, ApJ, 772, 26
- Ballantyne (2007) Ballantyne, D. R. 2007, Modern Physics Letters A, 22, 2397
- Ballantyne et al. (2014) Ballantyne, D. R., Bollenbacher, J. M., Brenneman, L. W., et al. 2014, ApJ, 794, 62
- Baloković (2017) Baloković, M. 2017, PhD thesis, California Institute of Technology
- Baloković et al. (2014) Baloković, M., Comastri, A., Harrison, F. A., et al. 2014, ApJ, 794, 111
- Barret et al. (2016) Barret, D., Lam Trong, T., den Herder, J.-W., et al. 2016, in Proc. SPIE, Vol. 9905, Space Telescopes and Instrumentation 2016: Ultraviolet to Gamma Ray, 99052F
- Bauer et al. (2015) Bauer, F. E., Arévalo, P., Walton, D. J., et al. 2015, ApJ, 812, 116
- Berger & Hubbell (1987) Berger, M., & Hubbell, J. 1987, XCOM: Photon cross sections on a personal computer
- Boorman et al. (2016) Boorman, P. G., Gandhi, P., Alexander, D. M., et al. 2016, ApJ, 833, 245
- Braito et al. (2013) Braito, V., Ballo, L., Reeves, J. N., et al. 2013, MNRAS, 428, 2516
- Brenneman et al. (2011) Brenneman, L. W., Reynolds, C. S., Nowak, M. A., et al. 2011, ApJ, 736, 103
- Brightman & Nandra (2011) Brightman, M., & Nandra, K. 2011, MNRAS, 413, 1206
- Brightman et al. (2015) Brightman, M., Baloković, M., Stern, D., et al. 2015, ApJ, 805, 41
- Buchner & Bauer (2017) Buchner, J., & Bauer, F. E. 2017, MNRAS, 465, 4348
- Buchner et al. (2014) Buchner, J., Georgakakis, A., Nandra, K., et al. 2014, A&A, 564, A125
- Buchner et al. (2015) —. 2015, ApJ, 802, 89
- Burlon et al. (2011) Burlon, D., Ajello, M., Greiner, J., et al. 2011, ApJ, 728, 58
- Burtscher et al. (2013) Burtscher, L., Meisenheimer, K., Tristram, K. R. W., et al. 2013, A&A, 558, A149
- Dadina (2008) Dadina, M. 2008, A&A, 485, 417
- Dietrich et al. (2012) Dietrich, M., Peterson, B. M., Grier, C. J., et al. 2012, ApJ, 757, 53
- Efstathiou et al. (2013) Efstathiou, A., Christopher, N., Verma, A., & Siebenmorgen, R. 2013, MNRAS, 436, 1873
- Elvis (2000) Elvis, M. 2000, ApJ, 545, 63
- Esposito & Walter (2016) Esposito, V., & Walter, R. 2016, A&A, 590, A49
- Ezhikode et al. (2017) Ezhikode, S. H., Gandhi, P., Done, C., et al. 2017, MNRAS, 472, 3492
- Fabian (2012) Fabian, A. C. 2012, ARA&A, 50, 455
- Farrah et al. (2016) Farrah, D., Baloković, M., Stern, D., et al. 2016, ApJ, 831, 76
- Fischer et al. (2013) Fischer, T. C., Crenshaw, D. M., Kraemer, S. B., & Schmitt, H. R. 2013, ApJS, 209, 1
- Flohic & Eracleous (2008) Flohic, H. M. L. G., & Eracleous, M. 2008, ApJ, 686, 138
- Fukazawa et al. (2011) Fukazawa, Y., Hiragi, K., Mizuno, M., et al. 2011, ApJ, 727, 19
- Furui et al. (2016) Furui, S., Fukazawa, Y., Odaka, H., et al. 2016, ApJ, 818, 164
- Gandhi et al. (2015) Gandhi, P., Hönig, S. F., & Kishimoto, M. 2015, ApJ, 812, 113
- Gandhi et al. (2014) Gandhi, P., Lansbury, G. B., Alexander, D. M., et al. 2014, ApJ, 792, 117
- Gandhi et al. (2017) Gandhi, P., Annuar, A., Lansbury, G. B., et al. 2017, MNRAS, 467, 4606
- García et al. (2014) García, J., Dauser, T., Lohfink, A., et al. 2014, ApJ, 782, 76
- García-Burillo et al. (2016) García-Burillo, S., Combes, F., Ramos Almeida, C., et al. 2016, ApJ, 823, L12
- Gaskell et al. (1981) Gaskell, C. M., Shields, G. A., & Wampler, E. J. 1981, ApJ, 249, 443
- Ghisellini et al. (1994) Ghisellini, G., Haardt, F., & Matt, G. 1994, MNRAS, 267, 743
- Goodman & Weare (2010) Goodman, J., & Weare, J. 2010, Comm. App. Math. Comp. Sci., 5, 65
- Guainazzi et al. (2016) Guainazzi, M., Risaliti, G., Awaki, H., et al. 2016, MNRAS, 460, 1954
- Harrison et al. (2013) Harrison, F. A., Craig, W. W., Christensen, F. E., et al. 2013, ApJ, 770, 103
- Hasinger (2008) Hasinger, G. 2008, A&A, 490, 905
- Heckman & Best (2014) Heckman, T. M., & Best, P. N. 2014, ARA&A, 52, 589
- Hönig (2012) Hönig, S. F. 2012, in Proceedings of the Torus Workshop 2012, ed. C. Packham, R. Mason, & A. Alonso-Herrero
- Hopkins et al. (2006) Hopkins, P. F., Hernquist, L., Cox, T. J., et al. 2006, ApJS, 163, 1
- Hunter (2007) Hunter, J. D. 2007, Computing In Science & Engineering, 9, 90
- Ichikawa et al. (2015) Ichikawa, K., Packham, C., Ramos Almeida, C., et al. 2015, ApJ, 803, 57
- Ikeda et al. (2009) Ikeda, S., Awaki, H., & Terashima, Y. 2009, ApJ, 692, 608
- Inglis et al. (1993) Inglis, M. D., Brindle, C., Hough, J. H., et al. 1993, MNRAS, 263, 895
- Kara et al. (2015) Kara, E., Fabian, A. C., Lohfink, A. M., et al. 2015, MNRAS, 449, 234
- Kawamuro et al. (2016) Kawamuro, T., Ueda, Y., Tazaki, F., Ricci, C., & Terashima, Y. 2016, ApJS, 225, 14
- King et al. (2017) King, A. L., Lohfink, A., & Kara, E. 2017, ApJ, 835, 226
- Koss et al. (2015) Koss, M. J., Romero-Cañizales, C., Baronchelli, L., et al. 2015, ApJ, 807, 149
- Koss et al. (2016) Koss, M. J., Assef, R., Baloković, M., et al. 2016, ApJ, 825, 85
- Krause (1979) Krause, M. O. 1979, Journal of Physical and Chemical Reference Data, 8, 307
- Krolik et al. (1994) Krolik, J. H., Madau, P., & Zycki, P. T. 1994, ApJ, 420, L57
- Lamer et al. (2003) Lamer, G., Uttley, P., & McHardy, I. M. 2003, MNRAS, 342, L41
- Leahy & Creighton (1993) Leahy, D. A., & Creighton, J. 1993, MNRAS, 263, 314
- Lira et al. (2013) Lira, P., Videla, L., Wu, Y., et al. 2013, ApJ, 764, 159
- Liu & Li (2014) Liu, Y., & Li, X. 2014, ApJ, 787, 52
- Liu & Li (2015) —. 2015, MNRAS, 448, L53
- Lohfink et al. (2015) Lohfink, A. M., Ogle, P., Tombesi, F., et al. 2015, ApJ, 814, 24
- Lopez-Rodriguez et al. (2015) Lopez-Rodriguez, E., Packham, C., Jones, T. J., et al. 2015, MNRAS, 452, 1902
- Madejski et al. (2000) Madejski, G., Życki, P., Done, C., et al. 2000, ApJ, 535, L87
- Magdziarz & Zdziarski (1995) Magdziarz, P., & Zdziarski, A. A. 1995, MNRAS, 273, 837
- Maiolino et al. (2007) Maiolino, R., Shemmer, O., Imanishi, M., et al. 2007, A&A, 468, 979
- Maksym et al. (2016) Maksym, W. P., Fabbiano, G., Elvis, M., et al. 2016, ApJ, 829, 46
- Malizia et al. (2003) Malizia, A., Bassani, L., Stephen, J. B., et al. 2003, ApJ, 589, L17
- Marchese et al. (2012) Marchese, E., Braito, V., Della Ceca, R., Caccianiga, A., & Severgnini, P. 2012, MNRAS, 421, 1803
- Marin (2016) Marin, F. 2016, MNRAS, 460, 3679
- Marinucci et al. (2015) Marinucci, A., Matt, G., Bianchi, S., et al. 2015, MNRAS, 447, 160
- Marinucci et al. (2016) Marinucci, A., Bianchi, S., Matt, G., et al. 2016, MNRAS, 456, L94
- Markowitz et al. (2014) Markowitz, A. G., Krumpe, M., & Nikutta, R. 2014, MNRAS, 439, 1403
- Masini et al. (2016) Masini, A., Comastri, A., Baloković, M., et al. 2016, A&A, 589, A59
- Mateos et al. (2016) Mateos, S., Carrera, F. J., Alonso-Herrero, A., et al. 2016, ApJ, 819, 166
- Miniutti et al. (2014) Miniutti, G., Sanfrutos, M., Beuchert, T., et al. 2014, MNRAS, 437, 1776
- Mitsuda et al. (2014) Mitsuda, K., Kelley, R. L., Akamatsu, H., et al. 2014, in Proc. SPIE, Vol. 9144, Space Telescopes and Instrumentation 2014: Ultraviolet to Gamma Ray, 91442A
- Murphy & Yaqoob (2009) Murphy, K. D., & Yaqoob, T. 2009, MNRAS, 397, 1549
- Nandra & George (1994) Nandra, K., & George, I. M. 1994, MNRAS, 267, 974
- Nandra et al. (2007) Nandra, K., O’Neill, P. M., George, I. M., & Reeves, J. N. 2007, MNRAS, 382, 194
- Nandra & Pounds (1994) Nandra, K., & Pounds, K. A. 1994, MNRAS, 268, 405
- Nenkova et al. (2008) Nenkova, M., Sirocky, M. M., Ivezić, Ž., & Elitzur, M. 2008, ApJ, 685, 147
- Netzer (2015) Netzer, H. 2015, ARA&A, 53, 365
- Paltani & Ricci (2017) Paltani, S., & Ricci, C. 2017, A&A, 607, A31
- Podigachoski et al. (2016) Podigachoski, P., Rocca-Volmerange, B., Barthel, P., Drouart, G., & Fioc, M. 2016, MNRAS, 462, 4183
- Puccetti et al. (2014) Puccetti, S., Comastri, A., Fiore, F., et al. 2014, ApJ, 793, 26
- Ricci et al. (2015) Ricci, C., Ueda, Y., Koss, M. J., et al. 2015, ApJ, 815, L13
- Ricci et al. (2011) Ricci, C., Walter, R., Courvoisier, T. J.-L., & Paltani, S. 2011, A&A, 532, A102
- Ricci et al. (2016) Ricci, C., Bauer, F. E., Arevalo, P., et al. 2016, ApJ, 820, 5
- Ricci et al. (2017a) Ricci, C., Trakhtenbrot, B., Koss, M. J., et al. 2017a, ApJS, 233, 17
- Ricci et al. (2017b) —. 2017b, Nature, 549, 488
- Risaliti (2002) Risaliti, G. 2002, A&A, 386, 379
- Risaliti et al. (2010) Risaliti, G., Elvis, M., Bianchi, S., & Matt, G. 2010, MNRAS, 406, L20
- Risaliti et al. (2002) Risaliti, G., Elvis, M., & Nicastro, F. 2002, ApJ, 571, 234
- Rivers et al. (2013) Rivers, E., Markowitz, A., & Rothschild, R. 2013, ApJ, 772, 114
- Rivers et al. (2015) Rivers, E., Baloković, M., Arévalo, P., et al. 2015, ApJ, 815, 55
- Roseboom et al. (2013) Roseboom, I. G., Lawrence, A., Elvis, M., et al. 2013, MNRAS, 429, 1494
- Sambruna et al. (2009) Sambruna, R. M., Reeves, J. N., Braito, V., et al. 2009, ApJ, 700, 1473
- Sazonov & Revnivtsev (2004) Sazonov, S. Y., & Revnivtsev, M. G. 2004, A&A, 423, 469
- Schmitt et al. (2003) Schmitt, H. R., Donley, J. L., Antonucci, R. R. J., Hutchings, J. B., & Kinney, A. L. 2003, ApJS, 148, 327
- Stalevski et al. (2016) Stalevski, M., Ricci, C., Ueda, Y., et al. 2016, MNRAS, 458, 2288
- Tazaki et al. (2011) Tazaki, F., Ueda, Y., Terashima, Y., & Mushotzky, R. F. 2011, ApJ, 738, 70
- Torricelli-Ciamponi et al. (2014) Torricelli-Ciamponi, G., Pietrini, P., Risaliti, G., & Salvati, M. 2014, MNRAS, 442, 2116
- Treister et al. (2008) Treister, E., Krolik, J. H., & Dullemond, C. 2008, ApJ, 679, 140
- Turner et al. (1997) Turner, T. J., George, I. M., Nandra, K., & Mushotzky, R. F. 1997, ApJS, 113, 23
- Urry & Padovani (1995) Urry, C. M., & Padovani, P. 1995, PASP, 107, 803
- Vasudevan et al. (2013) Vasudevan, R. V., Brandt, W. N., Mushotzky, R. F., et al. 2013, ApJ, 763, 111
- Vasylenko et al. (2013) Vasylenko, A. A., Fedorova, E., & Zhdanov, V. I. 2013, Advances in Astronomy and Space Physics, 3, 120
- Wada (2012) Wada, K. 2012, ApJ, 758, 66
- Wilms et al. (2000) Wilms, J., Allen, A., & McCray, R. 2000, ApJ, 542, 914
- Xu et al. (2017) Xu, Y., Baloković, M., Walton, D. J., et al. 2017, ApJ, 837, 21
- Yaqoob (1997) Yaqoob, T. 1997, ApJ, 479, 184
- Yaqoob (2012) —. 2012, MNRAS, 423, 3360
- Yaqoob et al. (2015) Yaqoob, T., Tatum, M. M., Scholtes, A., Gottlieb, A., & Turner, T. J. 2015, MNRAS, 454, 973
Appendix A Comparison with Other Torus Reprocessing Models
In this Appendix we provide more details on the comparison of borus02 with other publicly available models for X-ray reprocessing in the torus, namely MYtorus (Murphy & Yaqoob, 2009), etorus (Ikeda et al., 2009), and ctorus Liu & Li (2014). An overview of their main properties and parameters is presented in Table 1. A comparison with the BNtorus model (Brightman & Nandra, 2011), which shares the geometry chosen for borus02, but is less flexible and does not reproduce reprocessed spectra correctly, is given in § 2.3. Unless specified otherwise, for all comparisons we assume the intrinsic continuum to have , and we select the highest available within the model wherever the option exists. As the abundance of iron can only be varied within the borus02 model, we keep it fixed at the Solar value.
We first compare a set of model reprocessed X-ray spectra with matched parameters in Figure 9: one set assuming a Compton-thin torus ( , left column), and another assuming a Compton-thick torus ( , right column). Both pole-on ( , solid lines) and edge-on ( , dashed lines) viewing angles are compared. Each of the panels shows the intrinsic continuum and its Thomson-scattered reflection (dotted lines) normalized to 0.3 % of the intrinsic continuum. This value of the relative normalization is chosen as an approximate lower end of the distribution for typical obscured AGN (e.g., Ricci et al. 2017a, B18), with only % of obscured AGN showing lower contributions from such a component. Differences in the models much below this line are therefore of limited practical importance.
| borus02 | MYtorus | etorus | ctorus | |
|---|---|---|---|---|
| reference | this work | Murphy & Yaqoob (2009) | Ikeda et al. (2009) | Liu & Li (2014) |
| geometry | uniform-density sphere | uniform-density torus | similar to borus02, | same as borus02, |
| with polar cutouts | with a central cavity | but clumpy | ||
| lines | K: | K: Fe, Ni | none | K: Mg, Al, Si, S, Ar, Ca, Fe, Ni |
| K: | K: Fe | K: Ca, Fe, Ni | ||
| Compton shoulder | Compton shoulder | no Compton shoulder | ||
| 1.4–2.6 | 1.4–2.6 | 1.5–2.5 | 1.5–2.5 | |
| / keV | 20–2000 | 200 (f) aaThis is a sharp cut-off at the given energy instead of an exponential roll-over with a given scale. | 360 (f) for the range | 500 (f) aaThis is a sharp cut-off at the given energy instead of an exponential roll-over with a given scale. |
| 500 (f) aaThis is a sharp cut-off at the given energy instead of an exponential roll-over with a given scale. | 20–500 for (f) | |||
| 0.1–1.0 | 0.5 (f) | 0.34–0.98 | 0.5 (f) | |
| / ∘ | 19–87 | 0–90 | 1–89 | 19–87 |
| / | 0.1–10 | 1 (f) | 1 (f) | 1 (f) |
Note. — (f) marks a fixed parameter. The information not found in the cited references may be found on the websites hosting the Xspec tables: http://mytorus.com (MYtorus), https://heasarc.gsfc.nasa.gov/xanadu/xspec/models/etorus.html (etorus), https://heasarc.gsfc.nasa.gov/xanadu/xspec/models/Ctorus.html (ctorus).
Our choice of geometry for borus02 is very similar to that of Ikeda et al. (2009). Their publicly available model, etorus, does not include fluorescent line emission, but the reprocessed continuum shape and normalization matches that of borus02 remarkably well. A comparison is shown in Figure 9 for three different torus opening angles corresponding to , 0.50, and 0.80. Due to different assumed geometry, a direct comparison with MYtorus and ctorus models is less straightforward. In both cases, we can only make an approximate comparison for , which is fixed in those models. For both models, the average torus column density is related to the equatorial column density (which is a fitting parameter) via a factor that depends on geometry: for MYtorus (calculated exactly; Murphy & Yaqoob 2009) and 0.66 for ctorus (estimated; Liu & Li 2014). Since the latter is a clumpy torus model, we show the spectra with the maximum number of clouds () in order to approximate a uniformly filled torus as much as possible. Minor differences that can be attributed to geometry (e.g., possible silver lining effects from low- regions close to the torus rim) are apparent from Figure 9, though for the most part, we find qualitative agreement between all models.
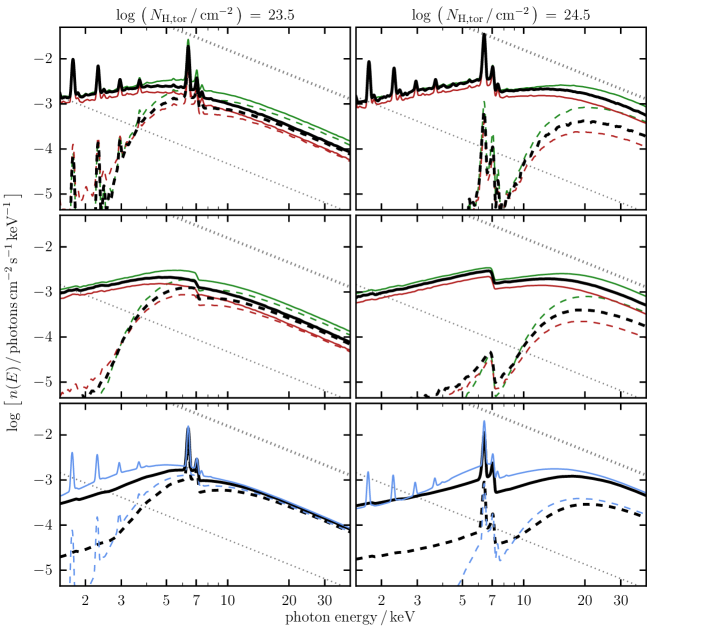
In Figure 10 we show a set of calculations of the equivalent width (EW) of the Fe K fluorescent line at 6.4 keV. In this calculation we assume that is equal to for any viewing angle that intersects the torus and zero otherwise. Dependence of EW is given for four different viewing angles: edge-on ( ), pole-on ( ), and below and above the torus rim. The latter two depend on the opening angle; we use angles with around , 0.50, and 0.75. For (second panel from the left in Figure 10), these curves can be directly compared with, e.g., Figure 8 in Murphy & Yaqoob (2009), and Figure 6 in Furui et al. (2016). Curves with smaller and larger covering factor may be compared to, e.g., Figure 3 in Ghisellini et al. (1994), and Figure 13 in Ikeda et al. (2009) (also Figure 3 in Brightman & Nandra 2011, keeping in mind the issues discussed in § 2.3). Based on these comparisons, we conclude that fluorescent line emission in borus02 is in agreement with previous work.
A feature that is perhaps unexpected, given that observations rarely yield EW greater than a few keV (e.g., Dadina 2008, Fukazawa et al. 2011, Boorman et al. 2016), is that in some cases our curves extend up to keV. However, this is simply due to the fact that in this calculation EW is evaluated against the transmitted and the reprocessed continuum components, both of which are heavily absorbed for nearly edge-on inclination in the Compton-thick regime. In reality, a small amount of off-nuclear Thomson-scattered secondary continuum (or contributions from the host galaxy) is sufficient to limit EW to keV. This is illustrated in the rightmost panel of Figure 10, where we compare edge-on curves computed without (dotted lines) and with (solid lines) a small contribution from the Thomson-scattered continuum normalized to 0.3 % of the intrinsic continuum.