1\Yearpublication2018\Yearsubmission2017\Month9\Volume999\Issue0\DOIasna.201400000
XXXX
Period changes in the RR Lyrae stars of NGC 6171 (M107)
Abstract
Based on photometric data obtained between 1935 and 2017, diagrams were built for 22 RR Lyrae stars in the globular cluster NGC 6171, leading to the discovery of secular period changes in 4 variables for which we have calculated their period change rates . In contrast we find that of the sample stars have stable periods over the last 82 years. For the stable period stars, the whole data base has been employed to refine their periods. Among the period changing stars, three (V10, V12 and V16) have decreasing periods larger than expected from stellar evolution. Despite these individual cases of significant period change rate, the golbal average of the measured period changes in the cluster is basically zero, in consonance with theoretical predictions for clusters with redder horizontal branches. The hitherto unpublished observations, now brought into public domain, are employed to calculate a set of times of maximum light which are used in the present analysis.
keywords:
globular clusters: individual (NGC 6171) – stars:variables: RR Lyrae1 Introduction
The study of secular period changes of RR Lyrae stars (RRLs) in globular clusters, may play a decisive role in testing horizontal branch (HB) evolution models. However, measuring secular period changes from observations is difficult since accurate observations over a very long time-base are required. Only a few clusters have been studied from data covering more than 60 years, e.g.; M3 (Corwin & Carney 2001, Jurcsik et al. 2012), M5 (Szeidl et al. 2011; Arellano Ferro et al. 2016), NGC 6934 (Stagg & Wehlau 1980), M14 (Wehlau & Froelich 1994), M15 (Silbermann & Smith 1995), NGC 7006 (Wehlau, Slawson & Nemec 1999), and Cen (Jurcsik et al. 2001). Theory predicts that blueward or redward evolution near the zero-age horizontal branch (ZAHB) is slow and produces very small period change rates, except towards the end of the HB evolution, when the values of can be between and d Myr-1 (Lee 1991). However, in several of the above studies, stars with significantly large values of , both positive and negative, have been reported. These high values may be the result of non-evolutionary effects, like stochastic processes related to mixing events in the core of the star (Balazs-Detre & Detre 1965, Sweigart & Renzini 1979), or to the fast crossing of the instability strip of pre-ZAHB stars on their evolution to the blue, with d Myr-1 (Silva-Aguirre et al. 2008).
In the present investigation we have focused our attention on the globular cluster NGC 6171 (M107 or C1629-129 in the IAU nomenclature, , J2000, galactic coordinates , ).
A previous study of secular period changes in NGC 6171 was published by Coutts & Sawyer Hogg (1971), whom included photographic data of 22 RRLs taken between 1935 and 1970, however, the times of maximum light were rather scanty. A commentary of the period change rates based on statistical theoretical grounds was published by Gryzunova (1979a,b). Suplemented with data from Las Campanas 1972-1991 (now published in the present work); Las Campanas 1993-1994 (Clement & Shelton 1997) and our Hanle 2015-2016 and San Pedro Mártir 2017 CCD observations, the time-base extends to 82 years, constitutes a significant improvement and encourages a new approach to the study of the secular period changes of the RRLs of this cluster.
The photometric data were used to calculate as many times of maximum light as possible and these were employed to investigate the secular period behavior of 22 RRLs in NGC 6171. The sources and temporal distribution of the data are indicated in Table 1.
The present paper is organized as follows; in 2 we briefly describe our 2015-2017 observations, in 2.1 we summarise the 1935-1994 data taken from the literature, in 3 the method is described. In 4 the approach used to estimate the times of maximum brightness is explained, and it contains the individual diagrams and the resulting refined periods and period change rates. In 5 we discuss our results in the context of stellar evolution; and finally, in 6 our conclusions are summarised.
| Authors | years | band |
|---|---|---|
| Oosterhoff (1938) | 1935 | |
| Coutts & Sawyer Hogg (1971) | 1946-1970 | |
| Kukarkin (1961) | 1959-1960 | |
| Mannino (1961) | 1959-1960 | |
| Dickens (1970) | 1966-1967 | and |
| Table 3 (this paper) | 1972-1991 | |
| Clement & Shelton (1997) | 1993-1994 | CCD |
| Table 2 (this paper) | 2015-2017 | CCD |
| Variable | Filter | HJD | ||
|---|---|---|---|---|
| Star ID | (d) | (mag) | (mag) | |
| V4 | V | 2457200.14416 | 15.673 | 0.006 |
| V4 | V | 2457200.14769 | 15.667 | 0.006 |
| ⋮ | ⋮ | ⋮ | ⋮ | ⋮ |
| V4 | I | 2457200.13190 | 14.797 | 0.009 |
| V4 | I | 2457200.13824 | 14.787 | 0.009 |
| ⋮ | ⋮ | ⋮ | ⋮ | ⋮ |
| V5 | V | 2457200.14416 | 15.287 | 0.004 |
| V5 | V | 2457200.14769 | 15.286 | 0.004 |
| ⋮ | ⋮ | ⋮ | ⋮ | ⋮ |
| V5 | I | 2457200.13190 | 14.327 | 0.007 |
| V5 | I | 2457200.13824 | 14.302 | 0.007 |
| ⋮ | ⋮ | ⋮ | ⋮ | ⋮ |
2 Observations
The most recent CCD time-series observations used in this paper substantially extend the time baseline, in many cases to 82 years. These observations were performed on 4 nights, between June 26, 2015 to May 5, 2016, with the 2.0 m telescope at the Indian Astronomical Observatory (IAO), Hanle, India. For 7 nights between June 29 to July 5, 2017, data were obtained with the 0.84 m telescope at the San Pedro Mártir Observatory (SPM), México. A total of 292 images obtained in the Johnson-Kron-Cousins filter, are used for the purpose of the present analysis. images were also obtained. The instrumental system was converted into the Landolt-Johnson/Kron-Cousins standard system via standard stars in the field of the cluster provided by Stetson (2000). The standard system magnitudes and their uncertainties for the RRLs are published in electronic format and we present a small portion of it as Table 2.
| HJD | V2 | V3 | V4 | V5 | V6 | V7 | V8 | V9 | V10 | V11 | V12 |
|---|---|---|---|---|---|---|---|---|---|---|---|
| -2 400 000 | |||||||||||
| 41446.819 | 16.86 | 16.44 | 15.56 | 15.91 | 16.02 | 15.33 | 16.44 | 15.77 | 16.84 | 16.07 | 16.89 |
| 41447.640 | – | – | – | – | – | – | – | – | – | – | – |
| 41447.676 | 15.84 | 15.89 | 15.56 | 16.29 | 15.60 | 16.29 | 15.25 | – | 16.86 | 16.61 | 16.61 |
| . . . | |||||||||||
| HJD | V13 | V14 | V15 | V16 | V17 | V18 | V19 | V20 | V21 | V23 | V24 |
| -2 400 000 | |||||||||||
| 41446.819 | 16.79 | 16.89 | 15.66 | 16.84 | 16.66 | 15.24 | 15.91 | 16.70 | 16.95 | 16.15 | – |
| 41447.640 | – | – | 15.77 | 16.05 | 15.77 | 15.99 | 16.44 | – | – | 15.89 | – |
| 41447.676 | 16.98 | 16.73 | 15.79 | 16.42 | 15.93 | 16.02 | 15.89 | 16.02 | 17.16 | 15.73 | 16.29 |
| . . . |
2.1 The 1935 - 1994 data of NGC 6171
The data taken between 1935 and 1994 have been systematically assembled by Prof. Christine M. Clement, who kindly made them available to us. The original sources are summarised in Table 1. The published data have been taken as given in the original papers without any further manipulation. The observations from the years 1972-1991 were obtained by C. Clement with the University of Toronto 61-cm telescope at the Las Campanas Observatory of the Carnegie Institution of Washington. A total of 420 photographs were taken on plates with 103aO emulsion, exposed through a GG385 filter. The plates were measured on a Cuffey iris photometer. Some of these data were used, but not published, in the study of the Fourier parameter , by Clement et al. (1992). We are now publishing these data in an electronic format and a small fraction of the table is included in the printed version of this paper as Table 3. These data were taken in an almost yearly basis and the light curves of most variables are well covered, allowing a good estimation of the time of maximum light nearly every year. Thus, this set of data is crucial for the interpretation of the diagrams.
2.2 The 2015 - 2016 data of NGC 6171
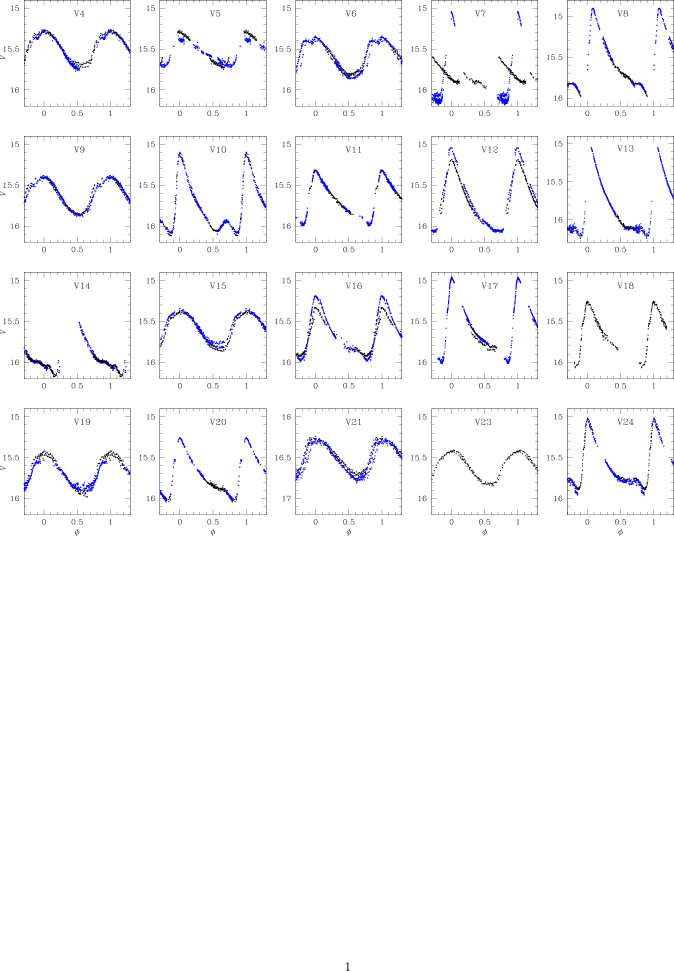
In Fig. 1 the light curves tabulated in Table 2 and obtained in 2015-2016 (black symbols) and 2017 (blue symbols) are displayed. They have provided a few recent times of maximum light that extend the time-base to 82 years. They have been phased with corrected period estimated below and the seasonal time of maximum. Note the consistency of the 2015-2016 and the 2017 data and the evident variation in amplitude in some stars, likely due to the Blazhko effect. The employment of these light curves as indicators of the mean metallicity and distance of the parental cluster, via the Fourier decomposition, will be reported elsewhere. Comments on individual stars can be found in 4.2.
3 The approach to the secular period changes
The observed minus the calculated () residuals of a given feature in the light curve, as an indication of miscalculations or authentic variations of the pulsation or orbital period, using a single given phase of the light curve as a reference, is a standard approach that has been in use for many decades; for example, in Cepheids, RR Lyrae stars, and contact binary stars (e.g. Arellano Ferro et al. 1997; 2016; Coutts & Sawyer Hogg 1969). Then, it is convenient to select a feature that facilitates the accurate determination of the phase. For RRLs, the maximum brightness is a good choice since it is well constrained, particularly for the RRab type, as opposed to the longer-lasting time of minimum. To predict the time of maximum let us adopt an ephemeris of the form
| (1) |
where is an adopted origin or epoch of reference, is the period at , and is the number of cycles elapsed between and . An initial estimate of the number of cycles, between the observed time of maximum and the reference is simply
| (2) |
where the incomplete brackets indicate the rounding down to the nearest integer. However, it must be noted that if the time between and the observed time of maximum is much larger than the period, and the period change rate is large enough, the difference can exceed one or more cycles, and there must be a correction for these extra cycles to obtain a correct diagram. This exercise may prove to be difficult if there are large gaps in the time-series, but it is rather straight forward otherwise.
| Variable | (HJD) | ||
|---|---|---|---|
| V2 | 0.571021 | 2442538.8397 | |
| (HJD) | No. of Cycles | source | |
| (days) | |||
| 2427930.951 | –0.0346 | –25582. | Oo |
| 2432004.682 | 0.0340 | –18448. | CouSH |
| 2437052.486 | 0.0142 | –9608. | Kuk |
| 2437100.448 | 0.0104 | –9524. | Man |
| 2439258.334 | 0.0088 | –5745. | Di |
| 2440693.874 | 0.0025 | –3231. | CouSH |
| 2441448.747 | –0.0140 | –1909. | Clem |
| 2442135.701 | 0.0020 | –706. | Clem |
| 2442537.670 | –0.0276 | –2. | Clem |
| 2442538.841 | 0.0013 | 0. | Clem |
| 2442935.727 | 0.0279 | 695. | Clem |
| 2443273.736 | –0.0075 | 1287. | Clem |
| 2443632.899 | –0.0165 | 1916. | Clem |
| 2444020.635 | –0.0037 | 2595. | Clem |
| 2444371.805 | –0.0115 | 3210. | Clem |
| 2444759.535 | –0.0046 | 3889. | Clem |
| 2445083.888 | 0.0086 | 4457. | Clem |
| 2445850.780 | 0.0197 | 5800. | Clem |
| 2446562.828 | 0.0047 | 7047. | Clem |
| 2447298.862 | -0.0071 | 8336. | Clem |
A plot of the number of cycles vs , is usually referred as the diagram, and its appearance can make evident secular variations of the period, or the fact that the period used in the ephemerides is wrong, in which case the distribution of the residuals is linear and tilted. For NGC 6171, the distribution of the observations over the last 80 years enabled us to estimate accurately the number of cycles required in order to produce coherent diagrams.
Let us assume, as an initial model, a quadratic distribution of the residuals as a function of time, represented by the number of cycles elapsed since the initial epoch . The linear and quadratic cases are then particular solutions of the representation:
| (3) |
or,
| (4) |
| Variable | Variable | |||||
| Star ID | Type | (+2 400 000) | (+2 400 000) | |||
| (days) | (HJD) | (HJD) | (days) | (d Myr-1) | ||
| V2 | RRab | 0.5710 | 42538.841 | 42538.840 | 0.571021 | |
| V3 | RRab | 0.5663 | 41844.561 | 41844.570 | 0.566344 | |
| V4 | RRc | 0.282130 | 57528.3538 | 57528.3633 | 0.282132 | |
| V5 | RRab | 0.7024 | 57200.193 | 57200.3342 | 0.702376 | |
| V6 | RRc | 0.259635 | 57527.2486 | 57527.2307 | 0.259627 | |
| V7 | RRab | 0.4975 | 44018.667 | 44018.635 | 0.497474 | |
| V8 | RRab | 0.5599 | 44371.599 | 44371.588 | 0.559922 | |
| V9 | RRc | 0.3206 | 57200.2279 | 57200.2369 | 0.320601 | |
| V10 | RRab | 0.415506 | 57528.4208 | 57528.4707 | 0.4155586 | |
| V11 | RRab | 0.5928 | 57528.3744 | 57528.3821 | 0.592809 | |
| V12 | RRab | 0.472833 | 49125.719 | 57527.331 | 0.472830 | |
| V13 | RRab | 0.4668 | 44371.865 | 44371.873 | 0.466797 | |
| V14 | RRab | 0.4816 | 43275.6195 | 43275.6356 | 0.48162 | |
| V15 | RRc | 0.288589 | 57200.1676 | 57200.0880 | 0.288590 | |
| V16 | RRab | 0.522798 | 57200.1894 | 57200.1503 | 0.522796 | |
| V17 | RRab | 0.561168 | 41860.578 | 41860.593 | 0.5611675 | |
| V18 | RRab | 0.561404 | 57528.4361 | 57528.4361 | 0.561404 | |
| V19 | RRc | 0.278766 | 57528.3812 | 57528.3666 | 0.278762 | |
| V20 | RRab | 0.5781 | 41863.748 | 41863.765 | 0.578107 | |
| V21 | RRc | 0.258724 | 57201.2263 | 57201.203 | 0.258715 | |
| V23 | RRc | 0.323343 | 49477.617 | 49477.6189 | 0.323344 | |
| V24 | RRab | 0.523977 | 49123.856 | 49123.821 | 0.523947 |
Taking the derivative, the period at any given is
| (5) |
From the above equations, it is straight forward to demonstrate that the period change rate at and is given by
| (6) |
and that if the distribution is linear, i.e. , then the correct epoch and period are given by and , respectively. A detailed derivation of the above equations can be found in Arellano Ferro et al. (2016).
4 Times of maximum brightness and the diagrams
We have estimated as many times of maximum brightness as possible with the available data. When a light curve is covered near the maximum, estimating the time of the maximum brightness is fairly straight forward and the uncertainty is small. Error bars would be similar in size to the symbols in the diagrams. Only in a few cases, interpolating between competing maxima was necessary. For the data sets covering several years (e.g. Coutts & Sawyer Hogg 1971 for 1946-1970 or data in Table 3 for the years 1972-1991), we searched for clear times of maximum through the whole collections and were able to recover numerous maxima, producing the highest density of data in the diagrams in Fig. 2.
The complete collection of times of maximum light is given in Table 4. To calculate the residuals we proceeded as follows: first, an epoch with a well covered light curve was identified and the period at that epoch was estimated. These period and epoch were adopted as initial values and . Generally, the data from 2015 to 2016 were proper for this aim, except for a few incomplete light curves particularly near the time of maximum. In those cases, the data from Clement & Shelton (1997) or from the previously unpublished data from Clement (Table 3), were used. For some cases with a linear distribution of values, we took the period from the Catalogue of Variable Stars in Globular Clusters (CVSGC) (Clement et al. 2001; 2015 edition). While these periods are quoted to only four digits and true periods may be slightly different, the approach to the period correction is not sensitive to the selection of since a different will produce a different slope but the corrected period (see Eq. 5) will be the same. The adopted initial ephemerides are summarised in Table 4. The resulting diagrams are shown in Fig. 2 for every variable included in the present work.

It is obvious from these diagrams, that there are only two types of distributions; the linear distribution, which once the correct period is used in the time of maximum predicting ephemerides (given in column 5 of Table 5), produces a horizontal distribution and implies a non-changing period, and the parabolic distribution which implies a secular period variation whose rate can be calculated with Eq. 6. It is worth noting at this point, that the approach to the secular period changes is particularly sensitive to the counting of cycles, which is very easy to lose when dealing with a long time-base and short-period stars, as is the present case. As the difference drifts, either because the assumed initial period is wrong or because it is authentically changing, the calculated maximum may skip a few cycles relative to the corresponding observed one. If this is not properly considered, the diagram may show intriguing shapes which could be misinterpreted as irregular period variations. This has already been stressed by Arellano Ferro et al. (2016) for the case of the RRLs in M5. In the present case of NGC 6171, we do not see any irregular variations but only constant periods (linear) or a few parabolic secular variations (quadratic). It is pointed out however, that there are cases where the horizontal distributions display a considerable scatter (e.g. V6, V7, V18, V21). This may be the consequence of stochastic fluctuations of the period and/or of uncertainties in the estimations of the times of maximum light due to the limited quality of the observations.
Table 5 summarises the initial assumed ephemerides, the corrected periods and epochs and, in the corresponding cases, the calculated period change rate .
4.1 Consistency test for the refined periods and period change rates
Once a period change rate has been calculated (quadratic case), or the period has been duly corrected (linear case), a natural test is to phase the light curve with the new ephemeris. In Fig. 1, the light curves from 2015-2016 are phased either with corrected period (linear cases) or with for the corresponding in Eq. 5 (parabolic cases).
In fact, for a secularly changing period, Eq. 5 allows to calculate the period at any given number of cycles elapsed from the origin . Each corresponding period should properly phase the data taken at that vlue of . As an example, in Fig. 3 we phase the light curve of star V12 over the last 82 years, using the ”local” periods and epochs as predicted by the parabola in Fig. 2 and Eq. 5, and listed in Table 6. In all cases, the light curve and time of maximum are consistent with the secular period change. The appearance of the curve is only limited by the quality of the photometry of a given data set.
4.2 Comments on individual stars
While generally the diagrams in Fig.2 show a clear period behavior, in a few cases the distribution may admit alternative solutions, as we comment in the following paragraphs. Since the previous study of the period changes in NGC 6171 by Coutts & Sawyer Hogg (1971), good quality data have been obtained, and hence richer diagrams can be produced, a detailed comparison with the results of these authors is probably inadequate. Some comments on specific stars might however be in order.
V2 and V3. These RRLs are not included in the field of view of our images and the historical data are scarce. However, the data in Table 3 enable the estimation of numerous times of maximum light and hence the analysis of the secular behaviour of the period.
V5. The residuals in Fig. 2 display a clear linear distribution, leading to a refined period of 0.702376 d. A negative period change rate and an abrupt negative period change have been reported for this star by Coutts & Sawyer Hogg (1971) and Gryzunova (1979a) respectively. Our solution displays a rather constant period. The estimated maximum from 2015 data shows a significant and unexpected phase displacement and was not considered in the adopted solution. We noted however that the predicted period in Table 5 (0.702376 d) fails to phase properly the light curves from 2015-2017, for which a shorter period, 0.695248 d, had to be invoked to scale the curves well. We do not have a clear explanation for this behaviour and speculate that the star might have undergone a stochastic variation of its period. The amplitude variation between 2015-16 and 2017 should be noted.
V6. Although the distributions of this star suggest a linear distribution, the scatter is significant and is probably due to the bump near maximum which makes the estimation of the time of maximum brightness inaccurate.
V7. In our data the light curve of this star displays a large difference between 2015-2016 and 2017 and suggests a large amplitude modulation as observed in stars with the Blazhko effect. Clement & Shelton (1997) noticed the cycle to cycle variations near minimum light, and the peculiar harmonics amplitude rations relative to other RRab stars in the cluster. Stars with Blazhko effect often display not only amplitude but also phase modulations, which likely explains the large scatter in the diagram for this star.
V10. A period increase was reported by Coutts & Sawyer Hogg (1971) who calculated d Myr-1. The diagram in Fig. 2 shows a decreasing nature of the period at a rate d Myr-1. The discrepancy between the two investigations is caused by an error in the period due to an uncertainty in the number of cycle counts in the CSH study. The richer diagram in our current study has resolved this ambiguity.
V12. Our analysis of this star shows a decreasing period with d Myr-1. The diagram however displays a significant dispersion. We note that Clement & Shelton (1997) found the Fourier parameters, particularly and , to be peculiar among those in other RRab stars. A close inspection of Fig. 3 shows a distinctive slope change on the rising branch in 1993 which is not apparent in the other light curves. This suggests that the light curve shape might undergo secular variations and probably stochastic oscillations of the time of maximum. It should be noted the amplitude variation between 2015-2016 and 2017 data, confirming the amplitude modulations reported by Clement & Shelton (1997).

| E0 | P (days) | year |
|---|---|---|
| 2427931.957 | 0.47289860 | 1935 |
| 2436728.475 | 0.47287822 | 1959 |
| 2437050.549 | 0.47287747 | 1960 |
| 2440747.669 | 0.47286889 | 1970 |
| 2441454.580 | 0.4728665 | 1972 |
| 2443281.546 | 0.4728627 | 1977 |
| 2446185.774 | 0.4728567 | 1985 |
| 2448011.631 | 0.4728529 | 1990 |
| 2449125.719 | 0.47284945 | 1993 |
| 2449482.737 | 0.47284862 | 1994 |
| 2457527.331 | 0.47282997 | 2015-2016 |
| 2457939.681 | 0.47283244 | 2017 |
V14. The residuals for this star show a peculiar change in slope at about HJD 2443275.6 d or May 1977 if a period of 0.4816 d is used. Although this slight change of slope could also be fitted by a parabola, implying d Myr-1, we rather prefer the slight period change and hence the two slopes depicted. The two slopes would imply corrected periods d and d which are identical to the fifth digit. We failed observing the star near maximum brightness between 2015 and 2017.
V15. A slightly tilted diagram is found with two discrepant values in 2015 and 2017, which are otherwise consistent among them. This may suggest an abrupt period change which is to be confirmed in the future if new times of maximum light become available.
V16. This is a clear and strongly period decreasing star with . Coutts & Sawyer Hogg (1971) also found a similar result and calculated a period decrease rate of -1.6 d Myr-1.
V17. The diagram in Fig. 2 shows a positive parabola and a corresponding . This is the only star in the sample for which we have found a positive period increase that, if ascribed to evolution, may indicate a red ward evolution.
V21. In spite of the fact that this is a field star (Dickens 1970, Cudworth et al. 1992) projected on the cluster field, it was included in the present due to the fact that similar to the cluster members, photometric coverage was available for 82 years. Hence, although the scatter in the diagram is substantial, its period has been refined and reported in Table 5.
V22. This star is not included in the present study. V22 is not a cluster member (Sawyer Hogg 1973) and out of the field of most studies, except of that of Oosterhoff (1938). Hence the historical data are very scarce.
V23. The diagram shows a linear distribution with a small tilt which implies a tiny correction to the period. The 1935 light curve from Oosterhoff (1938) is very scattered and we could not estimate a reliable time of maximum. We note that the two oldest maxima, corresponding to data from Coutts & Sawyer Hogg (1971) from July 1946 and July 1955, are not fitted by the more recent linear distribution, however these are two bona-fide maxima from a rather scattered light curve. We note that in the paper by Dickens (1970) the star labeled as V1 in fact corresponds to V23.
5 Period changes and evolution in the HB
As stars evolve across the instability strip (IS), their pulsation period should either increase or decrease if evolution is towards the red or the blue, respectively. However, other non-evolutive reasons for period changes have been suggested, such as stochastic variations (Balazs-Detre & Detre 1965) or mixing events in the core of a star at the HB that may alter the hydrostatic structure and pulsation period (Sweigart & Renzini 1979). Also, irregular and complicated secular period variations have been claimed for some RR Lyrae stars (e.g. Szeidl et al. 2011, Jurcsik et al. 2001), which indeed would be difficult to reconcile with stellar evolution exclusively. However, for the RR Lyrae stars in M5, it has been argued that there is no need to claim for irregular period variations since an improper counting of cycles, particularly in long time baseline sets of times of maximum light, may be responsible for apparent irregularities (Arellano Ferro et al. 2016).
At present, there is a large evidence that there is no preferential positive or negative values of in the RRLs in a given cluster, and for a summary the reader is referred to the discussion of Arellano Ferro et al. (2016). Perhaps, the exceptions are Cen for which an average of d Myr-1 can be calculated from table 6 of Jurcsik et al. (2001), and IC 4499 with d Myr-1 from Kunder et al (2011) (their Table 1 without three extreme cases). Also, in the extensive investigations on secular period variations in globular clusters (e.g. Silbermann & Smith 1995; Corwin & Carney 2001; Arellano Ferro et al. 2016) no significant differences have been found for the average values of for the populations of RRab and RRc stars .
Models of the HB calculated by Lee (1991) and Catelan et al. (2004) confirm that positive period change rates of evolutionary origin occur mostly in globular clusters with blue HB structures, i.e. with large values of the HB structure parameter , where and are the number of stars to the blue, inside and to the red of the instability strip respectively. Figure 15 of Catelan (2009) displays such behaviour of as a function of and shows that in red HB clusters the average value of should be about zero. NGC 6171 has a very red HB, with , hence the above models predict an average d Myr-1. In fact, the overall average of values in Table 5 is d Myr-1, which given the typical uncertainties of is not significantly different from zero.
Even in clusters like M3 and M5 where the overall period change rates average nearly zero, as predicted by canonical models, it has been common to isolate individual cases with significantly large values of . In the case of NGC 6171, we found large secular period change rates in 4 stars in a sample of 22. Three of these have large negative values of , which implies evolution to the blue. The only period increasing case is V17 with . This period rate is comparable to the rate found in some RRLs in other clusters; in M5 (=+0.31) for example, V8 (+0.474 d Myr-1), V7 (+0.474 d Myr-1) and V25 (+0.933 d Myr-1), or the more moderate V77 (+0.340 d Myr-1 ), V87 (+0.369 d Myr-1) and V90 (+0.114 d Myr-1) for which, arguments in favour of they being stars in a truly advanced evolution have been offered (Arellano Ferro et al. 2016); in M3 (=+0.18) we have V10 (0.385 d Myr-1), V47 (+0.393d Myr-1), V69 (+0.414 d Myr-1), V83 (+0.345 d Myr-1) (Corwin & Carney 2001). Jurcsik et al. (2001) calculated period change rates across the IS between and +0.745 d Myr-1 based on post-HB evolutionary tracks of Dorman (1992) for [Fe/H] = and masses of 0.60 to 0.66 M⊙. Thus, all the above quoted positive period changes may be consistent with an evolutionary origin, also for our present case of V17.
On the other hand, as discussed by Silva-Aguirre et al. (2008), pre-ZAHB stars crossing the instability strip at high evolving rates may have values of d Myr-1 but can reach values d Myr-1. From the calculations of Jurcsik et al. (2001) based on Dorman’s (1992) post-ZAHB models, the fastest blueward evolution reaches the rate of d d-1 or about d Myr-1. Thus, it is tempting to suggest that variables V10, V12 and V16 in NGC 6171 are examples of pre-ZAHB stars. We should consider however that, according to the statistics produced by the simulations of Silva-Aguirre et al. (2008) for the case of M3, only 1 pre-ZAHB is expected every 60 bona-fide HB stars, and only 22% of them would fall in the instability strip, where they can be disguised as RRLs. Assuming that these statistics hold for NGC 6171, with about 110 stars in the HB, it implies that not even one pre-ZAHB RR Lyrae-like pulsator should be found. Nevertheless, RR Lyrae with large negative values of is a rather common feature in several clusters. In M3 itself there are 5 stars with d Myr-1 (Corwin & Carney 2001), in M5 there are 5 stars with d Myr-1 (Arellano Ferro et al. 2016) and 4 in NGC 6934 (Stagg & Wehlau 1980). Thus, it is probably not unlikely that V10, V12 and V16 in NGC 6171 are indeed pre-ZAHB stars.
Perhaps the most remarkable result in the present paper is the high percentage of stars with stable period. It should be noticed that the four stars with changing period in NGC 6171 are RRab stars, and that 18 of the 22 stars studied, i.e. 82%, have retained a constant period for at least 80 years. In M5, 34% of its RRLs were found to have unchanging periods over a 100 year interval (Arellano Ferro et al. 2016). Naturally, the question of whether this result would be subject to change after one or two decades of accurate estimation of times of maximum may be posed. Note that the uncertainties in the beta values in Table 5 are generally of a few hundreds of d Myr-1, and that, if the linear distributions in Fig. 2 are forcibly fitted with a parabola, the quadratic term leads to very small and non-significant values of . We conclude then, that with the data on hand, we are unable to detect period variations, positive or negative, below these limits. Thus, period changes for stars evolving very near the HB at very low rates may pass undetected.
6 Summary
Pulsation period changes have been analysed via the times of maximum light for 22 RRLs in NGC 6171. Archival data collected from the literature, previously unpublished data spanning 19 years, and recent CCD observations enable a span of up to 82 years for most of the sample stars, which makes this work the first significant study of period changes in NGC 6171. Secular period variations were found for 4 stars, three with significant decreasing periods and one (V17) with increasing period. No signs of irregular period variations were found in the RRLs of this cluster but instead they all have either a remarkably stable period or a secular period change that can be represented by a parabolic diagram.
The overall average of the period change rates found in NGC 6171 is not significantly different from zero, as expected from the canonical evolutionary models of the HB for a cluster with a red HB. Not withstanding this fact, individual stars with large positive and negative period changes have been found, a trend also observed in M3 and M5.
In NGC 6171, we have found a single case with positive (V17) which seems to be consistent with the period change rate expected in a truly advanced stage of evolution towards the AGB. On the contrary, a few cases emerged with values of significantly negative, which cannot be reconciled with post-HB evolutionary predictions, and that may be examples of pre-core-helium-burning stars on their contraction towards the ZAHB. The majority of the RRLs in this cluster, both RRab and RRc, display a stable period for at least 82 years well within the uncertainties of the approach. Under the paradigm that period changes are a consequence of stellar evolution, it must be concluded that these stable stars are evolving very slowly and their putative period changes are, given the data presently available, undetectable by the approach described in this work.
Acknowledgments
We are grateful to Prof. Christine M. Clement for encouraging this work and for supplying us with her collection of relevant historical data of NGC 6171, and her own extensive unpublished observations taken between 1972 and 1991 and allowing us to publish them in the present paper. Her comments and suggestions to the manuscript are gratefully appreciated. We are also indebted with the anonymous referee for his/her useful suggestions and enlightening comments. We acknowledge the financial support from DGAPA-UNAM, México via grants IN106615-17, IN105115 and from CONACyT (México). PR is grateful for the financial support from the PREI program of the National University of México and the hospitality of the Instituto de Astronomía (UNAM). PR warmly acknowledges the financial support of the CDCHTA - Universidad de Los Andes (ULA) through project C-1992-17-05-B. We are thankful to Carlos Chavarría for his help with some of the obervations in SPM. We have made an extensive use of the SIMBAD and ADS services, for which we are thankful.
References
- [] Arellano Ferro, A., Ahumada, J. A., Kains, N., & Luna, A. 2016, MNRAS, 461, 1032
- [] Arellano Ferro, A., Rosenzweig, P., Rojo Arellano, E., in Astronomical Time Series, Eds. D. Maoz, A. Sternberg, and E.M. Leibowitz, 1997 (Dordrecht: Kluwer), p. 235.
- [] Balazs-Detre, J., Detre, L. 1965, in The Position of Variable Stars in the Hertzsprung-Russell Diagram, Veroff. der Remeis-Sternwarte Bamberg IV, No. 40, 184
- [] Catelan, M. 2009, Ap&SS, 320, 261
- [] Catelan, M., Pritzl, B. J., & Smith, H. A. 2004, ApJS, 154, 633
- [] Clement, C. M., Jankulak, M., Simon, N. R. 1992, ApJ, 395, 192
- [] Clement, C. M., Shelton, I. 1997, AJ, 113, 1711
- [] Clement, C. M., Muzzin, A., Dufton, Q., et al. 2001, AJ, 122, 2587
- [] Corwin, T. M., Carney, B. W. 2001, AJ, 122, 3183
- [] Coutts C. M., Sawyer Hogg H., 1969, Pub. David Dunlap Obs., 3, 3
- [] Coutts, C. M., Sawyer Hogg, H. 1971, Publications of the David Dunlap Observatory, 3, 61
- [] Cudworth, K. M., Smetanka, J. J., Majewski, S. R. 1992, AJ, 103, 1252
- [] Dickens, R. J. 1970, ApJS, 22, 249
- [] Dorman, B., 1992, ApJS, 81, 221
- [] Gryzunova, T. I. 1979a, Astronomicheskij Tsirkulyar, 1075, 7
- [] Gryzunova, T. I. 1979b, Peremennye Zvezdy, 21, 161
- [] Jurcsik, J., Clement, C., Geyer, E. H., Domsa, I. 2001, AJ, 121, 951
- [] Jurcsik, J., Hajdu, G., Szeidl, B., et al. 2012, MNRAS, 419, 2173
- [] Kukarkin, B. V. 1961, Peremennye Zvezdy, 13, 384
- [] Kunder, A., Walker, A., Stetson, P. B., et al. 2011, AJ, 141, 15
- [] Lee, Y.-W., 1991, ApJ, 367, 524
- [] Mannino, G., 1961, Bologna Publ., 7, no. 18.
- [] Oosterhoff, P. Th., 1938, BAN, 8, 273
- [] Sawyer Hogg, H. 1973, Publications of the David Dunlap Observatory, 3, No. 6
- [] Silbermann, N. A., Smith, H. A., 1995, AJ, 109, 111
- [] Silva-Aguirre, V., Catelan, M., Weiss, A., Valcarce, A.A.R., 2008, A&A, 489, 1201
- [] Stagg, C., Wehlau, A. 1980, AJ, 85, 1182
- [] Stetson, P.B., Publ. Astron. Soc. Pac., 2000, 112, 925
- [] Sweigart, A.V., Renzini, A., 1979, A&A, 71, 66
- [] Szeidl, B., Hurta, Zs., Jurcsick, J., Clement, C., Lovas, M., 2011, MNRAS, 411, 1744
- [] Wehlau, A., Froelich, N., 1994, AJ, 108, 134
- [] Wehlau, A., Slawson, R.W., Nemec, J.M., 1999, AJ, 117, 286