Effect of Meltdown and Spectre Patches on the Performance of HPC Applications
Abstract
In this work we examine how the updates addressing Meltdown and Spectre vulnerabilities impact the performance of HPC applications. To study this we use the application kernel module of XDMoD to test the performance before and after the application of the vulnerability patches. We tested the performance difference for multiple application and benchmarks including: NWChem, NAMD, HPCC, IOR, MDTest and IMB. The results show that although some specific functions can have perfomance decreased by as much as 74%, the majority of individual metrics indicates little to no decrease in performance. The real-world applications show a 2-3% decrease in performance for single node jobs and a 5-11% decrease for parallel multi node jobs.
Index Terms:
HPC, Security, PerformanceI Introduction
The recently discovered Meltdown [1] and Spectre [2] vulnerabilities allow reading of process memory by other unauthorized processes. This poses a significant security risk on multi-user platforms including HPC resources that can result in the compromise of proprietary or sensitive information [1, 2]. Software patches released to mitigate the security vulnerabilities have the potential to significantly impact performance. According to Redhat [3] Linux OS remedies can degrade performance overall by 1-20%. In order to quantify the impact, particularly on HPC applications, we performed independent tests utilizing XDMoD’s application kernel capability [4].
The XD Metrics on Demand (XDMoD) tool, which is designed for the comprehensive management of HPC systems, provides users, managers, and operations staff with access to utilization data, job and system level performance data, and quality of service data for HPC resources [5]. Originally developed to provide independent audit capability for the XSEDE program, XDMoD was later open-sourced and is widely used by university, government, and industry HPC centers [6]. The application kernel performance monitoring module of XDMoD [4] allows automatic performance monitoring of HPC resources through the periodic execution of application kernels, which are based on benchmarks or real-world applications implemented with sensible input parameters (see Figure 1 for web interface screen-shot).
Since the application kernels, which are computationally lightweight, are designed to run continuously on a given HPC system, they are ideal for detecting differences in application performance when system wide changes (hardware or software) are made. Accordingly, XDMoD’s application kernels were employed here to determine if the software patches that mitigate the Meltdown and Spectre vulnerabilities significantly impact performance.

| Application | Number of Nodes | Difference, %1 | Are the means different?2 | Before Patch Application | After Patch Application | ||||
|---|---|---|---|---|---|---|---|---|---|
| Mean, Seconds | Standard Deviation, Seconds | Number of Runs | Mean, Seconds | Standard Deviation, Seconds | Number of Runs | ||||
| NAMD | 1 | 3.3 | Y | 306.6 | 1.44 | 24 | 316.9 | 3.05 | 56 |
| NAMD | 2 | 6.9 | Y | 175.4 | 2.78 | 22 | 188.1 | 3.49 | 56 |
| NWChem | 1 | 2.6 | Y | 77.8 | 1.91 | 23 | 79.9 | 1.11 | 59 |
| NWChem | 2 | 10.7 | Y | 58.4 | 1.05 | 21 | 65.0 | 4.16 | 56 |
| HPCC | 1 | 2.2 | Y | 304.1 | 6.39 | 23 | 310.9 | 4.88 | 56 |
| HPCC | 2 | 5.3 | Y | 345.1 | 5.41 | 22 | 364.0 | 8.44 | 56 |
| IMB | 2 | 4 | Y | 14.8 | 0.54 | 21 | 15.4 | 1.39 | 56 |
| IOR | 1 | 3.9 | Y | 188.5 | 9.41 | 21 | 195.9 | 11.69 | 55 |
| IOR | 2 | 1.5 | N | 371.1 | 12.23 | 22 | 376.7 | 19.50 | 56 |
| IOR.local | 1 | 2.1 | N | 462.8 | 16.37 | 12 | 472.8 | 19.03 | 56 |
| MDTest | 1 | 21.5 | Y | 30.5 | 3.17 | 21 | 37.8 | 4.10 | 56 |
| MDTest | 2 | 9.3 | Y | 166.7 | 3.60 | 23 | 182.8 | 5.30 | 55 |
| MDTest.local | 1 | 56.4 | Y | 3.8 | 0.62 | 12 | 6.7 | 2.61 | 56 |
-
1
Differences are calculated as the new mean value minus the old mean value divided by the average of the two means. A larger difference indicates poorer performance after the patch.
-
2
The Welch two sample, two sided, t-test with was used to determine if the before and after test results were drawn from distributions with statistically significantly different means.
II Methods
II-A Selected Application Kernels
The following XDMoD application kernels were chosen for this test: NAMD [7], NWChem [8], HPC Challenge Benchmark suite (HPCC) [9] (which includes memory bandwidth micro-benchmark STREAM [10] and the NASA parallel benchmarks (NPB)[11]), interconnect/MPI benchmarks (IMB) [12, 13], IOR [14] and MDTest [15]. The first two are based on widely used scientific applications and the others are based on commonly deployed benchmarks. Most of the application kernels were executed on one or two nodes, 8 and 16 cores respectively. For more details on application kernels refer to [4].
IOR and MDTest were executed on the parallel file system (GPFS) as well as the local file system. In order to differentiate between the two file systems, we use a ”.local” suffix in the reported results when the local file system is used (e.g. IOR.local).
II-B System
The tests were performed on a development cluster at the Center for Computational Research (CCR), SUNY, University at Buffalo. The cluster consists of eight nodes (8-cores, 24GiB RAM) with two Intel L5520 CPUs connected by QDR Mellanox Infiniband. The nodes have access to a 3 PB IBM GPFS storage system shared with other HPC resources in CCR. The operating system is CentOS Linux release 7.4.1708.
II-C Patches
To fix the Meltdown and Spectre vulnerabilities a new kernel was installed. Specifically, kernel-3.10.0-693.5.2.el7.x86_64 was updated with kernel-3.10.0-693.11.6.el7.x86_64 which fixes CVE-2017-5753, CVE-2017-5715 and CVE-2017-5754 vulnerabilities.
II-D Comparison of the Results
The tests were run prior to and after application of the vulnerability updates. The ”before” tests include approximately 20 runs for most of the application kernels. The ”after” tests include approximately 50 runs for all application kernels. The comparison of before and after distributions were determine using the Welch two sample, two sided, t-test with parameter equal to 0.05. That is, we consider the means of two distributions to be different if the probability that such test results could be obtained from equal distributions is less than or equal to 0.05.
III Results and Discussion
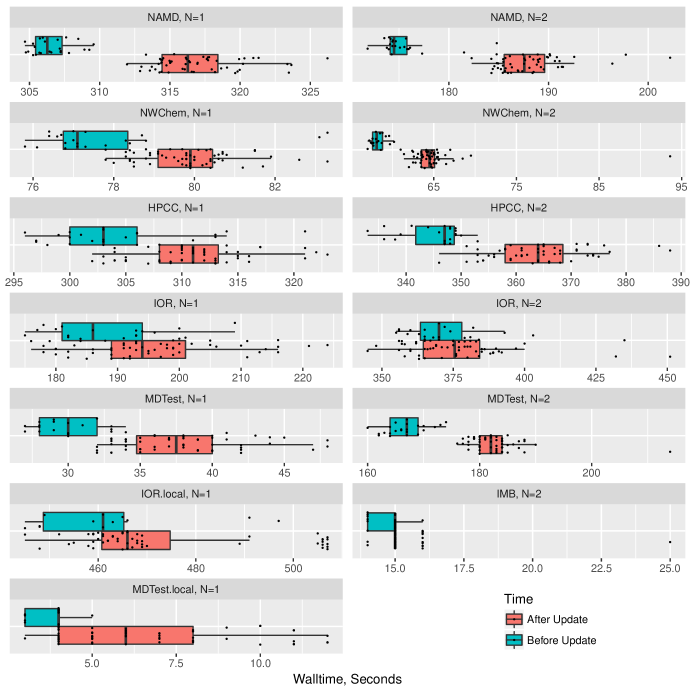
Table I and Figure 2 show the change in walltime before and after the patches for the suite of application kernels employed in this study. For the compute intensive applications (NAMD, NWChem and HPCC), the performance degradation is around 2-3% for parallel single node jobs. However it increases to 5-11% for the case of two nodes.
IOR and MDTest benchmarks measure the performance of the file system. As discussed in the introduction, we tested both the parallel and local file systems. Tables IV and V show selected results for these tests. In both cases there is a significant decrease in performance for file meta-data operations (10-20%). However, the performance degradation for read and write operations is only in the range of 0-3%. Based on these findings, the performance degradation should be smaller for applications that use a small number of large files versus those that use a large number of small files. Data processing applications may therefore be particularly sensitive to the patches employed to mitigate the vulnerabilities.
The IMB test shows that most reported metrics are degraded by more than by 2% (Table III).
The HPCC benchmark performs various tests from linear algebra, fast Fourier transformation (FFT) and memory manipulation. Interestingly the simple arrays manipulations (STREAM tests: arrays addition, copying and scaling) are actually faster in case of two nodes (Table II). However FFT, matrix manipulation and matrix transposition get slower. The surprising performance improvement in STREAM tests might be due to other changes in kernel. Anyway this improvement does not transfer to matrix manipulation and matrix transposition, which are 2% and 10% slower (two nodes).
IV Conclusions and Future Plans
Some of the individually measured simple metrics show a significant decrease in performance, notably MPI random access, memory copying and file metadata operations. Many other metrics show little to no change.
Overall the compute intensive single node applications have a moderate decrease in the performance around 2-3%. However, multi-node parallel jobs suffer a 5-11% decrease in performance. This can Probably be addressed in the compiler and MPI libraries.
These tests were executed in a relatively isolated environment. After the updates are applied on our production system we will perform additional tests with a larger number of nodes and for more application kernels.
V Acknowledgements
We gratefully acknowledge the support of NSF awards OCI 1025159, ACI 1445806, and OCI 1203560.
References
- [1] Moritz Lipp, Michael Schwarz, Daniel Gruss, Thomas Prescher, Werner Haas, Stefan Mangard, Paul Kocher, Daniel Genkin, Yuval Yarom and Mike Hamburg “Meltdown” In ArXiv e-prints, 2018 arXiv:1801.01207
- [2] Paul Kocher, Daniel Genkin, Daniel Gruss, Werner Haas, Mike Hamburg, Moritz Lipp, Stefan Mangard, Thomas Prescher, Michael Schwarz and Yuval Yarom “Spectre Attacks: Exploiting Speculative Execution” In ArXiv e-prints, 2018 arXiv:1801.01203
- [3] Red Hat “Speculative Execution Exploit Performance Impacts - Describing the performance impacts to security patches for CVE-2017-5754 CVE-2017-5753 and CVE-2017-5715” https://access.redhat.com/articles/3307751, 2018 (Updated January 4 2018 at 11:23 PM)
- [4] Nikolay A. Simakov, Joseph P. White, Robert L. DeLeon, Amin Ghadersohi, Thomas R. Furlani, Matthew D. Jones, Steven M. Gallo and Abani K. Patra “Application kernels: HPC resources performance monitoring and variance analysis” CPE-14-0402.R1 In Concurrency and Computation: Practice and Experience 27.17, 2015, pp. 5238–5260 DOI: 10.1002/cpe.3564
- [5] T.. Furlani, B.. Schneider, M.. Jones, J. Towns, D.. Hart, S.. Gallo, R.. DeLeon, C. Lu, A. Ghadersohi, R.. Gentner, A.. Patra, G. Laszewski, F. Wang, J.. Palmer and N. Simakov “Using XDMoD to facilitate XSEDE operations, planning and analysis” In Proceedings of the Conference on Extreme Science and Engineering Discovery Environment: Gateway to Discovery (XSEDE ’13), 2013, pp. 8 ACM DOI: 10.1145/2484762.2484763
- [6] Jeffrey T. Palmer, Steven M. Gallo, Thomas R. Furlani, Matthew D. Jones, Robert L. DeLeon, Joseph P. White, Nikolay Simakov, Abani K. Patra, Jeanette M. Sperhac, Thomas Yearke, Ryan Rathsam, Martins Innus, Cynthia D. Cornelius, James C. Browne, William L. Barth and Richard T. Evans “Open XDMoD: A tool for the comprehensive management of high-performance computing resources” In Computing in Science and Engineering 17.4 IEEE Computer Society, 2015, pp. 52–62 DOI: 10.1109/MCSE.2015.68
- [7] J.., R., W., J., E., E., C., R.., L. and K. “Scalable molecular dynamics with NAMD” In J. Comp. Chem. 26, 2005, pp. 1781–1802
- [8] M., E.., N., N.., T.., H… Dam, D., J., E., T.. and W.. Jong “NWChem: a comprehensive and scalable open-source solution for large scale molecular simulations.” In Comput. Phys. Commun. 181, 2010, pp. 1477
- [9] P., J. and et al. “Introduction to the HPC Challenge Benchmark Suite, ICL Technical Report ICL-UT-05-01, University of Tennessee - Knoxville”, 2005
- [10] J.. “Memory Bandwidth and Machine Balance in Current High Performance Computers”, IEEE Computer Society Technical Committee on Computer Architecture (TCCA) Newsletter, 1995
- [11] “http://www.nas.nasa.gov/publications/npb.html”
- [12] OSU Micro Benchmarks 3.3 “http://mvapich.cse.ohio-state.edu/benchmarks/ [September 1, 2011]”
- [13] Intel MPI Benchmarks 3.2.2 “http://software.intel.com/en-us/articles/intel-mpi-benchmarks [September 1, 2011]”
- [14] IOR Parallel I/O Benchmark “http://sourceforge.net/projects/ior-sio [December 1, 2011]”
- [15] mdtest “an MPI-coordinated metadata benchmark test https://sourceforge.net/projects/mdtest/ [June 30, 2016].”
| # | Application | Nodes | Metric | Diff., % | Distr. are Different | Before Patch Application | After Patch Application | Units | ||||
| Mean, Seconds | St.Dev., Seconds | Nruns | Mean, Seconds | St.Dev., Seconds | Nruns | |||||||
| 2 | NAMD | 1 | Molecular Dynamics Simulation Performance | -3.5 | TRUE | 7.67E-10 | 7.11E-12 | 24 | 7.40E-10 | 1.43E-11 | 56 | Second per Day |
| 3 | NAMD | 1 | Wall Clock Time | 3.4 | TRUE | 3.07E+02 | 1.44E+00 | 24 | 3.17E+02 | 3.05E+00 | 56 | Second |
| 5 | NAMD | 2 | Molecular Dynamics Simulation Performance | -6.6 | TRUE | 1.48E-09 | 5.60E-11 | 22 | 1.38E-09 | 8.44E-11 | 56 | Second per Day |
| 6 | NAMD | 2 | Wall Clock Time | 7.2 | TRUE | 1.75E+02 | 2.78E+00 | 22 | 1.88E+02 | 3.49E+00 | 56 | Second |
| 15 | NWChem | 1 | User Time | 1.1 | TRUE | 7.35E+01 | 7.36E-01 | 23 | 7.43E+01 | 1.08E+00 | 59 | Second |
| 16 | NWChem | 1 | Wall Clock Time | 2.7 | TRUE | 7.78E+01 | 1.91E+00 | 23 | 7.99E+01 | 1.11E+00 | 59 | Second |
| 25 | NWChem | 2 | User Time | 10.2 | TRUE | 4.75E+01 | 8.37E-01 | 21 | 5.23E+01 | 3.84E+00 | 56 | Second |
| 26 | NWChem | 2 | Wall Clock Time | 11.3 | TRUE | 5.84E+01 | 1.05E+00 | 21 | 6.50E+01 | 4.16E+00 | 56 | Second |
| 27 | HPCC | 1 | Matrix Multiplication (DGEMM) Floating-Point Performance | -1.2 | TRUE | 8.50E+03 | 5.66E+01 | 23 | 8.40E+03 | 1.11E+02 | 56 | MFLOP per Second |
| 28 | HPCC | 1 | Average STREAM ’Add’ Memory Bandwidth | 5 | FALSE | 3.17E+03 | 4.51E+02 | 23 | 3.33E+03 | 5.38E+02 | 56 | MByte per Second |
| 29 | HPCC | 1 | Average STREAM ’Copy’ Memory Bandwidth | 3.4 | FALSE | 4.36E+03 | 4.96E+02 | 23 | 4.51E+03 | 5.61E+02 | 56 | MByte per Second |
| 30 | HPCC | 1 | Average STREAM ’Scale’ Memory Bandwidth | 3.5 | FALSE | 2.95E+03 | 4.05E+02 | 23 | 3.05E+03 | 4.54E+02 | 56 | MByte per Second |
| 31 | HPCC | 1 | Average STREAM ’Triad’ Memory Bandwidth | 8.8 | TRUE | 3.29E+03 | 5.01E+02 | 23 | 3.58E+03 | 6.68E+02 | 56 | MByte per Second |
| 32 | HPCC | 1 | Fast Fourier Transform (FFTW) Floating-Point Performance | -5.9 | TRUE | 7.93E+03 | 5.55E+02 | 23 | 7.46E+03 | 1.50E+03 | 56 | MFLOP per Second |
| 33 | HPCC | 1 | High Performance LINPACK Efficiency | -5.4 | TRUE | 9.26E+01 | 7.86E+00 | 23 | 8.76E+01 | 6.19E+00 | 56 | Percent |
| 34 | HPCC | 1 | High Performance LINPACK Floating-Point Performance | -4.1 | TRUE | 6.18E+04 | 1.24E+03 | 23 | 5.93E+04 | 1.24E+03 | 56 | MFLOP per Second |
| 35 | HPCC | 1 | High Performance LINPACK Run Time | 4.3 | TRUE | 8.63E+01 | 1.88E+00 | 23 | 9.00E+01 | 1.97E+00 | 56 | Second |
| 36 | HPCC | 1 | MPI Random Access | -23.3 | TRUE | 2.09E+00 | 8.59E-02 | 23 | 1.61E+00 | 3.78E-02 | 56 | MUpdate per Second |
| 37 | HPCC | 1 | Parallel Matrix Transpose (PTRANS) | -12.3 | TRUE | 3.03E+03 | 4.37E+02 | 23 | 2.66E+03 | 8.46E+02 | 56 | MByte per Second |
| 38 | HPCC | 1 | Wall Clock Time | 2.2 | TRUE | 3.04E+02 | 6.39E+00 | 23 | 3.11E+02 | 4.88E+00 | 56 | Second |
| 39 | HPCC | 2 | Matrix Multiplication (DGEMM) Floating-Point Performance | -2 | TRUE | 8.53E+03 | 4.22E+01 | 22 | 8.36E+03 | 9.18E+01 | 56 | MFLOP per Second |
| 40 | HPCC | 2 | Average STREAM ’Add’ Memory Bandwidth | 14.1 | TRUE | 3.12E+03 | 2.91E+02 | 22 | 3.56E+03 | 6.40E+02 | 56 | MByte per Second |
| 41 | HPCC | 2 | Average STREAM ’Copy’ Memory Bandwidth | 10.9 | TRUE | 4.35E+03 | 3.16E+02 | 22 | 4.82E+03 | 6.27E+02 | 56 | MByte per Second |
| 42 | HPCC | 2 | Average STREAM ’Scale’ Memory Bandwidth | 13.8 | TRUE | 2.92E+03 | 3.09E+02 | 22 | 3.32E+03 | 5.95E+02 | 56 | MByte per Second |
| 43 | HPCC | 2 | Average STREAM ’Triad’ Memory Bandwidth | 16.5 | TRUE | 3.21E+03 | 3.28E+02 | 22 | 3.75E+03 | 6.94E+02 | 56 | MByte per Second |
| 44 | HPCC | 2 | Fast Fourier Transform (FFTW) Floating-Point Performance | -6.4 | TRUE | 1.23E+04 | 6.35E+02 | 22 | 1.16E+04 | 1.65E+03 | 56 | MFLOP per Second |
| 45 | HPCC | 2 | High Performance LINPACK Efficiency | -12.4 | TRUE | 9.62E+01 | 1.01E+01 | 22 | 8.42E+01 | 7.16E+00 | 56 | Percent |
| 46 | HPCC | 2 | High Performance LINPACK Floating-Point Performance | -8.6 | TRUE | 1.22E+05 | 4.85E+02 | 22 | 1.11E+05 | 2.75E+03 | 56 | MFLOP per Second |
| 47 | HPCC | 2 | High Performance LINPACK Run Time | 9.5 | TRUE | 1.24E+02 | 4.94E-01 | 22 | 1.35E+02 | 3.42E+00 | 56 | Second |
| 48 | HPCC | 2 | MPI Random Access | -54 | TRUE | 9.59E+00 | 3.29E-01 | 22 | 4.41E+00 | 2.69E-01 | 56 | MUpdate per Second |
| 49 | HPCC | 2 | Parallel Matrix Transpose (PTRANS) | -9.6 | TRUE | 2.62E+03 | 1.87E+02 | 22 | 2.36E+03 | 3.44E+02 | 56 | MByte per Second |
| 50 | HPCC | 2 | Wall Clock Time | 5.5 | TRUE | 3.45E+02 | 5.41E+00 | 22 | 3.64E+02 | 8.44E+00 | 56 | Second |
| # | Application | Nodes | Metric | Diff., % | Distr. are Different | Before Patch Application | After Patch Application | Units | ||||
| Mean, Seconds | St.Dev., Seconds | Nruns | Mean, Seconds | St.Dev., Seconds | Nruns | |||||||
| 51 | IMB | 2 | Max Exchange Bandwidth | 0.2 | FALSE | 3.90E+03 | 3.60E+01 | 21 | 3.91E+03 | 6.30E+01 | 56 | MByte per Second |
| 52 | IMB | 2 | Max MPI-2 Bidirectional ’Get’ Bandwidth (aggregate) | -0.7 | FALSE | 1.99E+03 | 4.31E+01 | 21 | 1.98E+03 | 5.40E+01 | 56 | MByte per Second |
| 53 | IMB | 2 | Max MPI-2 Bidirectional ’Get’ Bandwidth (non-aggregate) | -2.8 | TRUE | 2.11E+03 | 5.71E+01 | 21 | 2.05E+03 | 4.68E+01 | 56 | MByte per Second |
| 54 | IMB | 2 | Max MPI-2 Bidirectional ’Put’ Bandwidth (aggregate) | 0.4 | FALSE | 2.05E+03 | 6.51E+01 | 21 | 2.06E+03 | 3.02E+01 | 56 | MByte per Second |
| 55 | IMB | 2 | Max MPI-2 Bidirectional ’Put’ Bandwidth (non-aggregate) | -1.7 | TRUE | 2.12E+03 | 3.61E+01 | 21 | 2.08E+03 | 4.37E+01 | 56 | MByte per Second |
| 56 | IMB | 2 | Max MPI-2 Unidirectional ’Get’ Bandwidth (aggregate) | -0.1 | FALSE | 3.10E+03 | 1.45E+01 | 21 | 3.10E+03 | 8.30E+00 | 56 | MByte per Second |
| 57 | IMB | 2 | Max MPI-2 Unidirectional ’Get’ Bandwidth (non-aggregate) | -1 | TRUE | 2.93E+03 | 5.45E+01 | 21 | 2.90E+03 | 5.59E+01 | 56 | MByte per Second |
| 58 | IMB | 2 | Max MPI-2 Unidirectional ’Put’ Bandwidth (aggregate) | 0 | FALSE | 3.12E+03 | 6.18E+00 | 21 | 3.12E+03 | 7.70E+00 | 56 | MByte per Second |
| 59 | IMB | 2 | Max MPI-2 Unidirectional ’Put’ Bandwidth (non-aggregate) | -1.1 | TRUE | 2.96E+03 | 4.11E+01 | 21 | 2.92E+03 | 5.11E+01 | 56 | MByte per Second |
| 60 | IMB | 2 | Max PingPing Bandwidth | -0.1 | FALSE | 2.60E+03 | 3.43E+01 | 21 | 2.60E+03 | 3.00E+01 | 56 | MByte per Second |
| 61 | IMB | 2 | Max PingPong Bandwidth | -0.1 | FALSE | 3.08E+03 | 9.99E+00 | 21 | 3.08E+03 | 7.15E+00 | 56 | MByte per Second |
| 62 | IMB | 2 | Max SendRecv Bandwidth | -0.4 | FALSE | 5.22E+03 | 7.35E+01 | 21 | 5.20E+03 | 7.24E+01 | 56 | MByte per Second |
| 63 | IMB | 2 | Min AllGather Latency | 1.5 | TRUE | 2.54E-06 | 5.12E-08 | 21 | 2.58E-06 | 6.88E-08 | 56 | Second |
| 64 | IMB | 2 | Min AllGatherV Latency | -1 | FALSE | 2.99E-06 | 1.16E-07 | 21 | 2.96E-06 | 6.92E-08 | 56 | Second |
| 65 | IMB | 2 | Min AllReduce Latency | -2.3 | TRUE | 3.02E-06 | 1.22E-07 | 21 | 2.95E-06 | 7.10E-08 | 56 | Second |
| 66 | IMB | 2 | Min AllToAll Latency | 0.9 | TRUE | 2.53E-06 | 3.66E-08 | 21 | 2.55E-06 | 3.56E-08 | 56 | Second |
| 67 | IMB | 2 | Min AllToAllV Latency | 3.8 | TRUE | 3.21E-06 | 3.01E-08 | 21 | 3.33E-06 | 1.14E-07 | 56 | Second |
| 68 | IMB | 2 | Min Barrier Latency | 3.3 | TRUE | 2.41E-06 | 8.48E-08 | 21 | 2.48E-06 | 1.24E-07 | 56 | Second |
| 69 | IMB | 2 | Min Broadcast Latency | -0.7 | FALSE | 2.40E-06 | 2.53E-08 | 21 | 2.39E-06 | 8.71E-08 | 56 | Second |
| 70 | IMB | 2 | Min Gather Latency | -0.4 | FALSE | 2.60E-06 | 9.05E-08 | 21 | 2.59E-06 | 3.39E-08 | 56 | Second |
| 71 | IMB | 2 | Min GatherV Latency | 0.9 | FALSE | 2.44E-06 | 2.10E-08 | 21 | 2.46E-06 | 8.03E-08 | 56 | Second |
| 72 | IMB | 2 | Min MPI-2 ’Accumulate’ Latency (aggregate) | 0.5 | FALSE | 1.00E-06 | 7.08E-08 | 21 | 1.01E-06 | 6.05E-08 | 56 | Second |
| 73 | IMB | 2 | Min MPI-2 ’Accumulate’ Latency (non-aggregate) | 1.8 | FALSE | 6.29E-06 | 2.50E-07 | 21 | 6.40E-06 | 3.00E-07 | 56 | Second |
| 74 | IMB | 2 | Min MPI-2 Window Creation Latency | 0.3 | FALSE | 2.44E-05 | 1.36E-07 | 21 | 2.45E-05 | 2.06E-07 | 56 | Second |
| 75 | IMB | 2 | Min Reduce Latency | 3.5 | TRUE | 2.74E-06 | 6.69E-08 | 21 | 2.84E-06 | 1.05E-07 | 56 | Second |
| 76 | IMB | 2 | Min ReduceScatter Latency | 0.8 | FALSE | 1.65E-06 | 8.98E-08 | 21 | 1.67E-06 | 1.03E-07 | 56 | Second |
| 77 | IMB | 2 | Min Scatter Latency | 1.6 | TRUE | 2.58E-06 | 1.60E-08 | 21 | 2.63E-06 | 5.97E-08 | 56 | Second |
| 78 | IMB | 2 | Min ScatterV Latency | 0.1 | FALSE | 2.54E-06 | 7.85E-08 | 21 | 2.54E-06 | 4.09E-08 | 56 | Second |
| 79 | IMB | 2 | Wall Clock Time | 4 | TRUE | 1.48E+01 | 5.39E-01 | 21 | 1.54E+01 | 1.39E+00 | 56 | Second |
| # | Application | Nodes | Metric | Diff., % | Distr. Can be Distin- gui- shed? | Before Patch Application | After Patch Application | Units | ||||
| Mean, Seconds | l Standard Deviation, Seconds | Nruns | Mean, Seconds | Standard Deviation, Seconds | Nruns | |||||||
| 88 | IOR | 1 | HDF5 Independent N-to-1 File Open Time (Read) | 36.9 | FALSE | 2.13E-01 | 1.30E-01 | 21 | 2.92E-01 | 2.88E-01 | 55 | Second |
| 89 | IOR | 1 | HDF5 Independent N-to-1 File Open Time (Write) | 0.5 | FALSE | 1.65E-01 | 2.06E-01 | 21 | 1.66E-01 | 2.12E-01 | 55 | Second |
| 90 | IOR | 1 | HDF5 Independent N-to-1 Read Aggregate Throughput | -6.3 | FALSE | 1.64E+02 | 2.17E+01 | 21 | 1.53E+02 | 2.04E+01 | 55 | MByte per Second |
| 91 | IOR | 1 | HDF5 Independent N-to-1 Write Aggregate Throughput | -3.7 | FALSE | 1.66E+02 | 2.67E+01 | 21 | 1.60E+02 | 2.26E+01 | 55 | MByte per Second |
| 138 | IOR | 1 | POSIX N-to-N File Open Time (Read) | 1.2 | FALSE | 1.44E+00 | 1.77E+00 | 21 | 1.45E+00 | 1.75E+00 | 55 | Second |
| 139 | IOR | 1 | POSIX N-to-N File Open Time (Write) | -28.9 | TRUE | 4.41E+00 | 2.25E+00 | 21 | 3.14E+00 | 1.99E+00 | 55 | Second |
| 140 | IOR | 1 | POSIX N-to-N Read Aggregate Throughput | 0 | FALSE | 2.32E+02 | 5.47E+00 | 21 | 2.32E+02 | 6.43E+00 | 55 | MByte per Second |
| 141 | IOR | 1 | POSIX N-to-N Write Aggregate Throughput | 14.6 | TRUE | 2.33E+02 | 4.37E+01 | 21 | 2.67E+02 | 3.47E+01 | 55 | MByte per Second |
| 142 | IOR | 1 | Wall Clock Time | 3.9 | TRUE | 1.88E+02 | 9.41E+00 | 21 | 1.96E+02 | 1.17E+01 | 55 | Second |
| 151 | IOR | 2 | HDF5 Independent N-to-1 File Open Time (Read) | -18.2 | FALSE | 7.01E-01 | 1.10E+00 | 22 | 5.74E-01 | 6.34E-01 | 56 | Second |
| 152 | IOR | 2 | HDF5 Independent N-to-1 File Open Time (Write) | 4.1 | FALSE | 2.24E-01 | 1.35E-01 | 22 | 2.33E-01 | 1.86E-01 | 56 | Second |
| 153 | IOR | 2 | HDF5 Independent N-to-1 Read Aggregate Throughput | -1.9 | FALSE | 1.95E+02 | 2.29E+01 | 22 | 1.92E+02 | 2.06E+01 | 56 | MByte per Second |
| 154 | IOR | 2 | HDF5 Independent N-to-1 Write Aggregate Throughput | -3.6 | FALSE | 1.59E+02 | 2.48E+01 | 22 | 1.54E+02 | 2.28E+01 | 56 | MByte per Second |
| 201 | IOR | 2 | POSIX N-to-N File Open Time (Read) | 26.6 | FALSE | 3.06E+00 | 3.08E+00 | 22 | 3.88E+00 | 3.06E+00 | 56 | Second |
| 202 | IOR | 2 | POSIX N-to-N File Open Time (Write) | -20 | FALSE | 8.43E+00 | 3.29E+00 | 22 | 6.75E+00 | 3.92E+00 | 56 | Second |
| 203 | IOR | 2 | POSIX N-to-N Read Aggregate Throughput | 0.2 | FALSE | 2.67E+02 | 3.25E+00 | 22 | 2.68E+02 | 2.43E+00 | 56 | MByte per Second |
| 204 | IOR | 2 | POSIX N-to-N Write Aggregate Throughput | 3.2 | FALSE | 2.29E+02 | 3.33E+01 | 22 | 2.36E+02 | 3.17E+01 | 56 | MByte per Second |
| 205 | IOR | 2 | Wall Clock Time | 1.5 | FALSE | 3.71E+02 | 1.22E+01 | 22 | 3.77E+02 | 1.95E+01 | 56 | Second |
| 214 | IOR.local | 1 | HDF5 Independent N-to-1 File Open Time (Read) | 7.6 | TRUE | 5.57E-02 | 3.66E-03 | 12 | 5.99E-02 | 4.41E-03 | 56 | Second |
| 215 | IOR.local | 1 | HDF5 Independent N-to-1 File Open Time (Write) | 18.4 | TRUE | 5.60E-02 | 3.42E-03 | 12 | 6.63E-02 | 7.70E-03 | 56 | Second |
| 216 | IOR.local | 1 | HDF5 Independent N-to-1 Read Aggregate Throughput | -1.1 | FALSE | 2.61E+03 | 6.21E+01 | 12 | 2.58E+03 | 3.94E+01 | 56 | MByte per Second |
| 217 | IOR.local | 1 | HDF5 Independent N-to-1 Write Aggregate Throughput | -2.4 | FALSE | 2.90E+01 | 2.05E+00 | 12 | 2.84E+01 | 1.79E+00 | 56 | MByte per Second |
| 264 | IOR.local | 1 | POSIX N-to-N File Open Time (Read) | -1.9 | FALSE | 4.95E-02 | 5.36E-03 | 12 | 4.85E-02 | 3.67E-03 | 56 | Second |
| 265 | IOR.local | 1 | POSIX N-to-N File Open Time (Write) | 12.5 | TRUE | 4.86E-02 | 5.50E-03 | 12 | 5.47E-02 | 7.31E-03 | 56 | Second |
| 266 | IOR.local | 1 | POSIX N-to-N Read Aggregate Throughput | -11.3 | TRUE | 2.73E+03 | 3.23E+01 | 12 | 2.42E+03 | 4.63E+02 | 56 | MByte per Second |
| 267 | IOR.local | 1 | POSIX N-to-N Write Aggregate Throughput | -4.1 | TRUE | 9.13E+02 | 5.07E+01 | 12 | 8.76E+02 | 6.76E+01 | 56 | MByte per Second |
| 268 | IOR.local | 1 | Wall Clock Time | 2.2 | FALSE | 4.63E+02 | 1.64E+01 | 12 | 4.73E+02 | 1.90E+01 | 56 | Second |
| # | Application | Nodes | Metric | Diff., % | Distr. Can be Distin- gui- shed? | Before Patch Application | After Patch Application | Units | ||||
| Mean, Seconds | l Standard Deviation, Seconds | Nruns | Mean, Seconds | Standard Deviation, Seconds | Nruns | |||||||
| 272 | MDTest | 1 | Directory creation (single tree directory) | -15.1 | TRUE | 8.55E+03 | 3.26E+02 | 21 | 7.26E+03 | 3.91E+02 | 56 | Operations/Second |
| 276 | MDTest | 1 | Directory removal (single tree directory) | -16 | TRUE | 2.02E+04 | 7.18E+02 | 21 | 1.70E+04 | 7.99E+02 | 56 | Operations/Second |
| 280 | MDTest | 1 | Directory stat (single tree directory) | -18.4 | FALSE | 1.90E+05 | 7.09E+04 | 21 | 1.55E+05 | 6.58E+04 | 56 | Operations/Second |
| 284 | MDTest | 1 | File creation (single tree directory) | -12.3 | TRUE | 8.09E+03 | 3.13E+02 | 21 | 7.10E+03 | 3.59E+02 | 56 | Operations/Second |
| 288 | MDTest | 1 | File read (single tree directory) | -12.7 | TRUE | 3.28E+04 | 1.96E+03 | 21 | 2.86E+04 | 2.06E+03 | 56 | Operations/Second |
| 292 | MDTest | 1 | File removal (single tree directory) | -15.5 | TRUE | 1.33E+04 | 6.72E+02 | 21 | 1.13E+04 | 5.09E+02 | 56 | Operations/Second |
| 305 | MDTest | 1 | Wall Clock Time | 24.1 | TRUE | 3.05E+01 | 3.17E+00 | 21 | 3.78E+01 | 4.10E+00 | 56 | Second |
| 309 | MDTest | 2 | Directory creation (single tree directory) | -9.8 | TRUE | 4.30E+03 | 2.38E+02 | 23 | 3.88E+03 | 3.44E+02 | 55 | Operations/Second |
| 313 | MDTest | 2 | Directory removal (single tree directory) | -8.5 | TRUE | 3.27E+03 | 2.92E+02 | 23 | 2.99E+03 | 2.68E+02 | 55 | Operations/Second |
| 317 | MDTest | 2 | Directory stat (single tree directory) | -10.3 | TRUE | 2.81E+04 | 1.86E+03 | 23 | 2.53E+04 | 2.25E+03 | 55 | Operations/Second |
| 321 | MDTest | 2 | File creation (single tree directory) | -7.3 | TRUE | 2.25E+03 | 1.08E+02 | 23 | 2.09E+03 | 1.67E+02 | 55 | Operations/Second |
| 325 | MDTest | 2 | File read (single tree directory) | -24.4 | TRUE | 5.94E+04 | 2.90E+03 | 23 | 4.50E+04 | 4.92E+03 | 55 | Operations/Second |
| 329 | MDTest | 2 | File removal (single tree directory) | -10.5 | TRUE | 1.62E+03 | 1.25E+02 | 23 | 1.45E+03 | 9.63E+01 | 55 | Operations/Second |
| 333 | MDTest | 2 | File stat (single tree directory) | -10 | TRUE | 2.19E+04 | 1.62E+03 | 23 | 1.97E+04 | 1.28E+03 | 55 | Operations/Second |
| 342 | MDTest | 2 | Wall Clock Time | 9.7 | TRUE | 1.67E+02 | 3.60E+00 | 23 | 1.83E+02 | 5.30E+00 | 55 | Second |
| 346 | MDTest.local | 1 | Directory creation (single tree directory) | 2 | FALSE | 1.04E+05 | 7.44E+03 | 12 | 1.06E+05 | 8.49E+03 | 56 | Operations/Second |
| 350 | MDTest.local | 1 | Directory removal (single tree directory) | -11.1 | TRUE | 1.30E+05 | 3.70E+03 | 12 | 1.15E+05 | 1.08E+04 | 56 | Operations/Second |
| 354 | MDTest.local | 1 | Directory stat (single tree directory) | -25.6 | TRUE | 1.92E+06 | 5.72E+04 | 12 | 1.43E+06 | 4.68E+04 | 56 | Operations/Second |
| 358 | MDTest.local | 1 | File creation (single tree directory) | -10.9 | TRUE | 1.79E+05 | 1.45E+04 | 12 | 1.59E+05 | 1.54E+04 | 56 | Operations/Second |
| 362 | MDTest.local | 1 | File read (single tree directory) | -25.1 | TRUE | 1.39E+06 | 3.10E+04 | 12 | 1.04E+06 | 2.62E+04 | 56 | Operations/Second |
| 366 | MDTest.local | 1 | File removal (single tree directory) | -8.6 | TRUE | 2.08E+05 | 7.99E+03 | 12 | 1.90E+05 | 1.53E+04 | 56 | Operations/Second |
| 370 | MDTest.local | 1 | File stat (single tree directory) | -26.3 | TRUE | 1.92E+06 | 5.17E+04 | 12 | 1.41E+06 | 2.97E+04 | 56 | Operations/Second |
| 379 | MDTest.local | 1 | Wall Clock Time | 78.6 | TRUE | 3.75E+00 | 6.22E-01 | 12 | 6.70E+00 | 2.61E+00 | 56 | Second |