Does the X-ray outflow quasar PDS 456 have a UV outflow at 0.3c?
Abstract
The quasar PDS 456 (at redshift 0.184) has a prototype ultra-fast outflow (UFO) measured in X-rays. This outflow is highly ionized with relativistic speeds, large total column densities , and large kinetic energies that could be important for feedback to the host galaxy. A UV spectrum of PDS 456 obtained with the Hubble Space Telescope in 2000 contains one well-measured broad absorption line (BAL) at 1346 Å (observed) that might be Ly at v or N v 1240 at v. However, we use photoionisation models and comparisons to other outflow quasars to show that these BAL identifications are problematic because other lines that should accompany them are not detected. We argue that the UV BAL is probably C iv 1549 at v. This would be the fastest UV outflow ever reported, but its speed is similar to the X-ray outflow and its appearance overall is similar to relativistic UV BALs observed in other quasars. The C iv BAL identification is also supported indirectly by the tentative detection of another broad C iv line at v. The high speeds suggest that the UV outflow originates with the X-ray UFO crudely 20 to 30 from the central black hole. We speculate that the C iv BAL might form in dense clumps embedded in the X-ray UFO, requiring density enhancements of only 0.4 dex compared clumpy structures already inferred for the soft X-ray absorber in PDS 456. The C iv BAL might therefore be the first detection of low-ionisation clumps proposed previously to boost the opacities in UFOs for radiative driving.
keywords:
line: formation – quasars: individual: PDS 456 – quasars: absorption lines – quasars: general1 Introduction
Accretion disk outflows are an important part of the quasar phenomenon that might drive “feedback" to regulate black hole growth and host galaxy evolution (e.g., Di Matteo et al., 2005; Hopkins et al., 2008; Hopkins & Elvis, 2010; Debuhr et al., 2012; Rupke & Veilleux, 2013). The outflows are often studied in the rest-frame UV via blueshifted broad absorption lines (BALs) or their narrower cousins called “mini-BALs” (with a nominal boundary near full width at half minimum FWHM km s-1, Weymann et al., 1991; Korista et al., 1993; Crenshaw et al., 2003; Hamann & Sabra, 2004; Trump et al., 2006; Knigge et al., 2008; Gibson et al., 2009, and refs. therein). These features appear most often at moderate velocity shifts v, but relativistic BALs and mini-BALs at v–0.2 have been measured in a small but growing number of quasars (Hamann et al., 1997a; Hamann et al., 2013; Rodríguez Hidalgo, 2008; Rodríguez Hidalgo et al., 2011; Rogerson et al., 2016).
The basic physical properties for these outflows can be difficult to determine due to limited wavelength coverage and line saturation that is masked by partial line-of-sight covering of the background light source(s). The strongest measured UV lines111Throughout this paper we treat unresolved doublets as single lines, such that, for example, C iv 1548,1551 becomes C iv1549 with a summed oscillator strength (for column density estimates). are typically C iv 1549, N v 1240, and O vi 1034, indicating moderate to high degrees of ionisation. The maximum ionisations are not known, but there might be a wide range. O vi absorption tends to be as strong or stronger than C iv (Section 3.4 below, also Baskin et al., 2013; Moravec et al., 2017, Herbst et al., in prep.) and higher-ionisation lines such as Ne viii 774 and Mg x 615 have been observed in a few cases with suitable spectral coverage (e.g., Hamann et al., 1997b; Telfer et al., 1998; Arav et al., 2001). Measurements of the low-abundance line P v 1121 help to overcome the saturation issues to reveal generally large total hydrogen column densities, , across a wide range observed BAL strengths (Hamann, 1998; Leighly et al., 2009; Leighly et al., 2011; Borguet et al., 2012; Capellupo et al., 2014; Capellupo et al., 2017; Moravec et al., 2017, but see also Arav et al. 2001).
X-ray observations have revealed another variety of ultra-fast outflows (UFOs) that reach relativistic speeds in luminous quasars (Chartas et al., 2002; Chartas et al., 2009; Reeves et al., 2009; Gofford et al., 2013, 2015; Tombesi et al., 2010, 2013, and refs. therein). UFOs are also challenging to study because they are highly variable and highly-ionised to the point where the only strong absorption features appear at X-ray wavelengths. They are often characterized by Fe K-shell absorption features with derived total column densities in the range to 24 (see refs. above). UFOs also appear to have generally very large kinetic energies, sufficient to drive feedback effects in the quasar host galaxies (Tombesi et al., 2012, 2013; Gofford et al., 2014; Gofford et al., 2015; Reeves et al., 2014).
The quasar PDS 456 (at redshift ) has the best-studied example of a powerful, relativistic X-ray UFO (e.g., Reeves et al., 2003, 2009, 2014; Reeves et al., 2016; Nardini et al., 2015; Gofford et al., 2014; Matzeu et al., 2017). It is the most luminous quasar in the local universe, with bolometric luminosity ergs s-1 and estimated black hole mass M⊙ that together indicate an accretion rate relative to Eddington that is and perhaps near unity (Nardini et al., 2015). The X-ray absorber is complex and highly variable, with two main components. The main component measured via Fe K-shell absorption has speeds in the range v–0.34, very high degrees of ionisation featuring Fe xxv and Fe xxvi, and large total column densities (Reeves et al., 2014; Gofford et al., 2014; Gofford et al., 2015; Nardini et al., 2015). Its radial distance from the black hole is estimated at a few hundred gravitational radii (based on absorber variability, e.g., Nardini et al., 2015). The kinetic power of this outflow is also remarkably large, crudely 20 percent of the bolometric luminosity, which is well above the threshold needed for feedback to the host galaxy (Gofford et al., 2014; Nardini et al., 2015, and refs. therein). The second outflow component measured in soft X-rays has somewhat lower speeds, v–0.27, lower ionisations, and column densities in the range to 23 (Reeves et al., 2016). There is evidence for time-variable covering fractions in this absorber that might be indicative of small dense clumps or substructures embedded in the overall X-ray outflow (Matzeu et al., 2016).
PDS 456 also has signatures of outflow in the UV. A UV spectrum obtained in 2000 by O’Brien et al. (2005) using the Space Telescope Imaging Spectrometer (STIS) on board the Hubble Space Telescope (HST) revealed a highly blueshifted C iv broad emission line at speeds near v km s-1 plus a single BAL that might plausibly be Ly or N v at v or 0.08, respectively. These UV features provide further evidence for exotic mass loss from PDS 456 across a wide range of spatial scales, from the X-ray UFO that is believed to originate near the black hole at radii of – (gravitational radii, corresponding to 0.001–0.0015 pc Nardini et al., 2015; Matzeu et al., 2017) to an outflow-dominated C iv broad emission-line region that we place crudely at 0.3 pc (based on scaling relations with luminosity, Kaspi et al. 2005, for a 109 M⊙ black hole). The UV BAL is an important component to this outflow picture, but its measured speed and physical nature depend critically on the line identification.
In this paper, we reexamine the UV BAL in PDS 456 with the main result that it is likely to be C iv 1549 at v. This would be the fastest UV outflow line ever reported but similar in speed to the X-ray UFO in this quasar. Throughout this paper, we adopt a redshift for PDS 456 of based on the emission line [Fe ii] 1.6435 m measured by Simpson et al. (1999). We describe two archival HST spectra of PDS 456 in Section 2 below. Section 3 presents our analysis and measurements of the observed BAL, comparisons to photoionisation models, comparisons to UV BALs in other quasars, and a discussion of the plausible BAL identifications. Section 4 presents a summary and discussion of the results.
2 HST Spectra
Figure 1 shows the spectrum of PDS 456 obtained by O’Brien et al. (2005) in 2000 using HST-STIS with the G140L and G230L gratings. We obtained this spectrum and another HST spectrum measured in 2014 (described below) from the Mikulski Archive for Space Telescopes (MAST). We present them here without further processing. The STIS G140L grating provided wavelength coverage from 1137 Å to 1715 Å at resolutions ranging from 310 km s-1 to 200 km s-1, while STIS G230L covered 1580 Å to 3148 Å at resolutions from 640 km s-1 to 300 km s-1 (see O’Brien et al. 2005 for more details). The spectrum plotted in Figure 1 is combined from the two gratings by masking out the extreme ends of the wavelength coverage to avoid excessive noise and then calculating variance-weighted average fluxes at the remaining wavelengths of overlap.
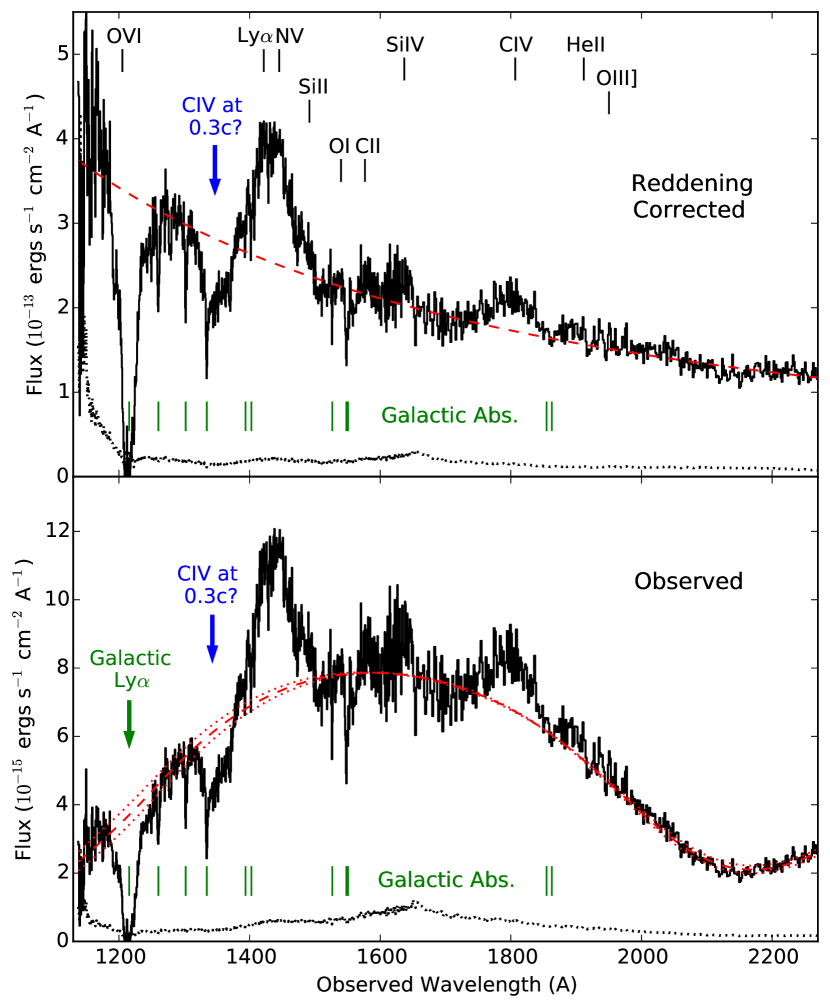
The UV spectrum of PDS 456 is substantially reddened by dust in our Galaxy (due to the quasar’s sky position near the Galactic plane). Previous studies based on visible spectra and photometry indicate that the visual extinction towards PDS 456 is magnitudes, corresponding to selective extinction for a standard Galactic reddening curve (Torres et al., 1997; Simpson et al., 1999). We obtain an independent estimate of the reddening by fitting the UV continuum with a single power law modified by the Galactic extinction curve from Cardelli et al. (1989) with . The fit is constrained by the median flux in wavelength windows between 1170 Å and 2400 Å that avoid strong emission and absorption lines. The dashed red curve in Figure 1 shows our preferred fit using and power law index (for ). An important feature of Galactic extinction at these wavelengths is the “bump” at 2175 Å. We experimented with different fit parameters (e.g., the dotted red curves in Figure 1), but the values of and the power law slope are well constrained222We note, however, that the observed spectrum is poorly fit at wavelengths 2400 Å (observed). This might be caused by reddening in the quasar environment, a break in the intrinsic/emitted spectral slope, and/or blended Fe ii emission lines that are known to be strong in PDS 456 (Simpson et al., 1999). We do not investigate this further because our goal is simply to define a continuum for analysis of the outflow lines at shorter wavelengths (Section 3). by the data because Galactic reddening curves with a strong 2175 Å bump suppress the flux at both ends of the spectral coverage shown in Figure 1. The top panel in this figure shows the reddening-corrected spectrum of PDS 456 together with the best-fit power law.
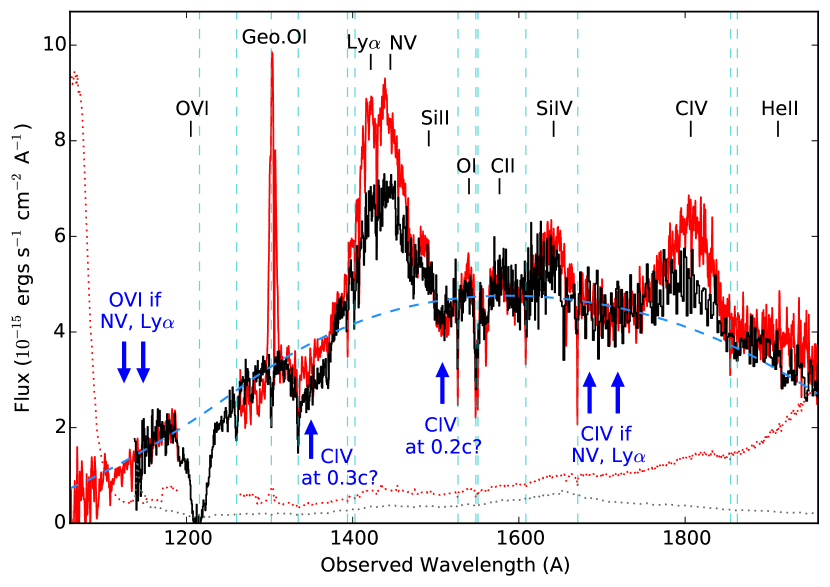
Figure 2 shows a previously-unpublished spectrum of PDS 456 obtained in 2014 with HST-COS using the G140L grating (PI: O’Brien). This spectrum (shown by the red curve) is plotted on top of the HST-STIS spectrum (black curve) from Figure 1 with no reddening corrections. It is combined from separate exposures totaling 5186 seconds. The spectral resolution ranges from roughly 200 km s-1 to 100 km s-1 from blue to red across the wavelengths shown in Figure 2. A gap in the COS wavelength coverage from 1170 Å to 1265 Å avoids Galactic/geocoronal Ly absorption/emission. The blue arrows in Figures 1 and 2 mark the positions of observed or expected absorption lines discussed in Section 3 below
3 Analysis
3.1 The UV BAL at 1346 Å
The HST-STIS spectrum in Figure 1 clearly shows a BAL at 1346 Å (observed), as reported by O’Brien et al. (2005). Figure 3 plots this spectrum again after normalizing by the reddened power law in Figures 1 and 2. We fit the BAL in this normalized spectrum using a simple Gaussian optical depth profile of the form
| (1) |
where is the line-center optical depth, v is the velocity shift from line center, and is the doppler parameter that sets the line width. The BAL fit shown by the magenta curve in Figure 3 yields , km s-1, and observed line-center wavelength Å (where the errors quoted are 1 uncertainties returned by the line-fitting routine). The full width at half minimum of this fitted profile is FWHM km s-1. In the quasar frame, the fit has rest equivalent width REW Å.

Our study concerns identification of the 1346 Å BAL trough. One possibility favored by O’Brien et al. (2005) is Ly 1216 at velocity shift v (18,000 km s-1). Another is N v 1240 at v. These identifications seem reasonable because the observed BAL is on the blue side of the Ly–N v emission-line blend and the inferred velocities are in a normal range for BAL outflows in other quasars. However, we will argue below (Section 3.5 and Section 3.6) that the Ly or N v identifications are problematic because they are not accompanied by C iv and O vi 1034 BALs at the same velocity shifts. The absence of these other lines is illustrated by the other orange and magenta curves in Figure 3, which show our fit to the observed BAL transposed to the positions expected for accompanying C iv and O vi BALs . At the C iv positions, the transposed BAL fit is shown twice – once at full strength and once at 1/3 of its measured strength at 1346 Å. We estimate that the 1/3 scalings represent approximate upper limits to C iv BALs that might accompany a N v or Ly BAL at 1346 Å. We will argue below that the absence O vi and C iv absorption at these wavelengths suggests that the BAL at 1346 Å is actually C iv 1549 at v.
We test these line identifications using photoionisation models (Section 3.3) and comparisons to BALs/mini-BALs observed in other quasars (Section 3.4). First we estimate ionic column densities for each possible identification. These estimates follow from the fitted Gaussian optical depth profile by
| (2) |
where is the ionic column density, and are the oscillator strength and rest-frame wavelength of the transition, and we assume implicitly that the ground-state column density equals the ionic column density. Thus we find that, if the observed BAL is Ly, it corresponds to a neutral hydrogen column density of . If the BAL is N v or C iv, then the column density is or , respectively. The uncertainties in these estimates depend mainly on the continuum placement used for the BAL profile fit. Experiments with different continua suggest that the maximum uncertainties are roughly 0.1 dex.
It is important to note that the line optical depth and column densities derived above are only lower limits because BAL outflows often exhibit saturation with partial line-of-sight covering of the background light source. This can lead to weak/shallow absorption-line troughs even if the optical depths are large (e.g., Hamann, 1998; Hamann & Sabra, 2004; Arav et al., 2005; Capellupo et al., 2017; Moravec et al., 2017, and refs. therein). In one recent study, Herbst et al. (in prep.) used median composite spectra of BAL quasars from the Baryon Oscillation Sky Survey (BOSS, Dawson et al. 2013; Ross et al. 2012, part of the Sloan Digital Sky Survey-III, SDSS-III, Eisenstein et al. 2011) to show that the low-abundance doublet P v 1118,1128 is often present and that widely-separated doublets like P v, Si iv 1393,1402, and O vi 1032,1038 have 1:1 doublet ratios across a wide range of BAL strengths. These results indicate that all of the commonly measured BALs of abundant ions in quasar spectra, e.g., C iv 1549, N v 1240 and O vi 1034, are typically saturated and the observed depths of the BAL troughs are controlled mainly by the line-of-sight covering fractions.
3.2 Other UV Outflow Features
In addition to the UV BAL at 1346 Å, there are two other features in the 2000 HST-STIS spectrum that point to extreme outflows in PDS 456. First, as noted previously by O’Brien et al. (2005), the broad C iv emission line is extremely blueshifted. Our simple Gaussian fit to this feature shown in Figure 3 indicates that the line centroid is blueshifted by km s-1 (consistent with the O’Brien et al. 2005 measurement). This fit also yields a rest equivalent width of REW Å and a large velocity width of FWHM km s-1 (not corrected for the 500 km s-1 doublet separation in C iv). The low-ionisation emission lines O i 1304 and C ii 1335 are poorly measured in this spectrum compared to C iv, but they are clearly less blueshifted. We crudely estimate their centroid blueshifts by visual inspection to be km s-1.
The large C iv emission-line blueshift identifies an outflow-dominated broad emission-line region with an unusually high outflow speed. At km s-1, the C iv blueshift is outside of the range of values reported by Coatman et al. (2016) for a sample of 31,157 luminous SDSS quasars (see also Richards et al., 2011). However, we can crudely estimate by extrapolation from their Figure 1 that the C iv blueshift in PDS 456 is in the upper 0.1 percent of luminous quasars. To our knowledge, it is matched in the literature only by a few luminous extremely red quasars (ERQs) discovered in SDSS-III/BOSS to have prodigious outflows include BALs in the UV and highly blueshifted [OIII] 5007 emission lines (Hamann et al., 2017; Zakamska et al., 2016, Perrotta et al., in prep.). We will present a more thorough analysis of the C iv blueshift in a future paper. Here we note simply that large blueshifts are known to correlate with small emission-line REWs and intrinsically weak X-ray emissions (compared to other quasars/AGN at similar luminosities, e.g., Leighly, 2004; Leighly et al., 2007; Wu et al., 2011, 2012; Richards et al., 2011; Luo et al., 2015). In addition, the work by Coatman et al. (2016) supports speculation in the ERQ studies that large blueshifts and other prominent outflow features are related to high accretion rates (high Eddington ratios) in the quasars.
Another tentative outflow feature in the 2000 HST-STIS spectrum is a weak BAL marginally detected at 1513 Å (observed, see Figures 2 and 3). The reality of this feature depends on the continuum placement, but it is clearly below our best guess at the continuum and might be stronger in the HST-COS 2014 spectrum (Figure 2). There is also tentative absorption near 1560 Å, but this feature is blended with telluric C iv absorption at 1549 Å and it appears to be much narrower than the BAL candidate at 1513 Å. Fits to the BAL candidate at 1513 Å are poorly constrained, but multiple trials indicate a central wavelength of Å, FWHM km s-1, and REW Å in the quasar frame. If this BAL is real, the only plausible identification is C iv at v (The leading alternative, S iv 1398 at v is ruled out by the absence of C iv absorption at the same velocity shift. See Rodríguez Hidalgo et al. 2011; Hamann et al. 2013).
3.3 Cloudy Simulations
We use the photoionisation and spectral synthesis code Cloudy version 17.00 (Ferland et al., 2013, 2017) to predict absorption-line strengths for different physical conditions that might produce the observed BAL at 1346 Å. The calculations assume twice solar metallicity and a fixed hydrogen density of cm-3. The specific density has no bearing on our results (e.g., Hamann, 1997). The metallicity can affect mainly the metal line strengths relative to the Lyman lines. We choose twice-solar metallicity to be crudely consistent with other studies of the outflows and broad emission-line environments of luminous quasars (Hamann & Ferland, 1999; Dietrich et al., 2002; Warner et al., 2004; Nagao et al., 2006; Gabel et al., 2005a, e.g.,). The clouds are irradiated by a standard quasar ionising spectrum consistent with measurements of PDS 456 (e.g., Nardini et al., 2015). This spectrum is defined by power laws across optical-UV and X-ray wavelengths with slopes of and , respectively (for ). The two power laws are joined smoothly in the far-UV by an exponential Wien function with temperature = 250,000 K. The relative strengths of the UV and X-ray spectral segments are set by a two-point power-law index between 2500 Å and 2 keV equal to (Strateva et al., 2005; Steffen et al., 2006). This spectrum is defined in Cloudy by the command: AGN T=250000K, a(ox)=-1.8, a(uv)=-0.5, a(x)=-1.3. The flux of hydrogen ionising radiation incident on the model clouds is set by the ionisation parameter,
| (3) |
where is the distance from the quasar light source and is the total emitted luminosity of hydrogen-ionising photons (#/s). Other aspects of the calculations are described below.
3.4 A Comparison Outflow Sample
Here we construct a sample of outflow quasars from SDSS-III/BOSS that can be useful analogues to test the BAL identification in PDS 456. We specifically use data from the BOSS quasar catalog for data release 12 (DR12, Pâris et al., 2017) to select quasars with the following properties: 1) We require that the BOSS spectra have signal-to-noise ratios SNR 5 at 1700 Å (quasar frame). 2) The emission-line redshifts must be to place the outflow lines of C iv, N v and Ly within the BOSS wavelength coverage at speeds up to at least 0.1. Nearly 2/3 of the selected quasars have such that O vi 1034 is also covered. 3) The quasars must have broad C iv outflow lines (BALs or mini-BALs) characterized by balnicity index BI 3000 km s-1 and absorption index AI 1000 km s-1, both measured at 4 confidence (see Pâris et al., 2017, and refs. therein for definitions of BI and AI). These parameter limits are designed to exclude strong/deep C iv BALs (with large BI) as well as very narrow C iv lines with FWHMs several hundred km s-1 (with small AI) that do not resemble the observed feature in PDS 456. Note that broad outflow lines are recorded in the BOSS quasar catalog only at velocity shifts . 4) The minimum velocity recorded on the red side of the BAL/mini-BAL troughs is v 6000 km s-1 (as specified by the AI integration limit vmin_civ_450 6000). This avoids broad lines near v that can have different profiles and other properties compared to higher-velocity BALs and mini-BALs. The specific value of 6000 km s-1 is a compromise that requires a substantial velocity shift while still maintaining a large sample size. Finally, 5) we reject a small fraction of the quasars (10 percent) that have damped Ly absorption (DLAs) or strong sub-DLAs at the wavelengths of interest (based on our own visual inspections of the spectra).
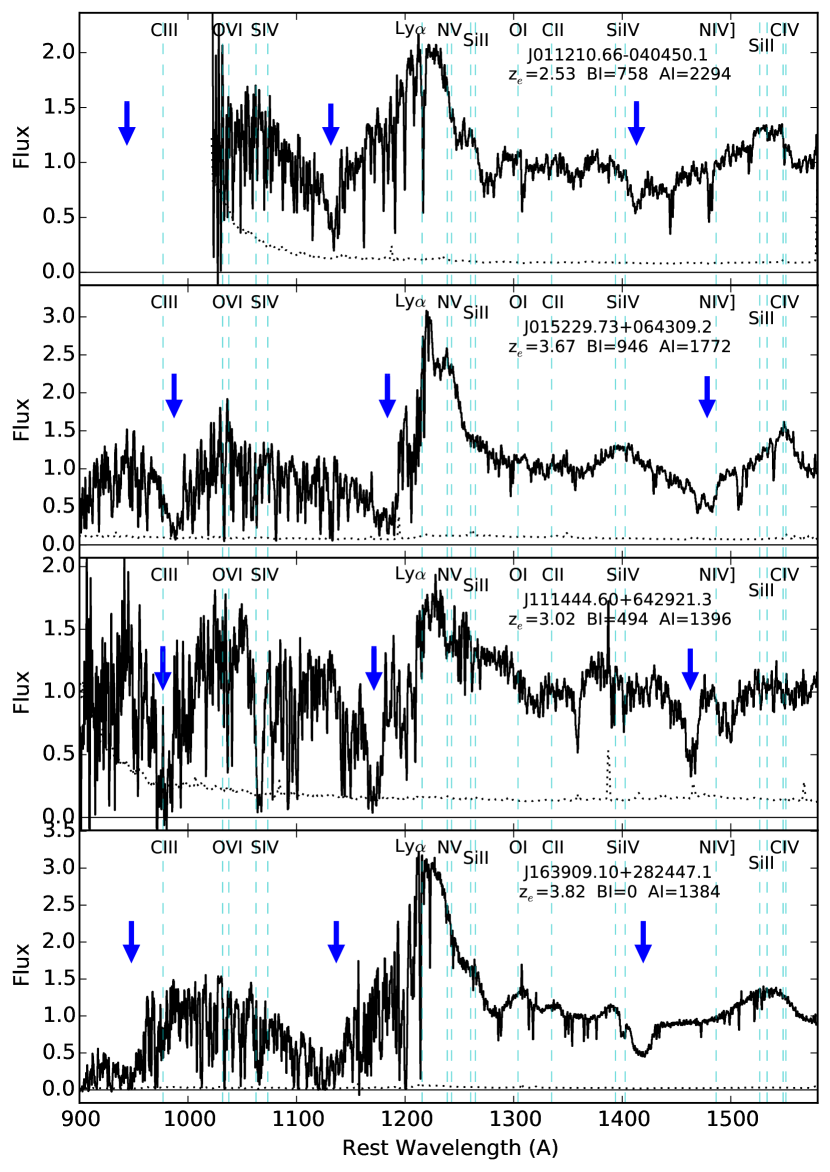
The final sample includes 641 quasars at median redshift and median absolute -band magnitude . We visually inspect all of the quasar spectra to assess the strengths of prominent outflow lines for comparison to PDS 456. At these redshifts and velocity shifts, the N v, Ly, and O vi outflow lines are inevitably blended with unrelated absorption features in the Ly forest. However, in most cases, the outflow lines are clearly discernible because they are much broader than the forest features. Figure 4 shows spectra of four quasars we find to have the strongest well-measured N v outflow lines relative to C iv in our BOSS sample. These extreme cases with large N v/C iv are useful for our discussions of the BAL identification in PDS 456 (e.g., Section 3.6).
It is also useful to consider the median outflow line properties in the BOSS sample. Thus we construct a median composite spectrum in the outflow absorber frame for all 641 quasars. This composite “averages out” the Ly forest contamination to reveal the typical outflow line strengths and profiles across the sample. The result is shown in Figure 5. We derive an absorber redshift for each quasar from the wavelength of minimum flux between the limits of the C iv AI integration (e.g., between vmin_civ_450 and vmax_civ_450) in smoothed versions of the BOSS spectra. The composite is then constructed by normalizing each spectrum to a continuum flux near 1700 Å and then shifting to the absorber frame before calculating the median. We remove broad emission lines from the final outflow quasar composite spectrum by dividing by another composite spectrum of 7700 BOSS quasars with similar redshifts and absolute magnitudes (Mi) but without broad outflow lines in their spectra. The redshifts of these non-outflow quasars are randomly displaced to match the distribution of shifts used to place the outflow quasars in the absorber frame. A simple division then yields the final composite spectrum shown in Figure 5. See Baskin et al. (2013), Baskin et al. (2015), and Herbst et al. (in prep.) for more discussion of this procedure.
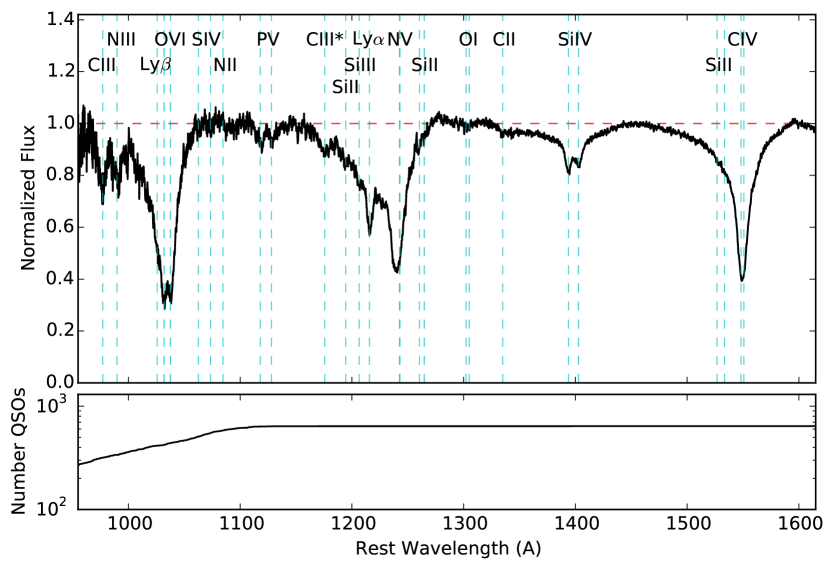
The main result from Figure 5 is that the O vi 1034, N v 1240, and C iv 1549 outflow lines have roughly similar strengths while Ly (in the blue wing of N v) is substantially weaker. This represents the typical situation for luminous quasars with BALs/mini-BALs crudely similar to the BAL in PDS 456. Another interesting result in Figure 5 is the significant presence of P v 1121 absorption and the resolved doublets with 1:1 ratios in O vi, P v, and Si iv. This supports the claim by Herbst et al. (in prep.) that BAL/mini-BAL outflows often have large total column densities and saturated absorption in all of the prominent lines.
3.5 Problems with the Ly Identification
Figure 6 shows theoretical line-center optical depths from our Cloudy simulations (Section 3.2) for lines that should accompany a Ly BAL at 1346 Å in PDS 456. In particular, the solid curves show the optical depths for lines with km s-1 formed in clouds with a range of ionisation parameters, , but with neutral hydrogen column densities held fixed at the derived value of (Section 3.1). These predictions should be considered lower limits because derived from the data is a lower limit. Holding constant in the calculations leads to model clouds that have larger total hydrogen column densities, , at larger . The values for each are shown across the top of the figure.
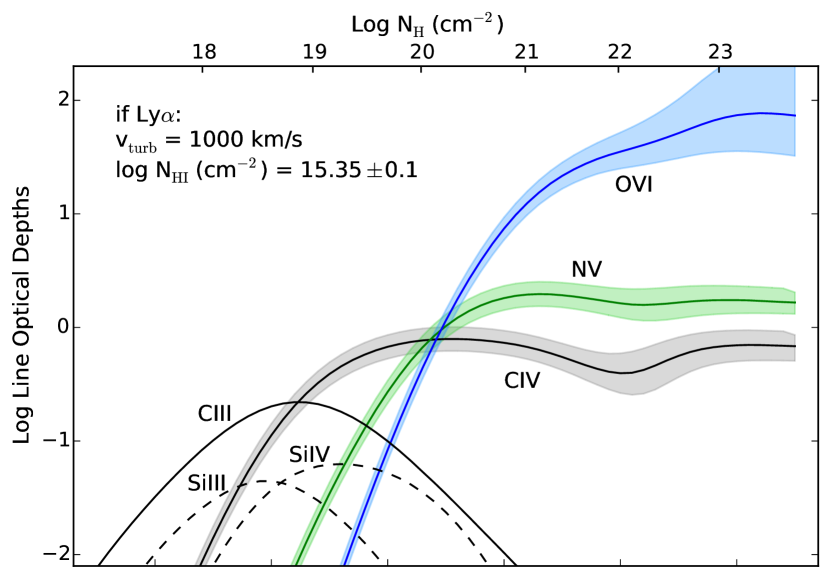
The shaded regions around the curves for C iv, N v, and O vi in Figure 6 illustrate their dependence on the specific values of and the turbulent velocity, vturb, used in the calculations. The solid curves for these lines (and the solid and dashed curves for C iii 977, Si iii 1206, and Si iv1398) correspond to fiducial parameters and v km s-1. In the top panel, the shaded regions show the range of optical depths corresponding to the maximum uncertainty of dex in our measurement (see Section 3.1, where the smaller/larger value sets the lower/upper envelope to the shaded curves). The optical depth changes in response to these changes in are non-linear at large (and large ) because of radiative shielding in the far-UV that affects each ion differently. These shielding effects maintain significant optical depths in the moderate ions C iv, N v, and O vi at a fixed and large . In other calculations (not shown), we determine that the threshold for important shielding effects at large is roughly . This is 0.55 dex lower than our lower limit to the H i column density inferred from the observed BAL (Section 3.1), and therefore the predictions in Figure 6 that result from shielding at large should be applicable.
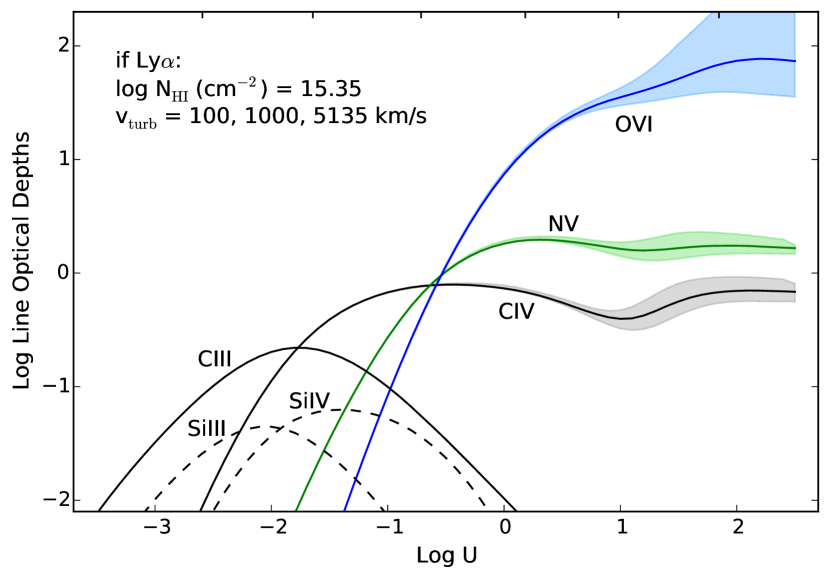
Another parameter that can affect radiative shielding is the velocity dispersion inside the cloud, which we characterize by the turbulence velocity vturb. Large internal velocity dispersions can enhance the shielding by blending together numerous absorption lines in the far-UV, which in turn affects the ionisation structure deep in the cloud. The shaded regions around the C iv, N v, and O vi curves in the bottom panel of Figure 6 depict a range of results corresponding to v km s-1, which yields negligible line shielding (the bottom envelope of the shaded regions), up to v km s-1, which yields the maximum line shielding allowed by the observed BAL width (the upper envelope of the shaded regions). We adopt an intermediate value v km s-1 as our fiducial case (here and in all of our calculations below) because it yields conservatively small amounts of line shielding and, therefore, conservatively small predicted line optical depths in C iv, N v, and O vi at large .
The main result from Figure 6 is that a Ly BAL should be accompanied by significant broad C iv and O vi absorption lines over a wide range of normal BAL outflow physical conditions. It is important to keep in mind that the predicted strengths of the C iv and O vi lines are lower limits based on a lower limit on that follows from the assumption of no partial covering. Smaller values of are not allowed because they cannot produce the observed BAL attributed to Ly. Larger requiring larger (at a given ) would produce stronger C iv and O vi absorption. The absence of these lines in the PDS 456 spectrum (Figures 2 and 3) means that the only conditions consistent with the Ly BAL identification are low degrees of ionisation, , and very low total column densities, that are 3.5 orders of magnitude lower than expected for BAL outflows. For comparison, analysis of composite BAL quasar spectra by Herbst et al. (in prep.) suggests that typical BAL outflows have (see also Sections 1 and 3.4).
Another problem for the Ly identification is that a Ly-only BAL system would be, to our knowledge, unprecedented among observed BAL outflows. Figure 3 shows that the C iv and O vi BALs expected to accompany Ly in PDS 456 would need to be 33 percent the strength of Ly to avoid detection. This is very different from the typical situation illustrated by Figure 5 and by other BAL composite spectra (Baskin et al., 2013, Herbst et al., in prep.) where the C iv and O vi lines that are 2 to 3 times stronger than Ly. BAL surveys based on C iv BAL detections (e.g., Trump et al., 2006; Gibson et al., 2009; Pâris et al., 2017) are naturally biased toward stronger C iv lines and they cannot detect Ly-only BAL systems if they exist. However, our visual inspections of the 641 outflow quasar spectra in our BOSS sample (Section 3.4) do not find any instances of C iv BALs weaker than, or even comparable to, the corresponding Ly absorption.
A third argument against the Ly BAL identification stems from the weakening of the observed BAL between the HST observations in 2000 and 2014 (Figure 2). Variability in BALs and other outflow lines can be attributed to outflow clouds moving across our lines of sight or to changes in the ionisation caused by changes in the incident ionising flux (cf., Filiz Ak et al., 2013; Capellupo et al., 2013, 2014; Misawa et al., 2014a; Grier et al., 2015; Arav et al., 2012, 2015; Rogerson et al., 2016; Moravec et al., 2017, and refs. therein). The evidence for BAL saturation discussed in Section 3.1 and Section 3.4 might favor crossing clouds in many situations. However, if the BAL changes in PDS 456 were caused by ionisation changes and the ionisation was initially low to produce Ly absorption without accompanying C iv and O vi lines, then the only way to make Ly weaker at a fixed is with larger ionisation parameters that should produce stronger C iv and O vi absorption. The continued absence of these accompanying lines in the 2014 (Figure 2) thus makes the Ly identification more difficult because the values of and in 2000 would need to be several times lower than the already-low upper limits deduced from Figure 6.
3.6 Problems with the N v 1240 Identification
The top panel in Figure 7 shows Cloudy predictions for the line-center optical depths that should accompany the observed BAL if it is N v 1240. As in Figure 6, the calculations assume a cloud velocity dispersion v km s-1 (to include moderate amounts of line shielding) but line optical depths derived for km s-1. The total column densities in the model clouds are adjusted to yield an N v column density, , fixed to the value inferred from the observed BAL (Section 3.1). The resulting optical depths are again only lower limits because is a lower limit.
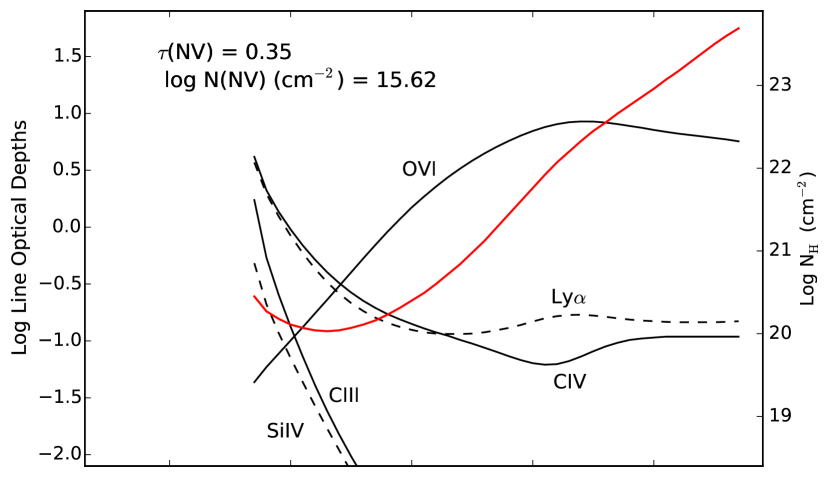
The observed BAL at 1346 Å is compatible with the N v identification only if the accompanying C iv line is undetectable. This requires a ratio of N v/ C iv absorption line strengths (Section 3.1, Figure 3). Figure 7 shows that moderate-to-low outflow ionisations with , corresponding to total columns , are firmly ruled out for the N v BAL identification by the predictions for strong C iv absorption. At higher ionisations, the predicted optical depth ratio hovers around –5 (Figure 7), which is marginally consistent with the observed spectrum. However, any significant partial covering effects would push the observed N v/C iv line depth ratio toward unity, such that C iv should be detectable and the N v BAL identification is ruled out.
Figures 4 and 5 show more directly that absorption line ratios N v/C iv needed for the N v BAL identification are, at best, extremely rare in observed quasar outflows. In particular, the composite spectrum (Figure 5) shows that typical weak-to-moderate BAL/mini-BAL systems have a median line depth ratio of N v/C iv. Individual outflows can have larger N v/C iv ratios. Measurements in the literature of BALs/mini-BALs at speeds up to nearly 0.2 reveal N v/C iv depth ratios in the range 0.5 to 1.5 (Steidel, 1990; Jannuzi et al., 1996; Hamann et al., 1997c; Hamann et al., 1997a; Barlow & Sargent, 1997; Telfer et al., 1998; Sabra et al., 2003; Rodríguez Hidalgo, 2008; Rodríguez Hidalgo et al., 2011; Rodríguez Hidalgo et al., 2013; Rogerson et al., 2016; Moravec et al., 2017). Our visual inspections of the 641 outflow quasars in Section 3.4 find crudely 2 percent of cases with N v/C iv . Figure 4 shows the most extreme well-measured examples. It is difficult to assess the N v/C iv line ratios quantitatively in these spectra due to blending problems in the Ly forest. However, the most extreme cases333We need to acknowledge here that hypothetical quasars with strong N v BALs but negligible C iv absorption cannot appear in our BOSS sample because it relies on C iv line detections (via AI and BI). shown in Figure 4 also appear to be inconsistent with the N v BAL identification in PDS 456.
Another constraint on the N v BAL identification is that it should be accompanied by strong O vi absorption at observed wavelength 1122 Å. This is based on both theoretical predictions (Figure 7) and observations of other outflow quasars (Section 3.4 and references immediately above). The wavelength 1122 Å is just outside the wavelength coverage of the 2000 STIS spectrum; however, there is no evidence for a broad O vi line wing that could be measurable if this line was present (Figure 3). The 2014 COS spectrum does cover these O vi wavelengths and clearly shows no signs of absorption there (Figure 2), but the BAL at 1346 Å was also much weaker in this spectrum. Thus the constraints provided by absence of O vi in existing spectra are weak, but they also do not support the N v BAL identification.
3.7 The Case for C iv 1549 at 0.30c
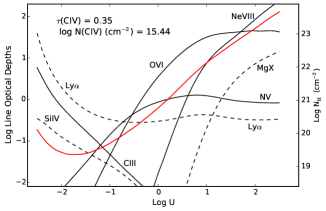
One argument favoring the C iv BAL identification in PDS 456 is that it is readily compatible with existing spectra (Figures 1–3). It has none of the problems described above for Ly and N v because no other lines are expected within the wavelength coverage. Observations of high-velocity BALs/mini-BALs in other quasars indicate that the outflow ionisations are generally high and that the most prominent lines accompanying C iv should be N v and O vi (Section 3.4, Section 3.6, Hamann et al. 2013). The bottom panel in Figure 7 shows specific theoretical predictions for the optical depths in these and other lines that should accompany the observed BAL if it is C iv. The most observationally-accessible lines in this plot are Ly at low ionisations and N v at high ionisations, both at predicted observer-frame wavelengths near 1068 Å. Future observations might test for this absorption, but that will be difficult due to the short wavelength and severe reddening (Section 2). The situation is worse for other corroborating lines. In particular, the corresponding Si iv 1398 line would be at 1216 Å observed, which is directly on top of the Galactic damped Ly line, and the O vi and Ne viii 774 lines, which should be strong at high ionisations are at inaccessible observed wavelengths (899 Å and 673 Å, respectively) due to Galactic Lyman limit absorption.
A second circumstantial argument favoring the C iv identification is that its velocity v is similar to the speeds measured for X-ray outflow of PDS 456. The X-ray outflow is highly variable with multiple velocity components, but the main component identified by Fe K-shell absorption has measured velocities in the range v–0.34 with a typical value near 0.3 (Reeves et al., 2014; Reeves et al., 2016; Nardini et al., 2015; Matzeu et al., 2017). The C iv BAL might provide evidence for a physical relationship between the UV and X-ray outflows in PDS 456 (see Section 4 below).
A third argument is that relativistic C iv BALs/mini-BALs at speeds approaching v have already been measured in a growing number of luminous quasars (Jannuzi et al., 1996; Hamann et al., 1997b; Hamann et al., 2013; Rodríguez Hidalgo, 2008; Rodríguez Hidalgo et al., 2011; Rogerson et al., 2016, Rodriguez Hidalgo et al., in prep.). The C iv BAL at v in PDS 456 would set a new speed record for UV outflows, but it is not so dramatic to be a paradigm shift for our understanding of these outflows. The width and depth of the BAL in PDS 456 is roughly similar to these other high-velocity outflow features. We also note that our tentative detection of another weak C iv BAL in PDS 456 at v (Figure 2, Section 3.2) provides additional, albeit tentative, evidence that a relativistic UV outflow is present in PDS 456.
4 Summary & Discussion
The UV spectrum of PDS 456 obtained with HST-STIS in 2000 has a distinct BAL at 1346 Å that we identify as C iv 1549 at velocity shift v, FWHM km s-1, and minimum optical depth (Section 3.1). The C iv identification rests on its compatibility with existing spectra and the absence of lines that should accompany the alternative identifications, Ly 1216 and N v 1240. Ly is compatible with the observed BAL only if the outflow has a low degree of ionisation, , and a very low total column density, , that would be unprecedented in BAL outflow studies, e.g., several orders of magnitude below recent estimates (Section 3.5). The N v identification might be consistent with absence of accompanying C iv absorption if the gas is highly ionised and it pushes the boundary of observed N v/C iv line strengths beyond what we find in our comparison of 641 outflow quasars in BOSS (Section 3.6). However, this situation should produce strong O vi absorption, which is not well constrained in existing spectra of PDS 456 but it appears to be absent (Figure 3). Thus the N v identification is also strongly disfavored.
The C iv BAL identification has none of these problems (Section 3.7). It would mark the fastest UV outflow line ever reported, but its velocity is consistent with the X-ray outflow in PDS 456 (see Section 1 and below) and not dramatically different from the relativistic C iv BALs/mini-BALs already measured at speeds approaching 0.2 in other quasars (Jannuzi et al., 1996; Hamann et al., 1997b; Hamann et al., 2013; Rodríguez Hidalgo, 2008; Rodríguez Hidalgo et al., 2011; Rogerson et al., 2016, Rodriguez Hidalgo et al., in prep.). The C iv identification is also weakly supported by our tentative identification of an additional C iv BAL feature at v (, Figure 2, Section 3.2). Broad UV outflow lines at speeds near are surely very rare based on the rarity of such lines at 0.1–0.2 (see refs. above). However, the incidence of C iv BALs/mini-BALs at v is not known because they have not been searched for in large quasar surveys like SDSS/BOSS and, in any case, they could easily be missed due to blends with unrelated lines in the Ly forest (e.g., see the search for P v 1121 BALs by Capellupo et al., 2017).
The location of the C iv BAL outflow in PDS 456 is a critical unknown. The range of ionizations consistent with C iv absorption might favor lower ionizations and larger distances from the black hole than the X-ray outflow, perhaps at radii of order 1 pc as inferred from some variability studies of C iv BALs/mini-BALs in other quasars (Hamann et al., 2013; Capellupo et al., 2014; Moravec et al., 2017, McGraw et al., submitted). However, larger distances do not necessarily produce lower ionisations, e.g., if acceleration causes the outflow densities to drop faster than the behaviour expected from free expansion at a constant speed. Moreover, the relativistic speed of the C iv BAL at v indicates that the UV outflow originated with the X-ray UFO very close to the black hole. If the measured flow speeds are similar to the gravitational escape speed at the launch radius, then the launch point is roughly at – (Nardini et al., 2015; Matzeu et al., 2017). Also note that a highly-ionised X-ray outflow launched from this radius and expanding freely outward into a fixed solid angle will not necessarily become less ionised at larger distances (for C iv absorption) because the dilution of the radiation field is balanced by a decline in the densities to yield a constant ionisation parameter. Lower ionisations will occur if the inner regions of the outflow radiatively shield the material downstream and/or if there are clumps with enhanced densities relative to the ambient flow. Clumping and shielding can occur to the same effect at almost any radius, and there is already evidence for dense clumps in the X-ray outflow of PDS 456 (based on lower ionizations and partial covering in the soft X-ray absorber, Reeves et al. 2016; Matzeu et al. 2016; see also Gofford et al. 2014; Nardini et al. 2015; Hagino et al. 2015).
It is therefore an intriguing possibility that the C iv BAL forms directly within, or in close proximity to, the relativistic X-ray outflow. Our Cloudy simulations (Figure 7) show that the C iv BAL in PDS 456 could form over a wide range of physical conditions, including very high ionisations where C iv is just a trace constituent. This situation is illustrated in Figure 8, which plots the ionisation structure in a single model cloud with . This cloud reaches the observed minimum BAL optical depth , along with and , at total column density (represented by the unshaded left-hand portion of Figure 8). This front portion of the cloud matches our calculations in the bottom panel of Figure 7. In this environment, the C iv and N v ion fractions are everywhere and , respectively, and the dominant form of oxygen is O vii. This highly-ionsed environment capable of C iv 1549 absorption will also produce saturated absorption in higher ion lines such as Ne viii 774 and Mg x 615 (see also Figure 7) and at the bound-free edges of O vii and O viii in soft X-rays.

Detailed comparisons between the UV and X-ray outflows in PDS 456 are beyond the scope of the present study. They are subject to uncertainties caused by the outflow variabilities and by unknowns in the shape of the ionising spectrum and the spatial locations of different outflow components relative to the ionizing far-UV and X-ray emission sources. Here we note simply that recent estimates of the X-ray outflow ionisation parameters444The ionisation parameter quoted in the X-ray studies is from Tarter et al. (1969), where is the quasar luminosity from 1 to 1000 Rydberg. For in units of ergs cm s-1 and the continuum shape used in our Cloudy simulations (Section 3.3), the conversion is . are roughly in the range to 4.8 for the K-shell outflow (Gofford et al., 2014; Nardini et al., 2015) and for the soft X-ray absorber (Reeves et al., 2016). The ionisation parameters needed for the C iv BAL, with upper limit (Figure 7), might occur in dense clumps embedded in the X-ray outflow if the density enhancements are 0.4 dex relative to the soft X-ray absorber or 2 dex relative to the Fe K-shell outflow.
The ionization structure of the UV outflow might resemble the quasar SBS 1542+541 (redshift ), which has measured UV BALs ranging in ionization from C iv up to Mg x and Si xii 510 (Telfer et al., 1998). The lines in this quasar appear saturated with shallow troughs that reveal ion-dependent line-of-sight covering fractions from 15 percent in C iv to 50 percent in the higher ions. Telfer et al. (1998) infer from this a 2-zone outflow that could span a decade or more in ionisation parameter, with the C iv lines forming in small clumps embedded in a more highly-ionised outflow medium. Telfer et al. (1998) also note that this outflow should produce substantial bound-free absorption by O vii and O viii in soft X-rays.
The general picture of clumpy outflows has become commonplace in quasar outflow studies. High-quality observations of UV outflow lines often provide evidence for clumpy multi-phase outflow structures with a range of covering fractions (Moravec et al., 2017; Misawa et al., 2014b; Hamann et al., 2011; Hamann & Sabra, 2004; Gabel et al., 2005a; Leighly et al., 2015; Leighly et al., 2011; Leighly et al., 2009; Misawa et al., 2007; Arav et al., 2008, 2005; de Kool et al., 2002; Ganguly et al., 1999). Detailed studies of some bright Seyfert 1 galaxies (e.g., Kaspi et al., 2002; Netzer et al., 2003; Gabel et al., 2005b) clearly demonstrate that the UV and X-ray absorption features can form together in complex outflows, with indications that the lower-ionisation UV lines identify clumps or filaments embedded in the X-ray outflow. Clumpy outflow structures are also predicted by recent numerical simulations (Sim et al., 2010; Takeuchi et al., 2013; Waters et al., 2017) and by considerations of the radiative forces that can compress the outflows into small substructures (Stern et al., 2014). There are also theoretical arguments requiring dense clumps to moderate the outflow ionizations in the absence of significant radiative shielding (De Kool, 1997; Hamann et al., 2013).
If the C iv-absorbing gas in PDS 456 is indeed embedded in the X-ray outflow, it could have important implications for the outflow energetics. It is a well-known problem for X-ray UFOs (e.g., Tombesi et al., 2011, 2013; Gofford et al., 2015) that their high ionizations lead to low opacities and inefficient radiative acceleration (Gofford et al., 2013; Gofford et al., 2014; Higginbottom et al., 2014). Harnessing the full radiative power of the quasar to drive these outflows might require opacities beyond electron scattering at UV/far-UV wavelengths, near the peak of the quasar spectral energy distributions. Matzeu et al. (2017) showed recently that the outflow speeds in PDS 456 correlate with the variable X-ray luminosity, consistent with radiative acceleration (see also Saez & Chartas, 2011). If radiative forces are important, then dense clumps with lower ionisations embedded in the X-ray outflows might be important to boost the opacities for radiative driving (Laor & Davis, 2014; Hagino et al., 2015). The C iv BAL at v in PDS 456 could be the first direct observational evidence for this idea.
PDS 456 is a remarkable object with powerful accretion-disk outflows launched from a range of at least two decades in disk radii, from 0.001 pc for the X-ray outflow to 0.3 pc for the blueshifted CIV broad emission line (Section 1, O’Brien et al., 2005; Gofford et al., 2014). More work is needed to understand how the UV BAL fits into this outflow environment and, specifically, to test the C iv BAL identification. A search for corroborating N v absorption at 1077 Å will be difficult due to Galactic reddening (Section 2) and the poor sensitivity of current instruments at these wavelengths (Section 3.7). However, the alternative BAL identifications, N v and Ly, might be ruled out or confirmed more easily by searching for O vi absorption near 1122 Å (Section 3.6, although the BAL at 1346 Å needs to be present for a meaningful test). Our team has ongoing programs to extend the UV wavelength coverage and monitor PDS 456 in the UV and X-rays that will be described in future papers.
Acknowledgements
We are grateful to Gary Ferland and the Cloudy development team for their continued support and public dispersement of the spectral synthesis code Cloudy. FH also thanks Nahum Arav, Chris Done, Gerald Kriss, and Paola Rodriguez Hidalgo for helpful discussions. We are grateful to the referee, Paul Hewett, for helpful comments that improved this manuscript. JNR acknowledges the support via HST grant HST-GO-14477.001-A. EN acknowledges funding from the European Union’s Horizon 2020 research and innovation programme under the Marie Sklodowska-Curie grant agreement no. 664931.
References
- Arav et al. (2001) Arav N., et al., 2001, ApJ, 561, 118
- Arav et al. (2005) Arav N., Kaastra J., Kriss G. A., Korista K. T., Gabel J., Proga D., 2005, ApJ, 620, 665
- Arav et al. (2008) Arav N., Moe M., Costantini E., Korista K. T., Benn C., Ellison S., 2008, ApJ, 681, 954
- Arav et al. (2012) Arav N., et al., 2012, A&A, 544, A33
- Arav et al. (2015) Arav N., et al., 2015, A&A, 577, A37
- Barlow & Sargent (1997) Barlow T. A., Sargent W. L. W., 1997, AJ, 113, 136
- Baskin et al. (2013) Baskin A., Laor A., Hamann F., 2013, MNRAS, 432, 1525
- Baskin et al. (2015) Baskin A., Laor A., Hamann F., 2015, MNRAS, 449, 1593
- Borguet et al. (2012) Borguet B. C. J., Edmonds D., Arav N., Benn C., Chamberlain C., 2012, ApJ, 758, 69
- Capellupo et al. (2013) Capellupo D. M., Hamann F., Shields J. C., Halpern J. P., Barlow T. A., 2013, MNRAS, 429, 1872
- Capellupo et al. (2014) Capellupo D. M., Hamann F., Barlow T. A., 2014, MNRAS, 444, 1893
- Capellupo et al. (2017) Capellupo D. M., et al., 2017, MNRAS, 469, 323
- Cardelli et al. (1989) Cardelli J. A., Clayton G. C., Mathis J. S., 1989, ApJ, 345, 245
- Chartas et al. (2002) Chartas G., Brandt W. N., Gallagher S. C., Garmire G. P., 2002, ApJ, 579, 169
- Chartas et al. (2009) Chartas G., et al., 2009, New Astronomy Review, 53, 128
- Coatman et al. (2016) Coatman L., Hewett P. C., Banerji M., Richards G. T., 2016, MNRAS, 461, 647
- Crenshaw et al. (2003) Crenshaw D. M., Kraemer S. B., George I. M., 2003, ARA&A, 41, 117
- Dawson et al. (2013) Dawson K. S., et al., 2013, AJ, 145, 10
- De Kool (1997) De Kool M., 1997, in Arav N., Shlosman I., Weymann R. J., eds, Astronomical Society of the Pacific Conference Series Vol. 128, Mass Ejection from Active Galactic Nuclei. p. 233 (arXiv:astro-ph/9704230)
- Debuhr et al. (2012) Debuhr J., Quataert E., Ma C.-P., 2012, MNRAS, 420, 2221
- Di Matteo et al. (2005) Di Matteo T., Springel V., Hernquist L., 2005, Nature, 433, 604
- Dietrich et al. (2002) Dietrich M., Hamann F., Shields J. C., Constantin A., Vestergaard M., Chaffee F., Foltz C. B., Junkkarinen V. T., 2002, ApJ, 581, 912
- Eisenstein et al. (2011) Eisenstein D. J., et al., 2011, AJ, 142, 72
- Ferland et al. (2013) Ferland G. J., et al., 2013, Rev. Mex. Astron. Astrofis., 49, 137
- Ferland et al. (2017) Ferland G. J., et al., 2017, preprint, (arXiv:1705.10877)
- Filiz Ak et al. (2013) Filiz Ak N., et al., 2013, ApJ, 777, 168
- Gabel et al. (2005a) Gabel J. R., et al., 2005a, ApJ, 623, 85
- Gabel et al. (2005b) Gabel J. R., et al., 2005b, ApJ, 631, 741
- Ganguly et al. (1999) Ganguly R., Eracleous M., Charlton J. C., Churchill C. W., 1999, AJ, 117, 2594
- Gibson et al. (2009) Gibson R. R., et al., 2009, ApJ, 692, 758
- Gofford et al. (2013) Gofford J., Reeves J. N., Tombesi F., Braito V., Turner T. J., Miller L., Cappi M., 2013, MNRAS, 430, 60
- Gofford et al. (2014) Gofford J., et al., 2014, ApJ, 784, 77
- Gofford et al. (2015) Gofford J., Reeves J. N., McLaughlin D. E., Braito V., Turner T. J., Tombesi F., Cappi M., 2015, MNRAS, 451, 4169
- Grier et al. (2015) Grier C. J., et al., 2015, ApJ, 806, 111
- Hagino et al. (2015) Hagino K., Odaka H., Done C., Gandhi P., Watanabe S., Sako M., Takahashi T., 2015, MNRAS, 446, 663
- Hamann (1997) Hamann F., 1997, ApJS, 109, 279
- Hamann (1998) Hamann F., 1998, ApJ, 500, 798
- Hamann & Ferland (1999) Hamann F., Ferland G., 1999, ARA&A, 37, 487
- Hamann & Sabra (2004) Hamann F., Sabra B., 2004, in Richards G. T., Hall P. B., eds, Astronomical Society of the Pacific Conference Series Vol. 311, AGN Physics with the Sloan Digital Sky Survey. p. 203
- Hamann et al. (1997a) Hamann F., Barlow T., Cohen R. D., Junkkarinen V., Burbidge E. M., 1997a, in Arav N., Shlosman I., Weymann R. J., eds, Astronomical Society of the Pacific Conference Series Vol. 128, Mass Ejection from Active Galactic Nuclei. p. 19
- Hamann et al. (1997b) Hamann F., Barlow T. A., Junkkarinen V., Burbidge E. M., 1997b, ApJ, 478, 80
- Hamann et al. (1997c) Hamann F., Barlow T. A., Junkkarinen V., 1997c, ApJ, 478, 87
- Hamann et al. (2011) Hamann F., Kanekar N., Prochaska J. X., Murphy M. T., Ellison S., Malec A. L., Milutinovic N., Ubachs W., 2011, MNRAS, 410, 1957
- Hamann et al. (2013) Hamann F., Chartas G., McGraw S., Rodriguez Hidalgo P., Shields J., Capellupo D., Charlton J., Eracleous M., 2013, MNRAS, 435, 133
- Hamann et al. (2017) Hamann F., et al., 2017, MNRAS, 464, 3431
- Higginbottom et al. (2014) Higginbottom N., Proga D., Knigge C., Long K. S., Matthews J. H., Sim S. A., 2014, ApJ, 789, 19
- Hopkins & Elvis (2010) Hopkins P. F., Elvis M., 2010, MNRAS, 401, 7
- Hopkins et al. (2008) Hopkins P. F., Hernquist L., Cox T. J., Kereš D., 2008, ApJS, 175, 356
- Jannuzi et al. (1996) Jannuzi B. T., et al., 1996, ApJ, 470, L11+
- Kaspi et al. (2002) Kaspi S., et al., 2002, ApJ, 574, 643
- Kaspi et al. (2005) Kaspi S., Maoz D., Netzer H., Peterson B. M., Vestergaard M., Jannuzi B. T., 2005, ApJ, 629, 61
- Knigge et al. (2008) Knigge C., Scaringi S., Goad M. R., Cottis C. E., 2008, MNRAS, 386, 1426
- Korista et al. (1993) Korista K. T., Voit G. M., Morris S. L., Weymann R. J., 1993, ApJS, 88, 357
- Laor & Davis (2014) Laor A., Davis S. W., 2014, MNRAS, 438, 3024
- Leighly (2004) Leighly K. M., 2004, ApJ, 611, 125
- Leighly et al. (2007) Leighly K. M., Halpern J. P., Jenkins E. B., Casebeer D., 2007, ApJS, 173, 1
- Leighly et al. (2009) Leighly K. M., Hamann F., Casebeer D. A., Grupe D., 2009, ApJ, 701, 176
- Leighly et al. (2011) Leighly K. M., Dietrich M., Barber S., 2011, ApJ, 728, 94
- Leighly et al. (2015) Leighly K. M., Cooper E., Grupe D., Terndrup D. M., Komossa S., 2015, ApJ, 809, L13
- Luo et al. (2015) Luo B., et al., 2015, ApJ, 805, 122
- Matzeu et al. (2016) Matzeu G. A., Reeves J. N., Nardini E., Braito V., Costa M. T., Tombesi F., Gofford J., 2016, MNRAS, 458, 1311
- Matzeu et al. (2017) Matzeu G. A., Reeves J. N., Braito V., Nardini E., McLaughlin D. E., Lobban A. P., Tombesi F., Costa M. T., 2017, preprint, (arXiv:1708.03546)
- Misawa et al. (2007) Misawa T., Eracleous M., Charlton J. C., Kashikawa N., 2007, ApJ, 660, 152
- Misawa et al. (2014a) Misawa T., Charlton J. C., Eracleous M., 2014a, ApJ, 792, 77
- Misawa et al. (2014b) Misawa T., Inada N., Oguri M., Gandhi P., Horiuchi T., Koyamada S., Okamoto R., 2014b, ApJ, 794, L20
- Moravec et al. (2017) Moravec E. A., Hamann F., Capellupo D. M., McGraw S. M., Shields J. C., Rodríguez Hidalgo P., 2017, MNRAS, 468, 4539
- Nagao et al. (2006) Nagao T., Marconi A., Maiolino R., 2006, A&A, 447, 157
- Nardini et al. (2015) Nardini E., et al., 2015, Science, 347, 860
- Netzer et al. (2003) Netzer H., et al., 2003, ApJ, 599, 933
- O’Brien et al. (2005) O’Brien P. T., Reeves J. N., Simpson C., Ward M. J., 2005, MNRAS, 360, L25
- Pâris et al. (2017) Pâris I., Petitjean P., Ross N. P., Myers A. D., Aubourg É., Streblyanska A., Bailey S. e. a., 2017, A&A, 597, A79
- Reeves et al. (2003) Reeves J. N., O’Brien P. T., Ward M. J., 2003, ApJ, 593, L65
- Reeves et al. (2009) Reeves J. N., et al., 2009, ApJ, 701, 493
- Reeves et al. (2014) Reeves J. N., et al., 2014, ApJ, 780, 45
- Reeves et al. (2016) Reeves J. N., Braito V., Nardini E., Behar E., O’Brien P. T., Tombesi F., Turner T. J., Costa M. T., 2016, ApJ, 824, 20
- Richards et al. (2011) Richards G. T., et al., 2011, AJ, 141, 167
- Rodríguez Hidalgo (2008) Rodríguez Hidalgo P., 2008, PhD thesis, University of Florida, Gainesville, http://etd.fcla.edu/UF/UFE0022674/rodriguez_p.pdf
- Rodríguez Hidalgo et al. (2011) Rodríguez Hidalgo P., Hamann F., Hall P., 2011, MNRAS, 411, 247
- Rodríguez Hidalgo et al. (2013) Rodríguez Hidalgo P., Eracleous M., Charlton J., Hamann F., Murphy M. T., Nestor D., 2013, ApJ, 775, 14
- Rogerson et al. (2016) Rogerson J. A., Hall P. B., Rodríguez Hidalgo P., Pirkola P., Brandt W. N., Filiz Ak N., 2016, MNRAS, 457, 405
- Ross et al. (2012) Ross N. P., Myers A. D., Sheldon E. S., Yèche C., Strauss M. A., Bovy J., Kirkpatrick J. A. e. a., 2012, ApJS, 199, 3
- Rupke & Veilleux (2013) Rupke D. S. N., Veilleux S., 2013, ApJ, 768, 75
- Sabra et al. (2003) Sabra B. M., Hamann F., Jannuzi B. T., George I. M., Shields J. C., 2003, ApJ, 590, 66
- Saez & Chartas (2011) Saez C., Chartas G., 2011, ApJ, 737, 91
- Sim et al. (2010) Sim S. A., Proga D., Miller L., Long K. S., Turner T. J., 2010, MNRAS, 408, 1396
- Simpson et al. (1999) Simpson C., Ward M., O’Brien P., Reeves J., 1999, MNRAS, 303, L23
- Steffen et al. (2006) Steffen A. T., Strateva I., Brandt W. N., Alexander D. M., Koekemoer A. M., Lehmer B. D., Schneider D. P., Vignali C., 2006, AJ, 131, 2826
- Steidel (1990) Steidel C. C., 1990, ApJS, 74, 37
- Stern et al. (2014) Stern J., Behar E., Laor A., Baskin A., Holczer T., 2014, MNRAS, 445, 3011
- Strateva et al. (2005) Strateva I. V., Brandt W. N., Schneider D. P., Vanden Berk D. G., Vignali C., 2005, AJ, 130, 387
- Takeuchi et al. (2013) Takeuchi S., Ohsuga K., Mineshige S., 2013, PASJ, 65, 88
- Tarter et al. (1969) Tarter C. B., Tucker W. H., Salpeter E. E., 1969, ApJ, 156, 943
- Telfer et al. (1998) Telfer R. C., Kriss G. A., Zheng W., Davidsen A. F., Green R. F., 1998, ApJ, 509, 132
- Tombesi et al. (2010) Tombesi F., Cappi M., Reeves J. N., Palumbo G. G. C., Yaqoob T., Braito V., Dadina M., 2010, A&A, 521, A57
- Tombesi et al. (2011) Tombesi F., Cappi M., Reeves J. N., Palumbo G. G. C., Braito V., Dadina M., 2011, ApJ, 742, 44
- Tombesi et al. (2012) Tombesi F., Cappi M., Reeves J. N., Braito V., 2012, MNRAS, 422, L1
- Tombesi et al. (2013) Tombesi F., Cappi M., Reeves J. N., Nemmen R. S., Braito V., Gaspari M., Reynolds C. S., 2013, MNRAS, 430, 1102
- Torres et al. (1997) Torres C. A. O., Quast G. R., Coziol R., Jablonski F., de la Reza R., Lépine J. R. D., Gregório-Hetem J., 1997, ApJ, 488, L19
- Trump et al. (2006) Trump J. R., et al., 2006, ApJS, 165, 1
- Warner et al. (2004) Warner C., Hamann F., Dietrich M., 2004, ApJ, 608, 136
- Waters et al. (2017) Waters T., Proga D., Dannen R., Kallman T. R., 2017, MNRAS, 467, 3160
- Weymann et al. (1991) Weymann R. J., Morris S. L., Foltz C. B., Hewett P. C., 1991, ApJ, 373, 23
- Wu et al. (2011) Wu J., et al., 2011, ApJ, 736, 28
- Wu et al. (2012) Wu J., Brandt W. N., Anderson S. F., Diamond-Stanic A. M., Hall P. B., Plotkin R. M., Schneider D. P., Shemmer O., 2012, ApJ, 747, 10
- Zakamska et al. (2016) Zakamska N. L., et al., 2016, MNRAS, 459, 3144
- de Kool et al. (2002) de Kool M., Korista K. T., Arav N., 2002, ApJ, 580, 54