A Candidate Galaxy Strongly Lensed into a Spatially Resolved Arc
Abstract
The most distant galaxies known are at , observed Myr after the Big Bang. The few candidates discovered to date have been exceptionally small– barely resolved, if at all, by the Hubble Space Telescope. Here we present the discovery of SPT0615-JD, a fortuitous (=) galaxy candidate stretched into an arc over by the effects of strong gravitational lensing. Discovered in the Reionization Lensing Cluster Survey (RELICS) Hubble Treasury program and companion S-RELICS Spitzer program, this candidate has a lensed -band magnitude of AB mag. With a magnification of estimated from our lens models, the de-lensed intrinsic magnitude is AB mag, and the half-light radius is kpc, both consistent with other candidates. The inferred stellar mass () and star formation rate ( ) indicate that this candidate is a typical star-forming galaxy on the SFR– relation. We note that three independent lens models predict two counterimages, at least one of which should be of a similar magnitude to the arc, but these counterimages are not yet detected. Counterimages would not be expected if the arc were at lower redshift. However, the only spectral energy distributions capable of fitting the Hubble and Spitzer photometry well at lower redshifts require unphysical combinations of galaxy properties. The unprecedented lensed size of this candidate offers the potential for the James Webb Space Telescope to study the geometric and kinematic properties of a galaxy observed 500 Myr after the Big Bang.
1. Introduction
With its high resolution and sensitivity, observations using the Hubble Space Telscope (HST) have sharpened our understanding of the high- universe. Deep and wide extragalactic imaging surveys with ACS and WFC3 have uncovered thousands of galaxies at in blank fields (see Finkelstein, 2016; Stark, 2016, for reviews), including the most distant galaxy found to-date at (GN-z11; Oesch et al., 2016). In addition, we have prioritized HST to observe the most massive galaxy clusters, taking advantage of the natural telescopes they create via strong gravitational lensing (CLASH, PI Postman; Frontier Fields, PI Lotz; RELICS, PI Coe). This investment in lensing fields has proven fruitful. We have discovered highly magnified (MACS1149-JD, Zheng et al. 2012, Hoag et al. 2017; MACS1115-JD and MACS1720-JD, Bouwens et al. 2014; MACS0416-JD, Infante et al. 2015) and multiply-imaged galaxies (MACS0647-JD, Coe et al. 2013; A2744-JD, Zitrin et al. 2014) at redshifts up to , which have allowed us to study faint UV metal lines (Stark et al., 2014; Rigby et al., 2015; Mainali et al., 2017), nebular emission lines (Smit et al., 2017; Stark et al., 2015; Hoag et al., 2017; Laporte et al., 2017), and the star formation rate density deep into the epoch of reionization (Oesch et al., 2014, 2017).
However, little is known in detail about the universe, and the handful of candidates found so far exhibit peculiar properties. At , MACS0647-JD has a radius smaller than 100 pc, the size of Giant Molecular Clouds in the local universe. GN-z11 is three times brighter than the characteristic UV luminosity () of galaxies at that distance, surprisingly bright given the CANDELS search area. Both z10 candidates MACS1149-JD and M0416-JD appear to have an evolved stellar population of Myr (due to red [3.6 µm][4.5 µm] Spitzer colors), when the age of the universe was only Myr (Hoag et al., 2017). JWST NIRCam will better sample the rest-frame UV-to-optical colors which will break some parameter degeneracies and challenge these initial inferences. However, with typical effective radii of ″ and a NIRCAM PSF FWHM111see https://jwst-docs.stsci.edu of ″ at 1.5 µm, it will still be difficult resolve these galaxies spatially. Ideally, we can use the help of strong lensing to study the kinematics and intrinsic stellar populations at in detail.
In this Letter we present a galaxy gravitationally lensed into an arc with a photometric redshift of . Discovered in the Reionization Lensing Cluster Survey (RELICS) Hubble (HST) and Spitzer Space Telescope imaging, the arc features of this candidate extend across 2.5″, allowing unprecedented physical resolution deep in the epoch of reionization. This new candidate has an HST F160W -band magnitude of =25.7 AB, bright enough for follow-up spectroscopic or grism observations. In this work, we present the supporting evidence that this candidate is indeed at , and discuss the remaining uncertainties. Throughout, we assume concordance cosmology with =70 km s-1 Mpc-1, =0.7 and =0.3.
2. Data and Photometry
The galaxy cluster SPT-CL J0615-5746 (hereafter SPT0615-57; also known as PLCK G266.6-27.3) was discovered independently by the South Pole Telescope survey (Williamson et al., 2011) and the Planck Collaboration et al. (2011). It is exceptionally massive () for its high redshift (). The SPT and Planck teams obtained HST imaging (GO 12477 and 12757) of the cluster with the ACS/WFC F606W filter (1-orbit depth) and F814W filter (combined 2-orbit depth). RELICS (GO 14096) obtained ACS/WFC imaging (1 orbit) in F435W and WFC3/IR imaging (2 orbits) in F105W , F125W , F140W , and F160W .
RELICS obtained similar HST imaging with WFC3/IR and ACS as needed on a total of 41 clusters. The details of the image reduction, SExtractor (version 2.8.6; Bertin & Arnouts, 1996) object selection, and HST photometry are described by Salmon et al. (2017) and Coe et al. (in prep). SPT0615-57 was the second highest high--producing cluster field out of the 41 RELICS fields, revealing 25 new candidate galaxies over the redshift range (Salmon et al., 2017).
| \toprule | |||
|---|---|---|---|
| Field | SPT0615-57 | PLCKG138-10 | RXC0018+16 |
| RELICS ID | 336 | 748 | 1107 |
| 06:15:55.03 | 02:27:00.86 | 00:18:33.84 | |
| 57:46:19.56 | 49:00:22.68 | 16:25:18.84 | |
| 28.7 | 26.8 | 28.8 | |
| 28.4 | 28.4 | 28.8 | |
| 29.5 | 27.0 | 29.4 | |
| 27.3 | 27.3 | 28.4 | |
| 26.5 | 26.5 | 26.9 | |
| 26.3 | 26.00.2 | 26.6 | |
| 25.70.1 | 25.20.1 | 26.10.1 | |
| [3.6 µm] | 25.20.3 | 23.40.1 | 23.10.1 |
| [4.5 µm] | 24.40.3 | 22.90.1 | 22.80.1 |
| a | 9.6 | 10.0 | 9.9 |
| 9.9 | 2.7 | 3.6 |
-
•
Notes: aPhotometric redshifts found using BPZ. The two interlopers from PLCKG138-10 and RXC0018+16 were initially identified as candidates prior to including the Spitzer data, whereas the candidate in SPT0615-57 remained at .
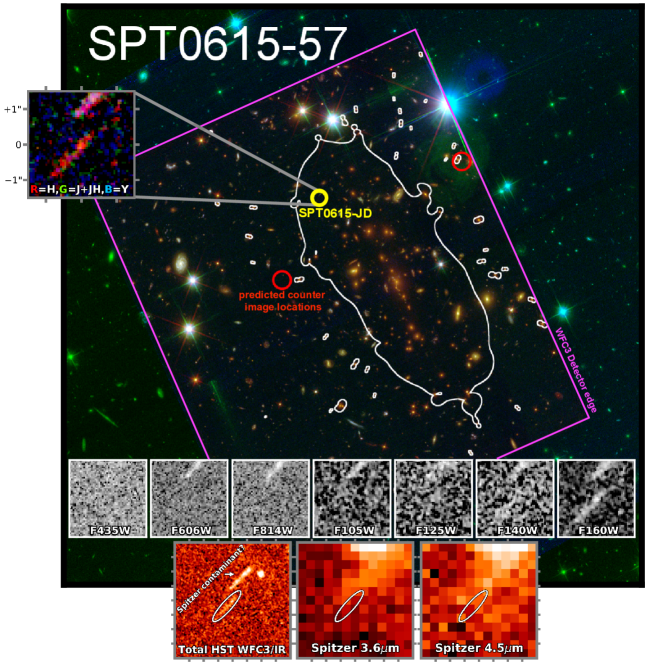
Table 1 shows the three candidates found in RELICS after fitting photometric redshifts to only HST data. We then vetted these candidates by checking Spitzer data from the S-RELICS programs (PI Bradač; PI Soifer). The IRAC channel 1 and 2 bands (3.6 µm and 4.5 µm respectively, with 5-hour depth per band), correspond to rest-frame optical flux at and are invaluable for distinguishing between intrinsically bluer star-forming galaxies and intrinsically redder 3 interloper galaxies. The Spitzer fluxes were extracted using T-PHOT (Merlin et al., 2016) which uses the higher-resolution HST imaging as a prior to extract photometry from the lower resolution Spitzer images. First, we produce PSF convolution kernels based on all available HST images. We manually sharpen the PSF to minimize residuals between the convolved image and the Spitzer images. Then, we run T-PHOT on the entire cluster field to extract the Spitzer photometry.
After obtaining the Spitzer photometry and re-running the photometric redshifts, we rule out two candidates as low- interlopers, leaving one candidate. Fig. 1 shows image cutouts of this candidate, hereafter named SPT0615-JD (“JD” for HST F125W -band dropout), in each of the available HST and Spitzer bands, as well as a WFC3/IR color composite. SPT0615-JD has an AB magnitude of in F160W detected with S/N11 (the F160W exposures were in two epochs 44 days apart and each detected the source with S/N5). The extended arc shape is consistent with the direction of lensing shear expected from the cluster (see §3). The bands blueward of F140W are undetected with S/N2, and F140W is just undetected (S/N=2.9). Importantly, we emphasize that observed-frame size of SPT0516-JD is rather large (2.5″ long), and can easily be spatially resolved by JWST (see §5).
We note that these image cutouts reveal an important caveat to the Spitzer fluxes of SPT0615-JD. T-PHOT reports a maximum covariance between SPT0615-JD and all other sources fit simultaneously (max CV ratio) of for both the 3.6 µm and 4.5 µm images. This implies a covariance between the Spitzer photometry of SPT0615-JD and a nearby source. The 8″ x8″ HST image in Fig. 1 shows an IR-bright nearby galaxy. We conclude that the Spitzer fluxes for SPT0615-JD are biased by this source and are likely over-estimated. Even so, the fluxes in each Spitzer band are already several magnitudes fainter than typical low- interlopers. This is critical because while all solutions could have lower Spitzer fluxes, the solution requires them to be high, especially at 4.5 µm. As we will discuss in §4, the inflated Spitzer fluxes also increase the inferred 10 UV dust attenuation, which should be considered an upper limit. Upcoming deeper Spitzer imaging (PI Bradač) of this cluster will improve constraints on the flux and derived properties of this candidate.
3. Lens Models
We identify three sets of multiply-imaged galaxies: two with spectroscopic redshifts ( and ) and one whose redshift is free to vary in the modeling. (Paterno-Mahler et al., in preparation). Based on these, we produce three lens models using Lenstool (Jullo et al., 2007), GLAFIC (Oguri, 2010), and the Zitrin et al. (2015) Light Traces Mass (LTM) method. Based on these models, we estimate the magnification of SPT0615-JD to be .
All three models predict two counterimages at the positions shown in Fig. 1. Our results using GLAFIC (Kikuchihara et al., in preparation) and Lenstool (Paterno-Mahler et al., in preparation) predict the upper-right counterimage is 1 magnitude fainter than the original arc, and therefore below the detection limit. All three models predict the lower-left counterimage to be of similar magnification and magnitude of the original arc, and LTM predicts the counterimages to have the same magnitude as the original arc. Given these models, we would have expected to see an image near the lower-left position, but none are yet detected. We note that the WFC3 limiting depths are 26 AB mag, and the counterimages may be fainter. Conversely, all lens models predict no counterimages if SPT0615-JD is at . Deeper imaging of this field is required to properly search for the counterimages and yield geometric support as in Coe et al. (2013), Zitrin et al. (2014), and Chan et al. (2017).
4. SED Fitting
Thanks to the Spitzer data that probes the rest-frame optical and near-ultraviolet (UV, Å), we can infer upper-limits on physical parameters like stellar mass and dust attenuation to test if the high and low-redshift solutions are sensible. We use a Bayesian SED-fitting procedure originally described by Papovich et al. (2001) and updated by Salmon et al. (2015). In short, we sample the posterior using a grid of SEDs that represent a range of stellar population ages (, logarithmically spaced), attenuation (), metallicity (), and rising star-formation histories (, where the -folding timescale can be 0.3, 0.5, 0.7, 1, 3, 5, 7, 10, 30, 50, 70, or 100 Gyr). We use Bruzual & Charlot (2003) stellar population synthesis models with a Chabrier (2003) IMF222Switching from a Chabrier to a Salpeter (1955) IMF would result in higher derived stellar mass and star-formation rate (SFR) by 0.25 dex. and include the effects of nebular emission lines following Salmon et al. (2015). We assume the dust-attenuation law derived by Salmon et al. (2016) that varies in shape from a steep law at low attenuation (similar in shape to the extinction law of the Small Magellanic Cloud) to a grey law at high attenuation (similar in shape to the starburst curve of Calzetti et al. (2000)).
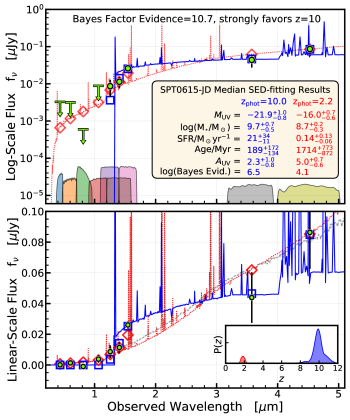
The results of our SED fitting are summarized in Fig. 2. For all SED fitting, we correct for lensing magnification assuming , and do not further correct the Spitzer fluxes despite likely contamination (see §2 and Fig. 1). The fits assuming the redshift show a moderately high stellar mass of and star-formation rate of SFR=21 /yr. However, the stellar mass, star-formation rate, age, and UV dust attenuation will be lower if the rest-frame optical fluxes are over-estimated, as implied by the Spitzer contaminant shown in Fig. 1. Therefore, we consider these preliminary estimates to be upper limits. Nevertheless, the stellar mass and SFR of SPT0615-JD are indicative of a typical star-forming galaxy at (Oesch et al., 2014) and would lie on the SFR- relation at (Salmon et al., 2015).
The SED fit assuming is quite different. The median, marginalized results, which account for the full probability density, imply a low stellar mass , low star-formation rate SFR= /yr, and evolved stellar population age =1714 Myr, with high uncertainty. Similarly, the best-fit SED has the same stellar mass, but a higher SFR (SFR/yr), a slightly younger stellar population age (=1585 Myr), a very dusty SED ( mag), and high nebular emission ([OIII]+Hβ equivalent width EW=780 Å, or 1671 Åto match the -band magnitude).
This SED solution is unphysical for several reasons. Its dust attenuation is dramatically high for its low stellar mass (Pannella et al., 2009), its size is too large and SED too dusty compared to other extreme [OIII] emitting galaxies at (Malkan et al., 2017), and it has too high EW compared to [OIII] emitters at of similar mass (Maseda et al., 2013). Such a rare high EW and high dust interloper was spectroscopically ruled out for a similar candidate, MACS0646-JD (Pirzkal et al., 2015). Importantly, the SED necessitates such strong [OIII] emission to match the observations with appreciable likelihood; a dusty SED template alone cannot match both the bright H-band flux and the relatively faint optical flux. Finally, unlike the solution, the solution requires the already overestimated Spitzer fluxes to be high, and it becomes increasingly harder to justify a SED with lower 3.6 µm and 4.5 µm fluxes.
We caution the reader that the best-fit SEDs in Fig. 2 (and best-fit SED solutions in general) are not necessarily representative of the full probability density of the posterior (Leja et al., 2017). A better indicator of the goodness-of-fit than the best-fit is the unconditional marginal likelihood of the data, or the Bayesian evidence (see e.g., Salmon et al., 2016, for definitions), which describes probability of seeing the data given all parameters. The ratio of two Bayesian evidences333The Bayes-factor evidence is typically described as , where is the ratio of the Bayesian evidence under model assumption 1 to that of model assumption 2. Larger positive numbers favor the assumptions in model 1, and negative favor the assumptions in model 2 (Kass & Raftery, 1995). under different model assumptions, like whether we assume the SED lies at or 10, is called the Bayes Factor and describes the relative evidence between two model assumptions. We find a Bayes-Factor evidence of 10.7 in favor of the solution, which is considered “very strong” evidence (Kass & Raftery, 1995). Our interpretation is that there are more SEDs that fit the data well assuming the redshift than the select few (and justifiably unphysical) SEDs that fit the data well assuming the redshift.
5. Comparison with Other High-Redshift Candidates
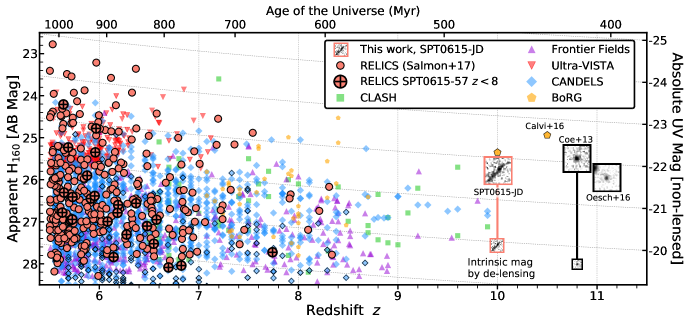
Fig. 3 shows the -band magnitude versus redshift for all high- () candidate galaxies discovered in RELICS (Salmon et al., 2017) and many other deep and wide surveys. The lensed, observed-frame size of SPT0615-JD stands out as spatially much larger than other candidates (other candidates at these redshifts have similar point-like sizes to those found by Coe et al. 2013 and Oesch et al. 2016, see below). The intrinsic (de-lensed) magnitude of SPT0615-JD is similar to that of the candidate MACS0647-JD (Coe et al., 2013).
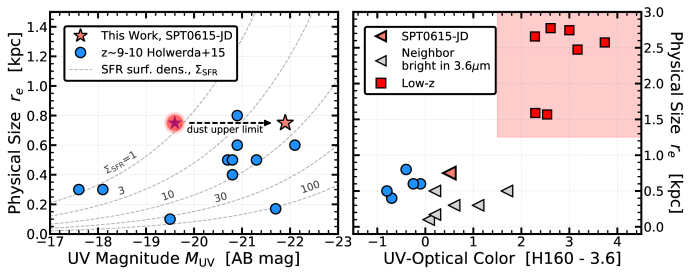
An independent way to test high and low- solutions for SPT0615-JD is to calculate its physical size and compare to other known interlopers. Moreover, the sizes of galaxies can give us great physical insight into the initial conditions of early disk evolution (Ferguson et al., 2004). Broadly, the size evolution at fixed luminosity scales as (1+)-m where (Shibuya et al., 2015). Holwerda et al. (2015) demonstrated that a combination of UV-to-optical color, sampled by the F160W and 3.6 µm bands, and physical size can be used to identify obvious low- contaminants. They summarized that the sizes of galaxy candidates have typical half-light radii of kpc.
To calculate the size of SPT0615-JD, we used our lens models to reconstruct its image in the source plane. The LTM lens model finds a relatively mild tangential magnification, or shear, of a factor of , leaving the full width of the de-lensed source to be about 3–3.5 kpc. If we assume the light distribution is uniform, we can take the half light radius to be about 1/4 of the full size and find kpc. The statistical error on this size (from the lens model) is only a couple of percent, so we are dominated by systematic errors (10%). Curiously, the reconstructed source’s axis ratio is still about 2:1 in the same direction as the lensing shear, which could mean that the shear is underestimated and the size is in fact smaller.
Fig. 4 shows that the inferred size of SPT0615-JD is typical compared to other high- candidates. This provides crucial evidence in support of the solution that is independent of the galaxy SED. While the uncertainty in the UV dust attenuation should be considered as an upper limit, the candidate is still within the range of and SFR surface density of known candidates.
6. Conclusions
We present SPT0615-JD, a promising galaxy candidate that appears to be stretched into the shape of an arc by the effects of strong gravitational lensing. Out of all combined lensing fields from RELICS, CLASH, and the Frontier Fields, there is no other galaxy candidate spatially stretched by lensing as distant as SPT0615-JD. While our three independent lens models predict at least one detectable counterimage, we do not see one in the current data. No counterimages are expected if the candidate is at lower redshift. However, the only SED that fits the data well is unphysical based on the required combination of its size, mass, dust attenuation, and [OIII]+Hβ EW. In addition, we find very strong Bayesian evidence that the SED-inferred physical properties of this candidate are of a typical star-forming galaxy. Finally, the source-plane size of SPT0615-JD is similar to other galaxies, while the observed-frame image offers unprecedented spatial resolution. This galaxy candidate offers the unique opportunity for resolving stellar populations deep in the epoch of reionization, especially with the higher resolution of JWST.
Acknowledgements
This paper uses observations from NASA/ESA HST. STScI is operated by AURA under NASA contract NAS 5- 26555. ACS under NASA contract NAS 5-32864, and Spitzer by JPL. These observations are associated with program GO-14096 and archival data with GO-9270, GO-12166, GO-12477, GO-12253. Some data were obtained from MAST. This work was performed under the auspices of the U.S. Department of Energy by LLNL under contract DE-AC52-07NA27344. F.A.-S. acknowledges support from Chandra grant G03-14131X.
References
- Bertin & Arnouts (1996) Bertin, E., & Arnouts, S. 1996, A&AS, 117, 393
- Bouwens et al. (2014) Bouwens, R. J., Bradley, L., Zitrin, A., et al. 2014, ApJ, 795, 126
- Bouwens et al. (2015) Bouwens, R. J., Illingworth, G. D., Oesch, P. A., et al. 2015, ApJ, 803, 34
- Bowler et al. (2017) Bowler, R. A. A., Dunlop, J. S., McLure, R. J., & McLeod, D. J. 2017, MNRAS, 466, 3612
- Bradley et al. (2012) Bradley, L. D., Trenti, M., Oesch, P. A., et al. 2012, ApJ, 760, 108
- Bradley et al. (2014) Bradley, L. D., Zitrin, A., Coe, D., et al. 2014, ApJ, 792, 76
- Bruzual & Charlot (2003) Bruzual, G., & Charlot, S. 2003, MNRAS, 344, 1000
- Calvi et al. (2016) Calvi, V., Trenti, M., Stiavelli, M., et al. 2016, ApJ, 817, 120
- Calzetti et al. (2000) Calzetti, D., Armus, L., Bohlin, R. C., et al. 2000, ApJ, 533, 682
- Chabrier (2003) Chabrier, G. 2003, PASP, 115, 763
- Chan et al. (2017) Chan, B. M. Y., Broadhurst, T., Lim, J., et al. 2017, ApJ, 835, 44
- Coe et al. (2013) Coe, D., Zitrin, A., Carrasco, M., et al. 2013, ApJ, 762, 32
- Ferguson et al. (2004) Ferguson, H. C., Dickinson, M., Giavalisco, M., et al. 2004, ApJ, 600, L107
- Finkelstein (2016) Finkelstein, S. L. 2016, PASA, 33, e037
- Finkelstein et al. (2015) Finkelstein, S. L., Ryan, Jr., R. E., Papovich, C., et al. 2015, ApJ, 810, 71
- Hoag et al. (2017) Hoag, A., Bradač, M., Trenti, M., et al. 2017, Nature Astronomy, 1, 0091
- Holwerda et al. (2015) Holwerda, B. W., Bouwens, R., Oesch, P., et al. 2015, ApJ, 808, 6
- Infante et al. (2015) Infante, L., Zheng, W., Laporte, N., et al. 2015, ApJ, 815, 18
- Ishigaki et al. (2017) Ishigaki, M., Kawamata, R., Ouchi, M., Oguri, M., & Shimasaku, K. 2017, ArXiv, 1702.04867
- Jullo et al. (2007) Jullo, E., Kneib, J.-P., Limousin, M., et al. 2007, New Journal of Physics, 9, 447
- Kass & Raftery (1995) Kass, R. E., & Raftery, A. E. 1995, Journal of the American Statistical Association, 90, 773
- Laporte et al. (2017) Laporte, N., Ellis, R. S., Boone, F., et al. 2017, ApJ, 837, L21
- Leja et al. (2017) Leja, J., Johnson, B. D., Conroy, C., van Dokkum, P. G., & Byler, N. 2017, ApJ, 837, 170
- Mainali et al. (2017) Mainali, R., Kollmeier, J. A., Stark, D. P., et al. 2017, ApJ, 836, L14
- Malkan et al. (2017) Malkan, M. A., Cohen, D. P., Maruyama, M., et al. 2017, ApJ, 850, 5
- Maseda et al. (2013) Maseda, M. V., van der Wel, A., da Cunha, E., et al. 2013, ApJ, 778, L22
- Merlin et al. (2016) Merlin, E., Bourne, N., Castellano, M., et al. 2016, A&A, 595, A97
- Oesch et al. (2017) Oesch, P. A., Bouwens, R. J., Illingworth, G. D., Labbe, I., & Stefanon, M. 2017, ArXiv, 1710.11131
- Oesch et al. (2014) Oesch, P. A., Bouwens, R. J., Illingworth, G. D., et al. 2014, ApJ, 786, 108
- Oesch et al. (2016) Oesch, P. A., Brammer, G., van Dokkum, P. G., et al. 2016, ApJ, 819, 129
- Oguri (2010) Oguri, M. 2010, PASJ, 62, 1017
- Pannella et al. (2009) Pannella, M., Carilli, C. L., Daddi, E., et al. 2009, ApJ, 698, L116
- Papovich et al. (2001) Papovich, C., Dickinson, M., & Ferguson, H. C. 2001, ApJ, 559, 620
- Pirzkal et al. (2015) Pirzkal, N., Coe, D., Frye, B. L., et al. 2015, ApJ, 804, 11
- Planck Collaboration et al. (2011) Planck Collaboration, Aghanim, N., Arnaud, M., et al. 2011, A&A, 536, A26
- Rigby et al. (2015) Rigby, J. R., Bayliss, M. B., Gladders, M. D., et al. 2015, ApJ, 814, L6
- Salmon et al. (2015) Salmon, B., Papovich, C., Finkelstein, S. L., et al. 2015, ApJ, 799, 183
- Salmon et al. (2016) Salmon, B., Papovich, C., Long, J., et al. 2016, ApJ, 827, 20
- Salmon et al. (2017) Salmon, B., Coe, D., Bradley, L., et al. 2017, ArXiv, 1710.08930
- Salpeter (1955) Salpeter, E. E. 1955, ApJ, 121, 161
- Schmidt et al. (2014) Schmidt, K. B., Treu, T., Trenti, M., et al. 2014, ApJ, 786, 57
- Shibuya et al. (2015) Shibuya, T., Ouchi, M., & Harikane, Y. 2015, ApJS, 219, 15
- Smit et al. (2017) Smit, R., Swinbank, A. M., Massey, R., et al. 2017, MNRAS, 467, 3306
- Stark (2016) Stark, D. P. 2016, ARA&A, 54, 761
- Stark et al. (2014) Stark, D. P., Richard, J., Siana, B., et al. 2014, MNRAS, 445, 3200
- Stark et al. (2015) Stark, D. P., Walth, G., Charlot, S., et al. 2015, MNRAS, 454, 1393
- Williamson et al. (2011) Williamson, R., Benson, B. A., High, F. W., et al. 2011, ApJ, 738, 139
- Zheng et al. (2012) Zheng, W., Postman, M., Zitrin, A., et al. 2012, Nature, 489, 406
- Zitrin et al. (2014) Zitrin, A., Zheng, W., Broadhurst, T., et al. 2014, ApJ, 793, L12
- Zitrin et al. (2015) Zitrin, A., Labbé, I., Belli, S., et al. 2015, ApJ, 810, L12