Accretion of satellites onto central galaxies in clusters: merger mass ratios and orbital parameters
Abstract
We study the statistical properties of mergers between central and satellite galaxies in galaxy clusters in the redshift range , using a sample of dark-matter only cosmological -body simulations from Le SBARBINE dataset. Using a spherical overdensity algorithm to identify dark-matter haloes, we construct halo merger trees for different values of the overdensity . While the virial overdensity definition allows us to probe the accretion of satellites at the cluster virial radius , higher overdensities probe satellite mergers in the central region of the cluster, down to , which can be considered a proxy for the accretion of satellite galaxies onto central galaxies. We find that the characteristic merger mass ratio increases for increasing values of : more than of the mass accreted by central galaxies since comes from major mergers. The orbits of satellites accreting onto central galaxies tend to be more tangential and more bound than orbits of haloes accreting at the virial radius. The obtained distributions of merger mass ratios and orbital parameters are useful to model the evolution of the high-mass end of the galaxy scaling relations without resorting to hydrodynamic cosmological simulations.
keywords:
dark matter – galaxies: clusters: general – galaxies: elliptical and lenticular, cD – galaxies: evolution – galaxies: formation1 Introduction
Central Galaxies (CGs) in galaxy groups and clusters are typically massive early-type galaxies with relatively old stellar populations and little ongoing star formation. CGs are believed to form in two phases (Merritt, 1985; Tremaine, 1990; Dubinski, 1998; Ruszkowski & Springel, 2009; Lauer et al., 2014). A first phase of in situ star formation at redshift is followed by a second phase of growth via the so-called galactic cannibalism process (Ostriker & Tremaine, 1975; White, 1976; Hausman & Ostriker, 1978), that is accretion of satellite galaxies driven by dynamical friction (Chandrasekhar, 1943). Quantitatively, both theoretical (De Lucia & Blaizot, 2007; Feldmann et al., 2010; Tonini et al., 2012; Shankar et al., 2015) and observational (Marchesini et al., 2014; Bellstedt et al., 2016; Buchan & Shankar, 2016; Vulcani et al., 2016) arguments suggest that about half of the stellar mass of CGs is assembled in situ at , and the other half is assembled at relatively late times () via cannibalism processes.
The effect of this cannibalism-driven growth phase on the properties of the CG (for instance size and velocity dispersion) is determined not only by the properties of the cannibalised galaxies (e.g. mass ratio between satellite and central; Naab et al., 2009), but also by the merging orbital parameters (Boylan-Kolchin et al., 2006; Nipoti et al., 2012). Measures of size, velocity dispersion, luminosity and stellar mass of observed CGs lie on tight scaling relations (Bernardi et al., 2007; Liu et al., 2008; Vulcani et al., 2014). Knowing the properties of the mergers that occur during the late growth of CGs is thus important to theoretically understand the origin and evolution of their scaling relations.
Nipoti (2017, hereafter N17) made the point that, given the very special location of CGs, at the bottom of the deep potential well of the host group or cluster, the distribution of the orbital parameters of the central-satellite encounters can be quite different from that of the encounters between galaxies not belonging to groups or clusters. N17 has characterised the distribution of the orbital parameters for central-satellite mergers using idealised -body simulations in which the host system (a cluster or a group) is modelled as an isolated, spherical, collisionless -body system and the satellite is rigid, being represented by a single massive, softened particle. In particular, the simulations of N17 are not framed within a cosmological context: the initial orbital parameters of the satellites are extracted from the host-halo distribution function, based on the assumption that violent relaxation (Lynden-Bell, 1967) is rapid and the satellite population does not retain much memory of the cosmological distribution of the orbital parameters at time of infall. The orbital parameters of the satellites then evolve due to dynamical friction (i.e. the satellites lose orbital energy and angular momentum).
In this work we improve on the analysis of N17 by considering the problem in a fully cosmological setting, focusing on the growth of CGs in clusters of galaxies. For this purpose, we take advantage of the suite of cosmological simulations Le SBARBINE (Despali et al., 2016). These simulations are dark-matter only and so they do not contain a realistic galaxy population. Nevertheless, if we assume that CGs sit at the center of dark-matter haloes and if we select the central regions of these host haloes at overdensities typical for the location of the central galaxies, they can be used for our purposes. Following Despali et al. (2016), we identified haloes in Le SBARBINE simulations for different overdensity threshold: , where is the redshift-dependent virial overdensity, and , , and , independent of redshift. For each of these halo definitions, we also built the corresponding merger history trees. When is considered, the entire virialised region of the halo is selected (in the case of a galaxy cluster, the entire cluster-size dark-matter halo). When higher overdensities are considered, smaller regions of the halo are selected: for sufficiently high overdensity we select only the central part of the virialised halo, which we can roughly identify with the central galaxy. Moreover at these high overdensities, dense substructures within the main virial halo can be identified as independent structures. For each given overdensity we measure the properties of the mergers (specifically, the mass ratios and the orbital parameters). We then compare the properties of cosmological accretion (at the virial radius ) with those of accretion onto central galaxies (at some inner radius ).
2 Numerical methods
2.1 -body simulations and identification of dark-matter haloes
In this work we make use of the results from the cosmological dark-matter only -body simulations Le SBARBINE (Despali et al., 2016). The assumed background cosmology and initial conditions of the simulations are consistent with the results from the Planck Collaboration XVI (Planck Collaboration et al., 2014). In particular, in the simulations and throughout this paper we adopt a standard cold dark matter cosmological model with the following parameters: matter density parameter , cosmological constant density parameter , linear power spectrum amplitude and dimensionless Hubble constant . Here we use only the two highest resolution runs among Le SBARBINE simulations: Ada (dark-matter particle mass ) and Bice (). The two simulations have the same number of particles (), but different box size: for Ada and for Bice.
At each stored snapshot haloes are identified using a spherical overdensity algorithm (e.g. Tormen 1998; Tormen et al. 2004; Giocoli et al. 2008). In practice, haloes are defined as spherical overdensities with radius such that the average density is
| (1) |
where is the critical overdensity and
| (2) |
is the critical density of the Universe, depending on redshift through the Hubble parameter . Using this method, the overdensity threshold that defines the halo boundaries can be varied depending on the observational data that one wants to compare with. While the virial overdensity is commonly used in structure formation studies, other definitions can be chosen to be more similar to observational data sets: is typically used in X-ray observations to define the mass of a galaxy cluster, while is often used to fit weak lensing shear profiles. In our case corresponds to the region within , which is a proxy for the size of the CG in a cluster.
In this work, we consider different choices for . For each value of , we define the halo mass and the halo radius . First of all, we consider the virial value , which depends on and on the cosmological parameters, as given by Eke et al. (1996). For the assumed cosmology increases with redshift: reference values are at and at . When the halo radius and mass are, respectively, the virial radius and the virial mass . For comparison with previous work we consider also the standard value , independent of redshift: in this case the halo mass and radius are and , respectively. Finally, in order to study the behaviour of mergers in central parts of the haloes, we explore the following other values of the critical overdensity, independent of redshift: (with mass and radius ), (with mass and radius ) and (with mass and radius ). It must be noted that in each catalogue (i.e. for each value of the considered overdensity ) the haloes are identified independently. Therefore the number of haloes is in general different in each catalogue, because a halo that, at a given redshift, is identified for a given value of , at the same redshift might be “incorporated” in a bigger halo when a lower overdensity is considered (for more details see figure 2 of Despali et al., 2016).
2.2 Sample of haloes and catalogues of halo-halo encounters
We study the redshift range , in which Le SBARBINE simulations have 13 snapshots at the following redshifts: , , , , , , , , , , , , . We create a sample of galaxy clusters by selecting, in the catalogue, all haloes with at . The resulting sample consists of 101 haloes at (12 haloes in Ada and 89 haloes in Bice). We identify these 101 haloes also in the higher-overdensity () catalogues (, , and ), finding that all of them have counterparts in all the considered catalogues. We note that, as the selection in mass is done on , the selected haloes can have mass for , because the mass of a given halo decreases for increasing .
In order to identify halo-halo encounters we proceed as follows. From the halo catalogues built for the 13 simulation snapshots and for each overdensity, we construct the halo merging history tree. Starting from each halo at , we define its progenitors at the previous output, , as all haloes that, in the time elapsed between two snapshots, have given at least 50% of their particles to the considered halo. The main progenitor at is defined as the most massive progenitor of the halo. We then repeat the same procedure, now starting from the main progenitor at and considering its progenitors at , and we proceed backwards in time, always following the main progenitor halo. The resulting merger tree consists of a main trunk, which traces the main progenitor back in time, and of satellites; these last are all the progenitors that at any time merge directly onto the main progenitor. By construction, for given simulation and descendant halo, the definition of the main progenitor depends on the time sampling (i.e. the number of snapshots): in principle it is possible that the main branch is not identified correctly if the time sampling is insufficient111For instance, consider a halo with mass at redshift that at redshift splits in two haloes of mass and , which, in turn, at redshift split, respectively, in two haloes of mass and , and in two haloes of mass and . When the main branch is misidentified if the snapshot is missing. . However, Giocoli (2008), using simulations with time sampling similar to Le SBARBINE, has shown that the probability of misidentifying the main progenitor branch for galaxy cluster scale haloes is much below 10% in the redshift interval . In addition the consistence of our results with those obtained by Jiang et al. (2015, hereafter J15) with the DOVE simulation (Appendix A), which has a better time sampling, ensures us that the time sampling of our runs is good enough to uniquely follow the main halo progenitor branch back in time.
We define the halo-halo encounters between two subsequent snapshots by selecting in the higher-redshift snapshot all the pairs satellite-main progenitor. We indicate the physical properties of the main progenitor (sometimes referred to also as host halo) with the subscript “host” and those of the less massive progenitors (satellites) with the subscript “sat”. For each pair we then measure the masses ( and ), radii ( and ), relative position and relative velocity of the centres of mass. We apply the procedure described above to all the haloes of our sample and to all their main progenitors, back to the snapshot. In this way we build our catalogue containing all the halo-halo encounters in the redshift range that end up in cluster-size haloes at . Of course the number of encounters and their properties are different for different overdensities.
We note that not all the halo-halo encounters must be considered rapid mergers. By construction, our catalogue of halo-halo encounters include cases of satellite haloes that, after the encounter, escape from the main halo. In these cases the haloes are distinct at a given snapshot, are identified as a single halo at a later snapshot, but are again distinct at an even later time step. In the terminology of this work we then distinguish halo-halo encounters and halo-halo mergers. In Section 4.2 we will define a criterion to select the subsample of mergers in the whole sample of halo-halo encounters.
For each halo-halo encounter we define the mass ratio . In order to have a robust measure of the properties of halo-halo encounters and mergers, we limit our exploration to , where is a minimum mass ratio such that the number of particles of the satellite is at least 100. Clearly depends on the mass resolution of the simulations, on the explored redshift range and on the considered overdensity . In particular, we adopt for and , for and , and for . We verified that with these choices, for our sample of encounters in the redshift range , the number of satellites with never exceeds of the entire satellite population.
Using dark-matter only simulations to infer the properties of central-satellite galaxy mergers in clusters, we are implicitly assuming that the dynamical evolution of subhaloes orbiting massive host haloes is not significantly influenced by the presence of baryons. In fact, comparisons between dark-matter only and hydrodynamic cosmological simulations indicate that some properties of the subhalo mass function can be modified by the presence of baryons (Chua et al., 2017, and references therein). However, the effect is negligible for the relatively high satellite-host mass ratios considered in this work (see figure 1 of Chua et al. 2017).
3 Orbital parameters of halo-halo encounters
It is useful to describe an encounter between two haloes in terms of the orbital parameters calculated in the point-mass two-body approximation. This description, though not rigorous for extended objects, is often used in the study and classification of mergers of galaxies (e.g. Boylan-Kolchin et al., 2006; Nipoti et al., 2009) and dark-matter haloes (e.g. Khochfar & Burkert, 2006; Posti et al., 2014). Here we define the point-mass two-body approximation orbital parameters of halo-halo encounters, following the formalism of N17. The orbit can be fully characterised by the pair of parameters orbital energy and angular momentum. For a halo-halo encounter we define the two-body approximation orbital energy per unit mass
| (3) |
where , is the relative distance and is the relative speed, between their centres of mass. It is useful to decompose in its radial component and its tangential component, with modulus . The modulus of the orbital angular momentum per unit mass is . At fixed separation and energy , the modulus of the maximum allowed specific angular momentum is
| (4) |
where is the relative speed when the two haloes have separation . Clearly, is such that .
Another set of orbital parameters used to classify halo-halo encounters (e.g. Benson 2005; J15) is the pair (, ), where, given a distance from the centre of the host system (for instance the overdensity radius ), is the relative speed at , is the radial component of the relative velocity at and
| (5) |
is the host circular velocity at .
Given the finite time sampling (i.e. the finite number of snapshots), in our simulations we have information on the halo-halo relative velocity when the two haloes have a separation that is in general larger than . As discussed in several previous works (e.g. Benson 2005, J15), it is thus necessary to apply a correction to recover (, ) measured when the satellite crosses the desired overdensity radius of the host (i.e. when the separation is ). We correct the velocity as follows. We first compute the relative velocity at , assuming that the point-mass two-body energy and angular momentum are conserved: is such that
| (6) |
and
| (7) |
where is the tangential component of . If, as in most cases, equations (6) and (7) give , the modulus of the radial component of is . If, instead, equations (6) and (7) give (which indicates that the point-mass two-body orbit is too crude an approximation), we simply fix and . Finally, we define the corrected velocity at the time of crossing () to be such that
| (8) |
and
| (9) |
We verified that this is a reasonably good approximation by comparing the distributions of our sample of haloes with previous literature work (see Appendix A).
4 Results
4.1 Halo masses and radii at different overdensities
The ratios and are decreasing functions of (see Despali et al., 2017). The exact values of these ratios depend on the halo mass density distribution through the halo concentration parameter (Giocoli et al., 2012). We computed and for all haloes in our sample (i.e. the 101 haloes and all their main progenitors in all previous snapshot back to (altogether 1224 haloes; Section 2.2). The means and standard deviations of the distributions of and are reported in Table 1 for , , and . For the highest overdensity here considered , the average values are and . The distributions of and are broader for increasing , with standard deviations in the range for and for .
In the following sections we will compare our results with those of simulations of satellites in isolated host haloes (N17), in which the merger orbital parameters were measured at a radius , where is the halo scale radius. If we identify the truncation radius of N17 with , we have and that the mass contained within is . Therefore the region probed by N17 is somewhat smaller than the most central region here considered () and roughly corresponds to an overdensity . It is useful to note that Kravtsov (2013) finds that, on average, the three-dimensional half-mass radius of the stellar distribution of observed central galaxies is (using the average ratio found for our sample of haloes; see Table 1). Therefore, in terms of , we have and , which indicates that both and probe the region of the halo occupied by the stellar distribution of the central galaxy.
| 200 | 0.848 | 0.097 | 0.807 | 0.082 |
|---|---|---|---|---|
| 5000 | 0.148 | 0.047 | 0.153 | 0.020 |
| 10000 | 0.085 | 0.032 | 0.100 | 0.015 |
| 20000 | 0.045 | 0.020 | 0.064 | 0.011 |
4.2 Mergers and fly-bys
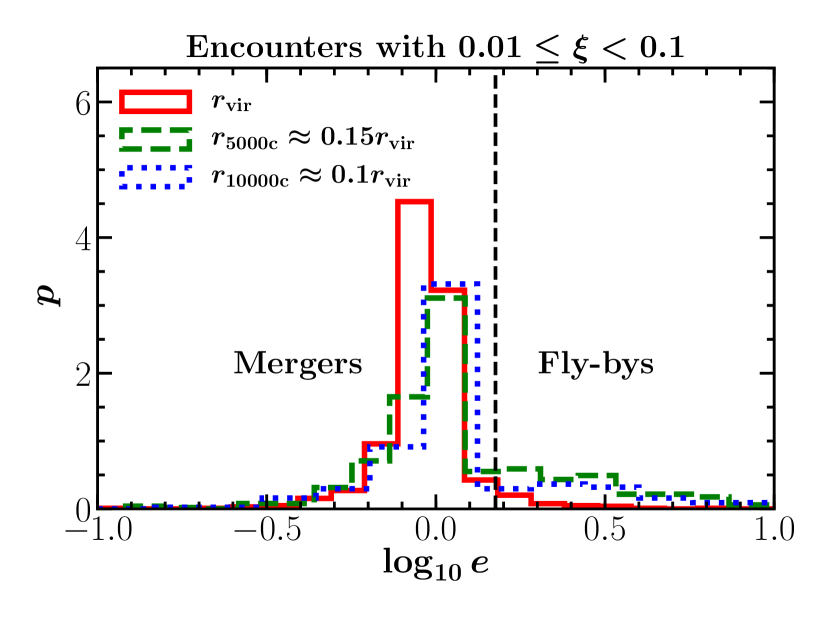
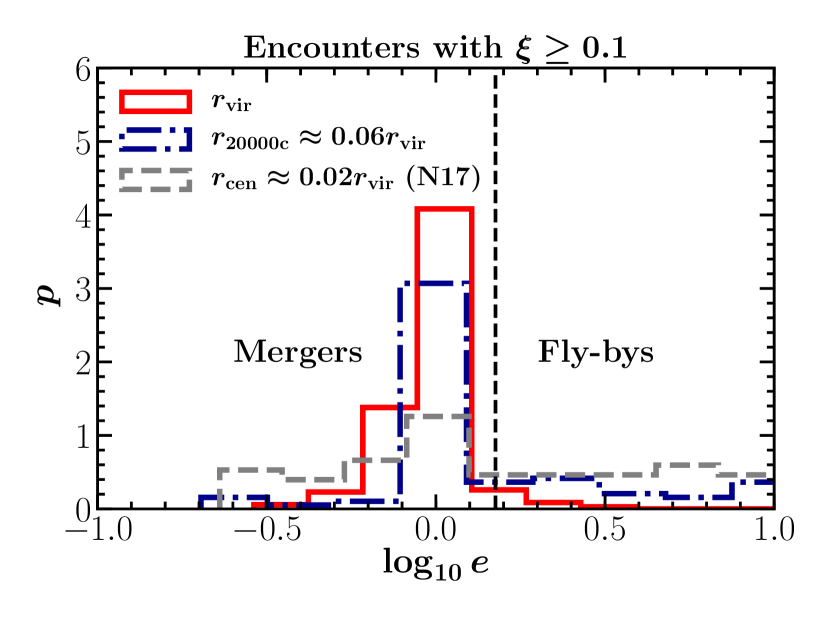
As mentioned in Section 2.2, we do not expect to have a rapid merger for all halo-halo encounters. Rapid mergers occur when the orbits are bound (), but also for unbound orbits (), provided the orbital angular-momentum modulus is sufficiently low (see section 7.4 of Binney & Tremaine, 1987). For this reason, a convenient parameter that can be used to identify mergers is the orbit eccentricity
| (10) |
which, for , is an increasing function of both and . As in N17, we take as fiducial discriminating value of eccentricity and classify an encounter as a merger when and as a fly-by when . The eccentricity distributions for our samples of halo-halo encounters with mass ratio are shown in Fig. 1 (upper panel) for , and (corresponding to radii , and , respectively; see Section 4.1). The distribution of the eccentricity for encounters with mass ratio is shown in the lower panel of Fig. 1 for and (corresponding to radii and , respectively; see Section 4.1). In the same panel we plot also the distribution found by N17 for numerical models of satellites orbiting in isolated haloes with and , measured at (see Section 4.1). From Fig. 1 it is clear that most of the encounters are indeed classified as mergers: the adopted cut in eccentricity allows us to effectively exclude the tail of high-eccentricity orbits, which are most likely fly-bys. The number of mergers and the total number of encounters for our sample are reported in Table 2 for different values of and intervals of .
As a quantitative test of our classification of mergers and fly-bys, we analysed the post-encounter evolution of the satellites in the catalogue with mass ratio . In practice, for each encounter occurring between the snapshots at redshifts and , we check whether the satellite and the main halo are distinct (i.e. the satellite has escaped) in the snapshot at redshift (clearly we exclude the case , because the snapshot at is the last; see Section 2.2). We find that the satellite escapes in 80% of the encounters classified as fly-bys and in 15% of the encounters classified as mergers, which suggests that our classification is sufficiently accurate. We verified that the selection of mergers is not sensitive to the exact value of : the main results of the present work are essentially the same for values of in the range .
4.3 Distribution of merger mass ratio
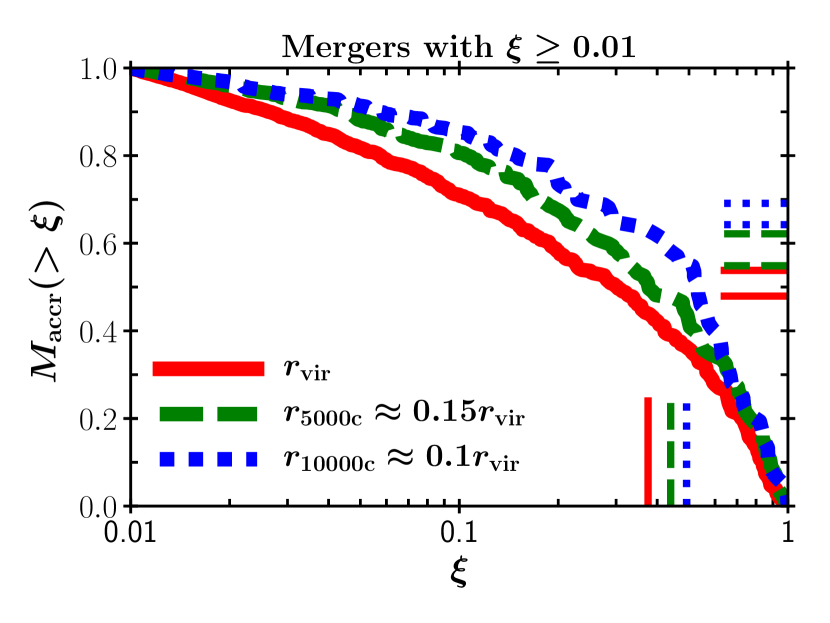
There are good reasons to expect mergers onto CGs in clusters to be characterised by a distribution of mass ratios different from that of cosmological halo-halo mergers measured at the virial radius. It is well known that dynamical friction, which is the main driver of galactic cannibalism, is more effective for more massive satellites, so we expect the typical mass ratio of mergers onto central galaxies to be higher than that of mergers at the virial radius of the host cluster. We can quantitatively explore this question by comparing the distributions of in halo catalogues obtained for different values of .
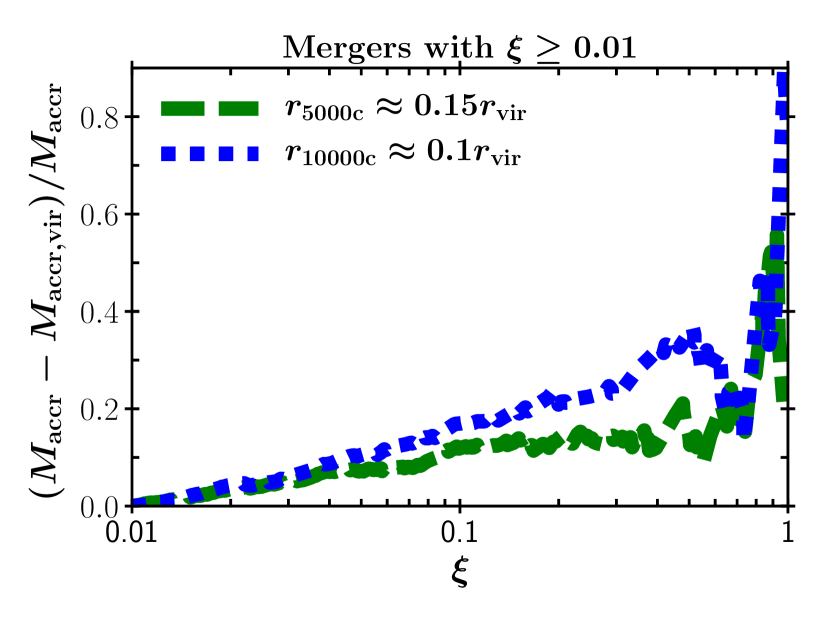
The upper panel of Fig. 2 shows, as a function of the mass ratio , the fraction of mass accreted in mergers with mass ratio larger than , normalised to the total mass accreted in mergers with mass ratio , for mergers measured at222Here we do not consider , because the corresponding sample of mergers has (see Section 2.2). , and . A clear trend emerges from this plot: in line with the expectations, mergers with higher mass ratios contribute more when more central halo regions are considered. The difference between the mergers measured at and those measured at higher overdensities becomes more and more important for (see lower panel of Fig. 2). The median value , such that half of the mass is accreted in mergers with mass ratio larger than , is 0.26 at , 0.37 at and 0.53 at . Another useful indicator of the characteristic mass ratio of mass accretion is the mass-weighted merger mass ratio (see Nipoti et al. 2012), which can be written as
| (11) |
where is the number-weighted average. As shown in Fig. 2 (upper panel), at , at , and at . For the innermost radius here probed () the characteristic merger mass ratio is close to .
Given a discriminant mass ratio between major and minor mergers, we can define as the fraction of mass accreted in major mergers in the redshift range (here the minimum mass ratio is ). For, respectively, , and we find , and (assuming ), and , and (assuming ). Taking the results for as a proxy for accretion onto the CG, we can conclude that (at least in the explored mass ratio interval ) more than of the mass accreted at by CGs in clusters is due to major mergers. This conclusion is qualitatively consistent with previous observational (Lidman et al., 2013) and theoretical (Rodriguez-Gomez et al., 2016) results on the role of major mergers in the build-up of massive CGs.
By definition, for given , depends on the minimum mass ratio . Here, for the reasons explained in Section 2.2, we have fixed , but of course also mergers with lower mass ratio contribute to the actual halo mass growth. The slopes at low of the curves in the upper panel of Fig. 2 suggest that the relative contribution of mergers with is more important at than at and . To quantify this effect, we computed assuming (thus relaxing our requirement that the satellites have at least particles): in this case we get values of that are only slightly smaller then those obtained for (for instance, by for measures at and by for measures at ). Thus, in this respect, our conclusion about the predominance of major mergers in the build-up of cluster CGs appears robust.
4.4 Orbital parameters for mergers with mass ratio
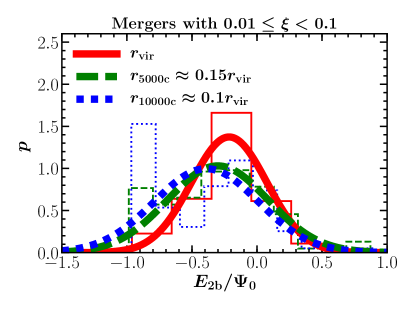
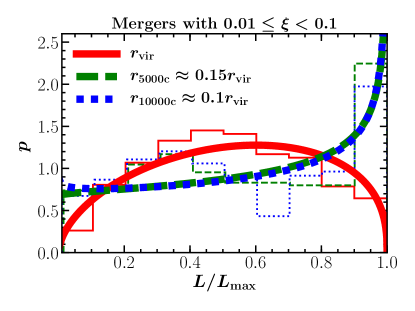
In this section we discuss the distribution of orbital parameters for mergers (i.e. encounters with eccentricity ) with mass ratio in the range , comparing the results for , and . Fig. 3 shows, for these samples of mergers, the distributions of the two-body specific orbital energy and of the modulus of the specific orbital angular momentum . is normalised to , which is the absolute value of the two-body gravitational potential of the encounter when the separation is . is normalised to (equation 4), which is the modulus of the maximum angular momentum for given orbital energy . We have fitted the distributions of with a Gaussian distribution
| (12) |
where is the mean and is the standard deviation, and the distributions of with a beta distribution
| (13) |
where
| (14) |
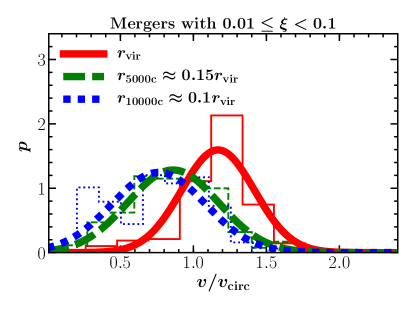
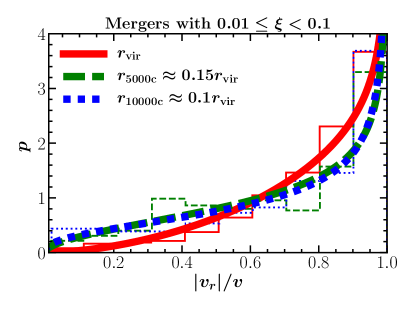
and is the gamma function. In Fig. 4 we plot the distributions of the orbital parameters and , which, as pointed out in Section 3, are a pair of parameters, alternative to and , often used to characterise the orbits of galaxy and halo encounters. We emphasise that, in the present context, this pair of parameters does not carry exactly the same information as and : and are evaluated at a separation (equations 8 and 9), while and are evaluated at the snapshot before the merger. Moreover, while is normalised to the main halo circular velocity , which is independent of the properties of the satellite, is normalised to , which depends also on the mass of the satellite (and therefore on the mass ratio ). The distributions of are fitted with a Gaussian (equation 12), while the distributions of are fitted with a beta distribution (equation 13). The best fitting distributions of , , and are over-plotted in the corresponding panels of Fig. 3 and Fig. 4, and their parameters are reported in Tables 3 and 4.
The distributions of (left-hand panel in Fig. 3) suggest that for higher values of (i.e. when more central regions of the haloes are considered) the orbits of mergers tend to be slightly more bound: the mean orbital energy for is more negative than that for , which in turn is more negative than that at (see Table 3). However, the distributions are relatively broad and there is substantial overlap. A qualitatively similar, but stronger trend can be seen in the distributions of (which is another measure of the binding energy of the orbit; left-hand panel in Fig. 4), which are characterised by larger offsets between the peak of the measures at and those at or . The fact that the distributions are more offset in than in comes from the fact that the accretion history for higher is characterised by higher merger mass ratios (see Section 4.3 and Fig. 2). As pointed out above, while ignores the properties of the satellite, the normalisation potential accounts for the mass ratio. In this sense, should give a cleaner measure of the binding energy of the orbits, when samples with different mass-ratio distributions are compared. We also note that the distributions of both and have higher scatter (larger standard deviation; see Table 3) for increasing .
The distributions of (right-hand panel in Fig. 3) and (right-hand panel in Fig. 4) suggest that for higher values of (i.e. when more central regions of the haloes are considered) the orbits of mergers tend to be significantly more tangential. Comparing the right-hand panels of Figs. 3 and 4, it is apparent that, for and , the distributions of both and peak at . This might be counterintuitive, because when . However, the relation between and , namely
| (15) |
is non-linear and such that, for instance, corresponds to . Thus, a peak at does not necessarily imply a peak at . Moreover, we recall that while is evaluated at , is evaluated at , so the right-hand panels of Figs. 3 and 4 do not contain exactly the same information.
The distributions of and for and are almost indistinguishable, but they are significantly different from those obtained for . For the higher overdensities, the mean values of and are, respectively, higher and lower than those obtained for (see Table 4). The difference between measures at and those at is best visualised in the right-hand panel of Fig. 3: the distribution of for measures at drops for , where instead the distributions for more central measures peak. The values of the standard deviation reported in Table 4 indicate that the distributions of and have larger scatter for and than for . Overall, the results presented in this section lead us to conclude that, for mergers with , the orbits of mergers at are more bound and more tangential than those at .
| Parameter | ||||
|---|---|---|---|---|
| -0.21 | 0.29 | |||
| -0.30 | 0.39 | |||
| -0.39 | 0.40 | |||
| -0.24 | 0.23 | |||
| -0.31 | 0.37 | |||
| -0.33 | 0.31 | |||
| 1.17 | 0.25 | |||
| 0.86 | 0.31 | |||
| 0.76 | 0.32 | |||
| 1.28 | 0.21 | |||
| 0.99 | 0.39 | |||
| 1.39 | 0.35 |
| Parameter | ||||||
|---|---|---|---|---|---|---|
| 1.58 | 1.38 | 0.53 | 0.25 | |||
| 1.01 | 0.71 | 0.59 | 0.30 | |||
| 0.96 | 0.69 | 0.58 | 0.30 | |||
| 1.57 | 2.16 | 0.42 | 0.23 | |||
| 0.81 | 0.85 | 0.49 | 0.31 | |||
| 1.99 | 0.68 | 0.75 | 0.23 | |||
| 2.69 | 0.78 | 0.78 | 0.20 | |||
| 1.51 | 0.67 | 0.69 | 0.26 | |||
| 1.39 | 0.60 | 0.70 | 0.26 | |||
| 3.70 | 0.67 | 0.85 | 0.16 | |||
| 1.24 | 0.43 | 0.75 | 0.27 | |||
| 1.28 | 1.05 | 0.55 | 0.27 |
4.5 Orbital parameters for mergers with mass ratio
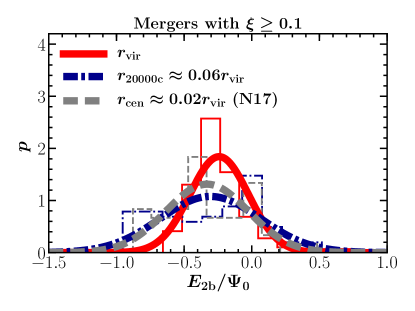
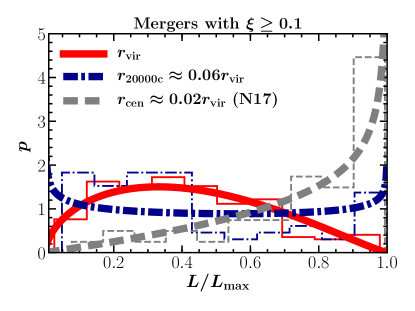
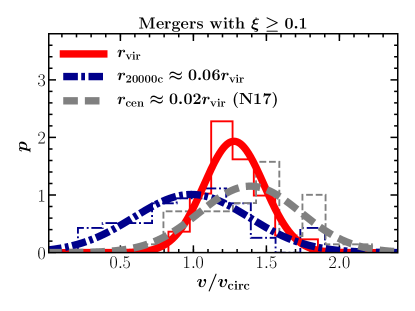
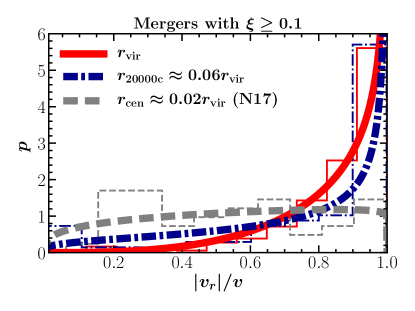
We focus here on the distribution of orbital parameters for mergers with mass ratios in the range . As we limit ourselves to the mass ratios higher than , we can consider here the overdensity (see Section 2.2), which probes the central region of the halo (see Section 4.1). As done in Section 4.4, we compare the results obtained for this central halo region with those obtained at . Moreover, in this case we can include in our analysis also the results of N17, who, using non-cosmological simulations, explored the distribution of orbital parameters at , roughly corresponding to , for merger mass ratios and (see Sections 4.1 and 4.2). Both and can be considered proxies for the characteristic size of the CG in a cluster of galaxy (see Section 4.1).
In Figs. 5 and 6 we plot the distributions of , , , and , together with their best fits. The parameters of the best fits (Gaussian distributions—equation 12—for and , and beta distributions—equation 13—for and ) are reported in Tables 3 and 4. The distribution of that we find at has slightly more negative mean than the distribution measured at (see right-hand-panel of Fig. 5), confirming the trend found in Section 4.4 for mergers with : the orbits of satellites accreting onto CGs tend to be slightly more bound than those of satellites accreting at the virial radius of the host cluster. The same result is visualised in Fig. 6 (left-hand panel), showing that the distribution of at peaks at lower values than the distribution of measured at .
It is interesting to compare the results at with those obtained at by N17. While the distributions of are very similar for and , the distributions of are significantly offset: in the experiments of N17 the values of measured at tend to be higher than those measured at , in contrast with the results obtained here for . The different behaviour between the distributions of and can be explained as follows. Though both quantities measure the binding energy of the orbit, as pointed out in Section 4.4 they are normalised quite differently: while accounts for the merger mass ratio , is independent of . The experiments of N17 have average merger mass ratio higher than our samples of mergers at and ( in the interval ). Moreover, we recall that in this work is measured at the snapshot before merger, while is corrected to be evaluated at (see Section 3): this is another source of difference between the distributions of and . Based only on measures of , compared to those of J15 (measured at ), N17 concluded that the orbits for CG-satellite mergers tend to be less bound than those of cosmological halo-halo mergers. The present analysis reveals that the higher values of found in the simulations of N17 at least partly reflect a bias in the merger mass ratios, which tend to be higher than cosmologically motivated values. In any case, the simulations here considered should, in general, be more realistic than the idealised simulations of N17, thus we believe that the distribution of here obtained for should be more representative for real CGs than the distribution found for in N17. Therefore, based on the results found for and , we can conclude that the orbits of satellites accreting onto CGs in clusters tend to be more bound than the orbits of satellites accreting onto the host cluster-size haloes.
The distributions of (right-hand panel in Fig. 5) and (right-hand panel in Fig. 6) indicate that, as it happens for mergers with , also for mass ratios the orbits measured at tend to be more tangential than those measured at (see also Table 4). In particular, the probability density function of is flatter for than for (the latter peaks at and drops above ); the probability density function of measured at has a strong peak at , which is absent for measures at . As far as the eccentricity of the orbits is concerned, the results obtained by N17 are consistent with those obtained here: the distributions of and measured at are biased towards, respectively, high and low values, even more than those found here for . Therefore the present results confirm and strengthen the finding of N17 that the orbits of satellites accreting onto CGs tend to be more tangential than those of cosmological halo-halo accretion at the virial radius.
As far as the scatter in the distributions is concerned, the trend for is the same as that for : for all the considered parameters (, , , ) the scatter is larger for higher values of (i.e. smaller radii; see Tables 3 and 4). The effect is strongest for , for which the best-fitting probability density function has standard deviation almost a factor of higher for measures at than for measures at . This is qualitatively in agreement with the findings of N17: the standard deviations for measures at are higher than those for measures at , with the only exception of , for which the scatter is the same in the two cases (Tables 3 and 4).
5 Conclusions
In this paper we have used the results of the dark-matter only cosmological -body simulations Le SBARBINE (Despali et al., 2016) to study the statistical properties of mergers between central and satellite galaxies in galaxy clusters. In particular we selected a sample of 101 cluster-size haloes at from the simulations Ada and Bice and traced their merging history in the redshift interval . We constructed merger trees for different overdensities . When we use the virial overdensity [, with ] we probe the accretion of satellites at the cluster virial radius (Giocoli et al., 2008; Giocoli, 2010). When we use higher overdensities (, and ) we probe the accretion of satellites in the central region of the cluster (at radii , and ), which can be considered as a proxy for the accretion of satellite galaxies onto CGs. We measured the distributions of merger mass ratios and orbital parameters for these merger histories. The main results of this work are the following.
-
•
Though minor mergers largely outnumber major mergers, the latter contribute to the mass accreted at at least as much as minor mergers, for all values of . The mass-weighted merger mass ratio increases for increasing , so major mergers are even more important for CGs than for the accretion at the cluster virial radius. In the mass-ratio interval , more than of the mass accreted by CGs at is due to major mergers ().
-
•
For higher overdensities (i.e. more central regions), the orbits of the accreting satellites tend to be less bound and more tangential. Therefore, the orbits of satellites accreting onto CGs are characterised by higher specific orbital angular momentum and lower specific orbital energy than orbits of halo accretion at the virial radius.
-
•
The scatter in the orbital parameters tends to be larger for accretion onto CGs than for accretion at the halo virial radius. In this respect, the strongest effect is found for the distribution of , which, for , has standard deviation almost a factor of 2 higher at than at .
-
•
We compared the results obtained at in our cosmological simulations with those obtained by N17 at in idealised non-cosmological simulations. We found good agreement on the distribution of orbital angular momentum, but we revised N17’s conclusions on the binding energy of the orbits, which were somewhat biased by the non-cosmological setting.
-
•
We provided parameters of the analytic best-fitting distributions of the pairs of orbital parameters (,) and (,) for different values of (Tables 3 and 4). The distributions obtained for (i.e. measured at ) can be taken as reference for modeling accretion onto CGs in clusters. In particular, the provided analytic distributions could be included in models attempting to predict the evolution of the scaling relations of cluster CGs without resorting to hydrodynamic cosmological simulations (e.g. Bernardi et al., 2011; Volonteri & Ciotti, 2013; Shankar et al., 2015).
Acknowledgements
We would like to thank Giuseppe Tormen (and the Physics and Astronomy Department of Padova) who provided the computational resources to run the simulations. CG acknowledges support from the Italian Ministry for Education, University and Research (MIUR) through the SIR individual grant SIMCODE, project number RBSI14P4IH.
Appendix A Distributions of the orbital parameters measured at
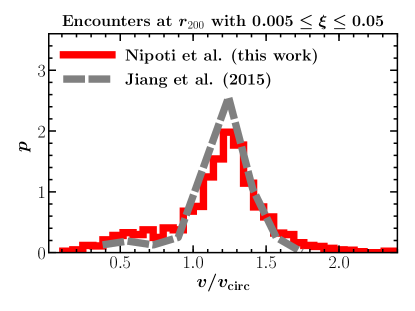
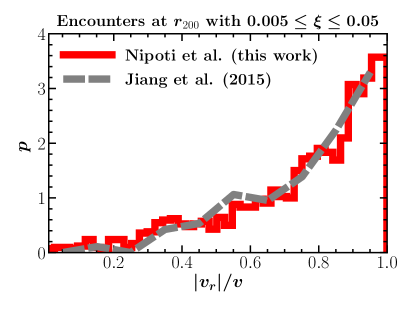
Here we compare the distributions of orbital parameters of the encounters experienced by the haloes of our sample with those found by J15 in the cosmological dark-matter only simulation DOVE. Specifically, we consider here the distributions of and found by J15 for dark-matter haloes of mass considering mergers with mass ratios in the range in the redshift interval , where is the formation redshift of the halo (for the distribution of peaks between and ; see J15). In order to compare our results with those of J15, we built the merger tree of our sample of 101 haloes with mass , taking all encounters with mass ratio . Altogether, in this way we select a sample of 1855 encounters (see Table 2). For these encounters we evaluated and at using equations (8) and (9). The results are shown in Fig. 7: overall the agreement between our distributions and those of J15 is remarkable. The peaks and the widths of the two distributions of (left-hand panel of Fig. 7) almost coincide, while the tail at low values of is somewhat stronger in our distribution than in the distribution of J15. The two distributions of (right-hand panel of Fig. 7) are in excellent agreement over the entire range . It must be noted that the time sampling of the DOVE simulation is significantly better than that of Le SBARBINE: for instance, in the redshift range the number of available snapshots is 38 for DOVE and 13 for Le SBARBINE. Thus, the agreement in the distributions of and between J15’s sample of encounters and ours suggests that the correction (Section 3) we applied to estimate the parameters at separation should be reliable.
References
- Bellstedt et al. (2016) Bellstedt S., et al., 2016, MNRAS, 460, 2862
- Benson (2005) Benson A. J., 2005, MNRAS, 358, 551
- Bernardi et al. (2007) Bernardi M., Hyde J. B., Sheth R. K., Miller C. J., Nichol R. C., 2007, AJ, 133, 1741
- Bernardi et al. (2011) Bernardi M., Roche N., Shankar F., Sheth R. K., 2011, MNRAS, 412, 684
- Binney & Tremaine (1987) Binney J., Tremaine S., 1987, Galactic dynamics. Princeton University Press, Princeton, NJ
- Boylan-Kolchin et al. (2006) Boylan-Kolchin M., Ma C.-P., Quataert E., 2006, MNRAS, 369, 1081
- Buchan & Shankar (2016) Buchan S., Shankar F., 2016, MNRAS, 462, 2001
- Chandrasekhar (1943) Chandrasekhar S., 1943, ApJ, 97, 255
- Chua et al. (2017) Chua K. T. E., Pillepich A., Rodriguez-Gomez V., Vogelsberger M., Bird S., Hernquist L., 2017, MNRAS, 472, 4343
- De Lucia & Blaizot (2007) De Lucia G., Blaizot J., 2007, MNRAS, 375, 2
- Despali et al. (2016) Despali G., Giocoli C., Angulo R. E., Tormen G., Sheth R. K., Baso G., Moscardini L., 2016, MNRAS, 456, 2486
- Despali et al. (2017) Despali G., Giocoli C., Bonamigo M., Limousin M., Tormen G., 2017, MNRAS, 466, 181
- Dubinski (1998) Dubinski J., 1998, ApJ, 502, 141
- Eke et al. (1996) Eke V. R., Cole S., Frenk C. S., 1996, MNRAS, 282
- Feldmann et al. (2010) Feldmann R., Carollo C. M., Mayer L., Renzini A., Lake G., Quinn T., Stinson G. S., Yepes G., 2010, ApJ, 709, 218
- Giocoli (2008) Giocoli C., 2008, Hierarchical Clustering: Structure Formation in the Universe. Phd Thesis, University of Padova, Padova, Italy, http://paduaresearch.cab.unipd.it/850/
- Giocoli (2010) Giocoli C., 2010, in J.-M. Alimi & A. Fuözfa ed., American Institute of Physics Conference Series Vol. 1241, American Institute of Physics Conference Series. pp 892–897 (arXiv:0911.2969), doi:10.1063/1.3462730
- Giocoli et al. (2008) Giocoli C., Tormen G., van den Bosch F. C., 2008, MNRAS, 386, 2135
- Giocoli et al. (2012) Giocoli C., Tormen G., Sheth R. K., 2012, MNRAS, 422, 185
- Hausman & Ostriker (1978) Hausman M. A., Ostriker J. P., 1978, ApJ, 224, 320
- Jiang et al. (2015) Jiang L., Cole S., Sawala T., Frenk C. S., 2015, MNRAS, 448, 1674
- Khochfar & Burkert (2006) Khochfar S., Burkert A., 2006, A&A, 445, 403
- Kravtsov (2013) Kravtsov A. V., 2013, ApJ, 764, L31
- Lauer et al. (2014) Lauer T. R., Postman M., Strauss M. A., Graves G. J., Chisari N. E., 2014, ApJ, 797, 82
- Lidman et al. (2013) Lidman C., et al., 2013, MNRAS, 433, 825
- Liu et al. (2008) Liu F. S., Xia X. Y., Mao S., Wu H., Deng Z. G., 2008, MNRAS, 385, 23
- Lynden-Bell (1967) Lynden-Bell D., 1967, MNRAS, 136, 101
- Marchesini et al. (2014) Marchesini D., et al., 2014, ApJ, 794, 65
- Merritt (1985) Merritt D., 1985, ApJ, 289, 18
- Naab et al. (2009) Naab T., Johansson P. H., Ostriker J. P., 2009, ApJ, 699, L178
- Nipoti (2017) Nipoti C., 2017, MNRAS, 467, 661
- Nipoti et al. (2009) Nipoti C., Treu T., Bolton A. S., 2009, ApJ, 703, 1531
- Nipoti et al. (2012) Nipoti C., Treu T., Leauthaud A., Bundy K., Newman A. B., Auger M. W., 2012, MNRAS, 422, 1714
- Ostriker & Tremaine (1975) Ostriker J. P., Tremaine S. D., 1975, ApJ, 202, L113
- Planck Collaboration et al. (2014) Planck Collaboration et al., 2014, A&A, 571, A16
- Posti et al. (2014) Posti L., Nipoti C., Stiavelli M., Ciotti L., 2014, MNRAS, 440, 610
- Rodriguez-Gomez et al. (2016) Rodriguez-Gomez V., et al., 2016, MNRAS, 458, 2371
- Ruszkowski & Springel (2009) Ruszkowski M., Springel V., 2009, ApJ, 696, 1094
- Shankar et al. (2015) Shankar F., et al., 2015, ApJ, 802, 73
- Tonini et al. (2012) Tonini C., Bernyk M., Croton D., Maraston C., Thomas D., 2012, ApJ, 759, 43
- Tormen (1998) Tormen G., 1998, MNRAS, 297, 648
- Tormen et al. (2004) Tormen G., Moscardini L., Yoshida N., 2004, MNRAS, 350, 1397
- Tremaine (1990) Tremaine S., 1990, The origin of central cluster galaxies.. pp 394–405
- Volonteri & Ciotti (2013) Volonteri M., Ciotti L., 2013, ApJ, 768, 29
- Vulcani et al. (2014) Vulcani B., et al., 2014, ApJ, 797, 62
- Vulcani et al. (2016) Vulcani B., et al., 2016, ApJ, 816, 86
- White (1976) White S. D. M., 1976, MNRAS, 174, 19