11email: pavel@astro.uni-bonn.de 22institutetext: Charles University in Prague, Faculty of Mathematics and Physics, Astronomical Institute, V Holešovičkách 2, CZ-180 00 Praha 8, Czech Republic 33institutetext: European Southern Observatory, Karl-Schwarzschild-Str. 2, 85748 Garching, Gernamy
33email: tjerabko@eso.org 44institutetext: 1 Physikalisches Institut, Universität zu Köln, Zülpicher Str. 77, 50937 Köln, Germany
44email: dinnbier@ph1.uni-koeln.de
Evidence for feedback and stellar-dynamically regulated bursty star cluster formation: the case of the Orion Nebula Cluster
A scenario for the formation of multiple co-eval populations separated in age by about 1 Myr in very young clusters (VYCs, ages less than 10 Myr) and with masses in the range is outlined. It rests upon a converging inflow of molecular gas building up a first population of pre-main sequence stars. The associated just-formed O stars ionise the inflow and suppress star formation in the embedded cluster. However, they typically eject each other out of the embedded cluster within yr, that is before the molecular cloud filament can be ionised entirely. The inflow of molecular gas can then resume forming a second population. This sequence of events can be repeated maximally over the life-time of the molecular cloud (about 10 Myr), but is not likely to be possible in VYCs with mass , because such populations are not likely to contain an O star. Stellar populations heavier than about are likely to have too many O stars for all of these to eject each other from the embedded cluster before they disperse their natal cloud. VYCs with masses in the range are likely to have such multi-age populations, while VYCs with masses in the range can also be composed solely of co-eval, mono-age populations. More massive VYCs are not likely to host sub-populations with age differences of about 1 Myr. This model is applied to the Orion Nebula Cluster (ONC), in which three well-separated pre-main sequences in the color-magnitude diagram of the cluster have recently been discovered. The mass-inflow history is constrained using this model and the number of OB stars ejected from each population are estimated for verification using Gaia data. As a further consequence of the proposed model, the three runaway O star systems, AE Aur, Col and Ori, are considered as significant observational evidence for stellar-dynamical ejections of massive stars from the oldest population in the ONC. Evidence for stellar-dynamical ejections of massive stars in the currently forming population is also discussed.
Key Words.:
Stars: formation; Stars: luminosity function, mass function; HII regions;open clusters and associations: individual: ONC1 Introduction
The Orion Nebula Cluster (ONC) is about 400 pc distant from the Sun (Menten et al., 2007; Kounkel et al., 2017), approximately Myr old, has a current stellar mass of partially embedded in molecular gas within a current half-mass radius of approximately 0.8 pc and a nominal cluster radius near pc (Hillenbrand & Hartmann, 1998; Da Rio et al., 2009; Megeath et al., 2016; Da Rio et al., 2017) and has been understood to be the nearest massive young stellar cluster allowing much detailed observational work, including the gas flows within and out of it (O’Dell et al., 2009; Mc Leod et al., 2016; Hacar et al., 2017a). The inner ONC has been known as the Trapezium cluster (Prosser et al., 1994). Within the nominal radius of the ONC, intense star-formation is still on-going (O’Dell et al., 2009) and the violent stellar-dynamical ejection of massive stars from this region has been mapped (Tan, 2004; Chatterjee & Tan, 2012; Luhman et al., 2017; Farias & Tan, 2017). The most massive O7V star, C Ori, is currently ionising part of the molecular gas within the ONC cluster and the Trapezium has been suggested to be astro-physically and stellar-dynamically very young (yr old, O’Dell 1998). C Ori is moving rapidly out of the Trapezium (O’Dell et al., 2009) suggesting that a stellar-dynamical encounter happened recently (Tan, 2004; Chatterjee & Tan, 2012; Farias & Tan, 2017). The central Trapezium of few massive stars has dimensions of only pc and is stellar-dynamically highly unstable with a short (yr) life-time (Pflamm-Altenburg & Kroupa, 2006). The ONC has a top-light stellar initial mass function (IMF) which would be consistent with a canonical IMF (Kroupa, 2001; Kroupa et al., 2013) if the cluster has efficiently expelled a large fraction of its more-massive-than- stars. That the ONC is actively expelling stars stellar-dynamically is evident from proper motion and radial velocity surveys (Poveda et al., 2005). Stellar-dynamical modelling of the ONC suggests it may be expanding due to the expulsion of residual gas (Kroupa et al., 1999; Kroupa, 2000; Kroupa et al., 2001; Scally et al., 2005). This is consistent with the overall evolution of embedded clusters into the Galactic field population (Lada, 2010) and the need for embedded clusters to rapidly (within a few Myr) expand to the radii of open clusters (Banerjee & Kroupa, 2017).
Observed very young and compact (half-mass radii smaller than 1 pc) star clusters with ages between about 1 and 3 Myr and masses in the range , such as the ONC, NGC3603 and R136, have been understood to have formed essentially monolithically over a time of about one Myr (Kroupa et al., 2001; Scally et al., 2005; Banerjee & Kroupa, 2013, 2014). This leaves little time for them to be assembled through hierarchical merging of pre-formed smaller clusters, because also the smooth spatial and kinematical distributions of the observed stars need to be reproduced (Scally & Clarke, 2002; Banerjee & Kroupa, 2015, 2018).
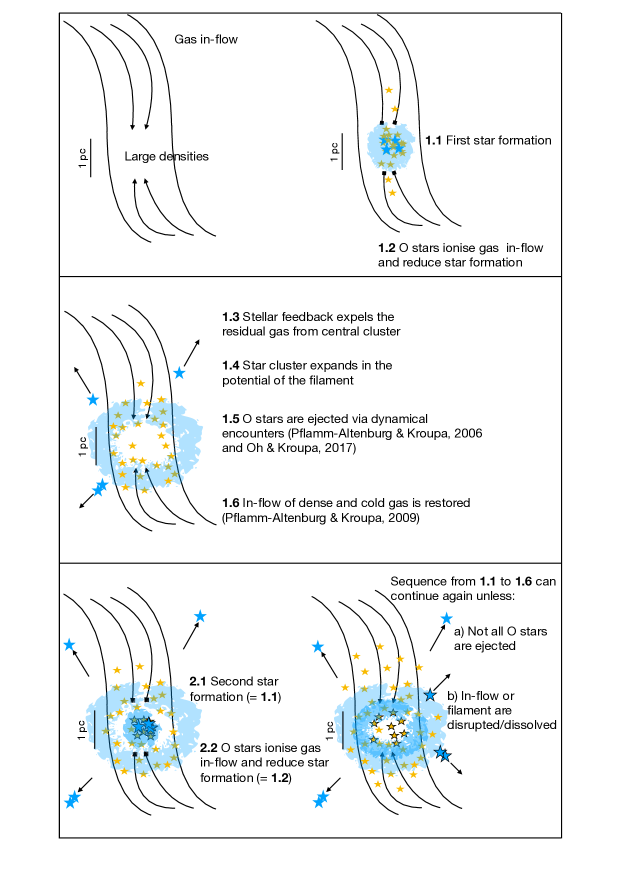
The OmegaCAM survey by Beccari et al. (2017) finds the colour-magnitude diagram of ONC stars to contain three well separated sequences. An interpretation offered by Beccari et al. (2017) based on these data is that the ONC contains three dominant populations of stars. Here we outline how a star cluster might form in-situ in a series of formation epochs (or ‘bursts’, each burst forming a co-eval stellar population monolithically, that is as one compact embedded cluster) from molecular gas supplied by one and the same molecular cloud filament. Recent modelling of the formation of star formation in self-gravitating, initially turbulent and magnetised molecular clouds shows that local star cluster formation in those simulations occurs on time scales of the order of yr associated with filamentary accretion and locally converging gas flows (Federrath 2015, 2016, see also Smith et al. 2016; Burkert 2017). Assuming the converging gas inflow along the molecular filament forms an embedded cluster over a fewyr (observational evidence: for example Schneider et al. 2012; Hacar et al. 2013, 2017b), star formation within the embedded cluster can be stopped due to the ionisation of the inflowing molecular filaments and blow-out of residual gas by a first generation of O stars. These are expelled from the cluster core through three- and four-body encounters, allowing the inflow to resume and to build up a next generation, provided the O stars did not disrupt the entire molecular cloud before they ejected each other.
This model is thus based on a combination of termination of star formation through O stars, the blow-out of the residual gas and subsequent expansion of the already monolithically formed stellar population (Kroupa et al., 2001) and stellar-dynamical ejection of the ionising stars from the cluster (Pflamm-Altenburg & Kroupa, 2006; Oh et al., 2015; Oh & Kroupa, 2016) such that the cloud is not disrupted and the cluster can resume accretion from the cold molecular cloud (Pflamm-Altenburg & Kroupa, 2009). These authors explicitly calculated (their sec. 6) that VYCs weighing down to can accrete cold gas. This process can repeat itself, such that this model suggests a possible explanation of the time- and spatial-structure of the stellar population(s) in the ONC as observed by Beccari et al. (2017). These observations may thus provide exquisite evidence of how a stellar cluster is build-up by consecutive gas-accretion phases subject to a fine level of self-regulation through feedback which is interrupted by stellar-dynamical processes. We emphasise that this may not be the only viable scenario for explaining the apparent multiple age populations in the ONC. Here we merely discuss and propose it as one of the possibilities.
2 Model
2.1 Preliminaries
According to Beccari et al. (2017) the colour-magnitude diagram of the ONC contains three well separated sequences, posing a challenge to the theory of how such clusters form. The authors note that the interpretation that these may be due to unresolved multiple stellar systems would require an unusual mass-ratio distribution not favoured by the observed properties of multiple systems (Belloni et al., 2017). This rejection needs to be treated with the caveat that it may be possible that the youngest population evident in the colour–magnitude diagramme may be the binary-star sequence of the second oldest population, which by chance overlays the binary sequence of the oldest population. The youngest population, rather than being the youngest, could also be made up of triple stars of the oldest population. Since younger populations are more concentrated this hypothesis would require the binary stars to have mass-segregated. The stars mapped by Beccari et al. (2017) have masses in the range . The mass-segregation time-scale for systems is roughly Myr (Eq. 6 and 7 in Kroupa 2008), making this an unlikely possibility, subject to the additional constraint that the binary population ought to have a realistic mass-ratio distribution (Beccari et al., 2017). Stellar-dynamical modelling would be needed to study this possibility, namely that the ONC is the outcome of a single burst that happened 3 Myr ago, that is that it consists of only one population of single, binary- and triple systems, instead of two and possibly three populations separated by age.
The alternative interpretation that the younger populations may constitute fore-ground is also excluded by Beccari et al. (2017) on the grounds that the putative foreground population would need to be only at a distance of about 200 pc from the Sun and by the spatial extend of the stars correlating with their age. Essentially, the apparently younger, putative fore-ground population would show a comparable spatial extend but it is observed that the concentration decreases with age.
That the older sequences may constitute captured populations from pre-existing pre-main sequence stars (PMSs) in the region (Pflamm-Altenburg & Kroupa, 2007) may be viable, as they would also be more spatially extended. However, in this case the intermediate population would have to have had a smaller velocity dispersion as it is also intermediately concentrated around the ONC between the youngest and oldest.
Another interpretation offered by Beccari et al. (2017) is that the ONC contains three dominant populations of stars with ages of yr, corresponding to 2.88, 1.86 and 1.23 Myr. It is important to note that these ages were calculated in Beccari et al. (2017) as the mean ages of the stars in the three discovered populations, were the ages of each single star was taken form the age estimation given in Da Rio et al. (2016). An independent check using PMS isochrones-fitting from Bressan et al. (2012) seems to show consistent median ages for the oldest population but slightly younger median ages for the reddest populations. The three populations would then show an age of 3, 1.8 and 0.8 Myr, respectively (Beccari, private communication).
For the present contribution we assume the three PMS populations discovered by Beccari et al. (2017) to be three age sequences with these ages. The youngest stars comprise the smallest group in Beccari et al. (2017), are the fastest rotators and are also more centrally concentrated within the ONC than the older stars. Given the young age it is postulated here that this youngest population is still forming, because the ONC has, within its embedded molecular cloud region, active on-going star-formation. The oldest population comprises the most massive group and is distributed around the ONC and also follows the surrounding integral-shaped filament which appears to feed the ONC with gas (Hacar et al., 2017a).
2.2 Ansatz
Assuming that a molecular cloud forms a filament with a variable density along its length, it follows that molecular gas flows from both sides along the filament into the densest region which constitutes the local potential well (Burkert, 2017). Hacar et al. (2017a) have mapped the accelerated motion of molecular gas into the ONC finding that the current inflow rate is about per molecular finger implying about for the seven molecular fingers detected in OMC-1. Over Myr the inflow, if constant over this time, would accumulate a mass of . The inflow may have been larger in the past (for example, the ionising star C Ori is currently affecting the observed inflow of molecular material). Also, the star formation efficiency (SFE) on an embedded-cluster (one-pc) scale is . This is found observationally (Lada & Lada, 2003; André et al., 2014; Megeath et al., 2016), and the stellar-dynamical modelling of the ONC, NGC3603 and R136 yield corroborative and consistent values also (Banerjee & Kroupa, 2018). Thus, a mass comparable in order of magnitude to the observed mass of the ONC will have build-up.
The inflow builds up a population of PMSs, this taking typically a few yr to a Myr. This can be deduced observationally in forming embedded clusters (for example the Taurus-Auriga groups, Oph, NGC 1333, Hacar et al. 2013, 2017b). Duarte-Cabral et al. (2013) find the formation times of high- and low-mass stars cannot be distinguished, being about yr. Simulations also show that 95 per cent of the mass of a star is acquired in about 0.1 Myr (Wuchterl & Tscharnuter 2003, see also Kuruwita et al. 2017). The fibers of molecular cloud filaments observed by Hacar et al. (2017b), in which the newest generation of proto-stars is forming, can have a life-time of only half a crossing time through NGC1333 which is about 0.5-1 Myr. The most-massive stars form in the densest regions near the centre of the proto-cluster. This is observed to be the case (Bontemps et al., 2010; Lane et al., 2016; Kirk et al., 2016), and star-formation simulations also show primordial mass segregation Maschberger & Clarke 2011; Bonnell & Smith 2011). Also, it is observed that the more massive the embedded cluster is, the more massive is the most massive PMS in it (Megeath et al., 2016; Ramírez Alegría et al., 2016; Stephens et al., 2017; Yan et al., 2017). Monolithically-formed embedded clusters typically have radii smaller than a pc (Marks & Kroupa, 2012).
The radiation of stars more massive than about ionises the inflow. Further inflow of molecular star-forming gas into the inner region of the cluster may thus be shut-off once the embedded cluster spawns ionising stars. Star-formation may continue within the molecular filament such that not all star formation is necessarily stopped, but the star-formation rate in the embedded cluster is likely to be reduced in the presence of ionising stars. Stars formed in the filaments may orbit through the embedded cluster but will reach to larger radii on the other side because they decouple from the hydrodynamics and become ballistic particles on a time-scale of about yr (Wuchterl & Tscharnuter, 2003; Duarte-Cabral et al., 2013).
A sketch of the here presented scenario is shown in Fig. 1. Next we estimate the masses of the formed populations and the number of ionising stars these are likely to have had.
2.3 The three populations
For a given mass of a stellar population one can estimate the masses of the ionising (O, B) stars, once the IMF and sampling method (random, optimal) is assumed. Since the past inflow history is not known, the masses of the populations are estimated from the observed relative population numbers as determined by Beccari et al. (2017) and assuming a total mass of the ONC stellar population. Given an estimate of the population’s mass, the IMF allows a quantification of the number of ionising stars. The IMF in nearby star forming regions can be well described by an invariant canonical IMF (Kroupa, 2001, 2002; Bastian et al., 2010). The canonical IMF can be conveniently represented by two power-law segments, , where for and (the Salpeter value) for . Here, is the infinitesimal number of stars in the infinitesimal stellar-mass interval , and is the most massive star in the population. To sample stellar populations, two approaches are employed here:
-
1.
Mass-constrained random sampling: the IMF is sampled randomly until the desired population mass is achieved within a tolerance of , rejecting stars until the population mass is reached with a deviation of up to this amount. Here is the fundamental upper mass limit (Weidner & Kroupa, 2004; Figer, 2005; Oey & Clarke, 2005; Koen, 2006; Banerjee et al., 2012). Since random sampling gives Poisson scatter to the final stellar population, each of the three populations is sampled 10000 times and the mean values and values corresponding to dispersions are listed in Table 1.
-
2.
Optimal sampling (Kroupa et al., 2013): the most massive star is given by the total mass of the co-eval stellar population which has a distribution of stellar masses following the canonical IMF. This sampling method leads naturally to the observed relation, (Weidner & Kroupa, 2006; Kirk & Myers, 2011, 2012; Weidner et al., 2013; Kroupa et al., 2013; Megeath et al., 2016; Ramírez Alegría et al., 2016; Stephens et al., 2017; Yan et al., 2017). The mathematical procedure of optimal sampling may be interpret physically as reflecting perfect self-regulation of the forming stars and star cluster (Adams & Fatuzzo, 1996; Kroupa et al., 2013). It has been suggested that the available data appear to prefer optimal over random sampling (for example Yan et al. 2017). From Fig. 1 in Yan et al. (2017) or Fig. 4-5 in Kroupa et al. (2013) it follows that a canonical co-eval stellar population with a mass of contains one most-massive star with . Although stars are also sufficiently luminous to ionise molecular gas, here a conservative approach is taken by considering only stars with spectral types earlier than about O8.9 as being particularly destructive. Stellar-dynamical ejections of such stars become effective for canonical co-eval stellar populations with containing from a few OB stars to a few O stars, respectively, noting that B star binaries can be effective in ejecting an O star. To sample stars optimally the GalIMF module from Yan et al. (2017) is employed111The source code is freely available on the github repository. The GalIMF version 1.0.0 with associated programs is available at https://github.com/Azeret/galIMF, which is the whole galIMF branch. The here-used code is found in the example_OS_EC.py file..
For all computations it is assumed that the total existing stellar mass of the ONC today is , with the formation of the third stellar population still continuing. This allows an estimation of the stellar masses of the individual existing stellar populations (Table 1), given that Beccari et al. (2017) provide measurements of their relative fractions.
The mass of the third and currently forming population is calculated assuming that C Ori is a binary with a total mass of (Kraus et al., 2009) such that the most-massive and second-most massive star in the population has a combined mass near this value. This gives a model mass of the third population of , which then allows the calculation of the individual stellar masses listed in Table 2, using optimal sampling.
It is to be noted that the sequences of masses given here depends on the population masses and should therefore be taken to be illustrative rather than definitive. Nevertheless, the masses of individual stars are in agreement with the observational data. For example, the three most massive stars in the first (oldest) population appear to be similar to the three runaway O stars ejected from the ONC about 2.5 Myr ago (see Sec. 3). By construction, the first and second most massive star of the third (now forming) population combined (), correspond very closely to the mass of the binary system C Ori (Kraus et al., 2009), this being a result of the model mass estimate used in optimal sampling. The number of stars in the third population more massive than is in agreement between model and the observed ONC, which currently has ten of these (Pflamm-Altenburg & Kroupa, 2006). We note that Pflamm-Altenburg & Kroupa (2006) assumed a population mass of for the ONC. It must therefore have ejected 30 stars more massive than , which is similar to what the present model also implies (see below).
| pop. | RS | ||
|---|---|---|---|
| OS | 2 | 18 | |
| pop. | RS | ||
| OS | 1 | 10 | |
| pop. | RS | ||
| OS | 1 | 13 |
| , | , | , |
|---|---|---|
| [] | [] | [] |
| 32.9 | 22.3 | 27.0 |
| 22.9 | 15.3 | 18.6 |
| 18.0 | 11.8 | 14.5 |
| 15.0 | 9.8 | 12.0 |
| 13.0 | 8.4 | 10.4 |
| 11.4 | 7.4 | 9.1 |
| 10.2 | 6.7 | 8.2 |
| 9.3 | 6.1 | 7.5 |
| 8.6 | 5.6 | 6.9 |
| 8.0 | 5.2 | 6.4 |
| 7.4 | – | 5.9 |
| 7.0 | – | 5.6 |
| 6.6 | – | 5.3 |
| 6.2 | – | – |
| 5.9 | – | – |
| 5.7 | – | – |
| 5.4 | – | – |
| 5.2 | – | – |
2.4 Suppressing star formation
Having specified the three stellar populations, the question addressed now is whether the populations can ionise the inner region of the embedded cluster while not destroying the entire cloud within more than a pc radius, before the ionising stars eject each other out of the forming embedded cluster.
Once formed, massive stars () ionise the surrounding gas almost instantly, heating it up from K to K. In a static homogeneous neutral cloud, the radius within which the gas is ionised is the Strömgren radius,
| (1) |
where (Draine, 2011) is the hydrogen recombination coefficient into excited states and is the number of ionising photons/s produced by the stellar population. This radius is given by the balance between ionisation and recombination. The pressure in the ionised region is increased by approximately 3 orders of magnitude so that the ionised region tends to expand into the cold cloud. The ionised medium inside the HII region is separated from molecular or atomic gas outside by an ionisation front. For a source producing ionising photons per second placed in a homogeneous medium of particle density , and neglecting the self-gravity, the position of the ionisation front expands with time as (cf. Spitzer 1978; Hosokawa & Inutsuka 2006)
| (2) |
where km/s is the sound speed in the HII region.
Comparing the number of observed ultracompact (UC)HII regions (size pc) with the number of observed O stars, and taking into account the typical life-time of O stars, Wood & Churchwell (1989) infer that UCHII regions last for significantly longer (Myr) than expected from Eq. 2. Instead of expansion, some UCHII regions show inward motions (Keto & Wood, 2006; Klaassen & Wilson, 2007).
The observed longevity and inward motions of UCHII regions can be explained by accretion at high rates (yr) towards the central parts of the forming cluster as shown by detailed 3D hydrodynamical simulations performed by Peters et al. (2010a, b). The gravitational well near massive stars is so deep that accretion flows are accelerated to a velocity enough to swamp the immediate surroundings of the young massive stars so that the UCHII region cannot continuously expand, and Eq. 2 cannot be applied. However, because the inner regions infall faster than the outer regions, the influx of matter decreases, and the accretion disk (Chini et al., 2004, 2006; Nürnberger et al., 2007) around the forming proto-star allows the polar regions to be ionised (Nielbock et al., 2007). The UCHII region is highly non-spherical, and the ionisation front rapidly fluctuates. De Pree et al. (2014) observe fluctuations or flickering of 41 UCHII regions in the Sgr B2 region, and find very good agreement with the explanation proposed by Peters et al. (2010a). About 95 % of the mass of the final star accretes within about 0.1 Myr (Wuchterl & Tscharnuter, 2003; Duarte-Cabral et al., 2013), setting the life-times of the UCHII regions.
After the initial UCHII stage, massive stars clear the young cluster from the remaining gas: Observations (Lada & Lada, 2003; Lada, 2010; André et al., 2014; Megeath et al., 2016) suggest that more than 60% of the total mass of embedded star clusters is in the form of gas being removed by the action of massive stars. Another piece of evidence for rapid (at velocity km/s) removal of of the total mass in the form of gas comes from the comparison between the observed density and velocity profiles of very young clusters (ONC, NGC 3603, R 136) and Nbody simulations (Banerjee & Kroupa, 2018). Rapid removal of this amount of mass can also explain the increase of radii from the embedded stage (comparable to the widths of the molecular-gas filaments, Marks & Kroupa 2012) to the current stage of exposed star clusters (Banerjee & Kroupa, 2017). High-resolution magnetohydrodynamical simulations of proto-stellar formation also imply that a large fraction of the accreting gas is channeled outwards into outflows (Machida & Matsumoto, 2012; Bate, 2014; Federrath et al., 2014; Kuruwita et al., 2017).
Another assumption which limits the validity of Eq. 2 is the homogeneity of the surrounding gas. Whitworth (1979) and Tenorio-Tagle (1979) show that the HII region expands further in the direction of the lowest column density as observed from the ionising star. When the gas reaches low density regions of the molecular cloud, it erupts outwards forming a champagne flow (Tenorio-Tagle, 1979). When the eruption occurs, the HII region is evacuated and its ability to shield the ambient cloud from ionising photons decreases substantially. This happens because the ionised hydrogen, which recombines on a time-scale of about 100 yr for protons/cm3, flows out, thus allowing more ionising photons to reach the ionising front. The cloud is rapidly photo-evaporated from the inside, with the ionised gas streaming in the opposite direction out of the cluster. Currently, the HII region ionised by the ONC is highly non-spherical, elongated towards the Sun, with the Trapezium located near the side of the more distant edge of the cloud (Wen & O’dell, 1995; O’dell, 2001). Gas is photo-evaporated mainly at this edge of the cloud streaming towards us.
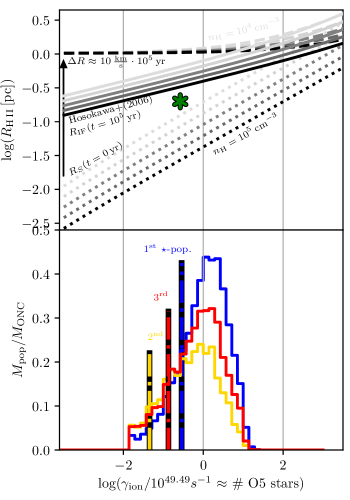
Given the complexity of the configuration mentioned above, the detailed damage done to the cloud by the ionising stars need to be accessed with detailed radiation-transfer-hydro-dynamic simulations. In this work order-of-magnitude estimates are performed which is sufficient to study if the here proposed mechanism for producing multiple co-eval populations in a VYC may be plausible. To do so, the ionising fluxes of all stars of one co-eval population are combined to calculate using the data provided by Sternberg et al. (2003). The upper limit of the extent of the ionised region is calculated assuming that the champagne flow occurs immediately and that the ionisation front advances inwards the cloud and away from the co-eval population with a velocity of km/s for Myr. The initial radius of the ionisation front is assumed to start at for a plausible range of particle densities for the ONC (Felli et al., 1993). The estimates of the distance from the source of the ionisation front are evident in the upper panel of Fig. 2. The abscissa shows the ionising photon production rate, , in units of O5V stars (the luminosity of an O5V star is adopted from table 1 of Sternberg et al. 2003). The distance from the source to the ionisation front is shown by dashed lines in the upper panel of Fig. 2. The Strömgren radius is plotted for the plausible density range (see Eq. 1), representing the lower estimate by dotted lines. The estimate based on Eq. 2 is plotted by solid lines. The current state of the HII region in the ONC, as shown by the green asterisk based on the date from Felli et al. (1993), is in agreement with the estimates. Assuming that massive stars are present for a few Myr, these estimates indicate that massive stars from the previous two populations were able to prevent star formation and largely dispersed the innermost pc of the filamentary cloud, but more distant parts were preserved and could resume falling inwards into the cluster.
2.5 Competition of time-scales
In general, for a sufficiently low-mass proto-cluster of stars, which contains only a few hundred stars and thus at most a few OB stars, the central core containing the OB stars which are almost exclusively formed in energetic binaries (Sana et al., 2012; Moe & Di Stefano, 2017), is dynamically very unstable. Ejection of the massive stars occurs through energetic three- and four-body encounters in the core, and is significantly enhanced for a realistic binary population. This process of producing runaway massive stars into the Galactic field has been calculated for a large ensemble of young clusters using the Aarseth-Nbody6 code by Oh et al. (2015). The result is that the observed runaway and isolated O star population in the Galactic field can be well accounted for by realistic clusters and binary populations. The core ejects its massive members within a few crossing-time scales, that is within yr (Pflamm-Altenburg & Kroupa, 2006). A large theoretical survey of the dynamical evolution of young clusters containing all stars initially in a realistic binary population (Sana et al., 2012; Belloni et al., 2017) shows that clusters with a mass near and can expel all their few most massive stars (Oh et al., 2015; Oh & Kroupa, 2016).
How likely is it that all massive stars are ejected from the low-mass embedded cluster within 1 Myr? Pflamm-Altenburg & Kroupa (2006) performed a survey using high accuracy and -precision chain-regularisation dynamical modelling of Trapezium-like clusters containing 4, 10 and 40 stars more massive than and reflecting the masses of the observed ten massive stars in the ONC. The result is that all such stars are ejected in about 45 (62) per cent of the cases after 0.5 (1.0) Myr for clusters with initially 4 massive stars, all stars are ejected in about 32 (45) per cent of the cases after 0.5 (1.0) Myr for clusters with initially 10 massive stars, and all stars are ejected in about 1 (7) per cent of the cases after 0.5 (1.0) Myr for clusters with initially 40 massive stars. The ejection of all most-massive stars is thus not rare for low-mass embedded clusters. If one considers only stars more massive than , then the cases when all such stars are ejected would be more frequent, extending the range of masses of co-eval populations to (Sec. 2.3). Clusters which do not eject all their ionising stars will not be able to form multiple co-eval populations distinctly separated by about 1 Myr.
A competition in time-scales therefore exists: On the time-scale of a few 0.1 Myr the population builds up from the inflow of molecular gas. When the massive star(s) form, the inner 0.1 pc region is ionised and the UCHII region breaks out after a time-scale of about 0.1 Myr. On the same time-scale, the massive stars eject each other from the population, as shown for such small system to be the case by direct Nbody simulations (Pflamm-Altenburg & Kroupa, 2006). The molecular inflow can resume, forming a second population, separated in time from the previous one by about 1 Myr. The separation in time is uncertain, but, given that embedded populations need a few 0.1 Myr to form, the ejections of the massive stars need 1 Myr (longer if the massive stars need to mass-segregate to the centre, Fig. 7 in Oh & Kroupa 2016), a separation by about 0.5–1 Myr appears physically plausible. Conversely, by observing the separation time scale, as is the case for the data obtained by Beccari et al. (2017), it now appears possible to map out the sequence of events that occurred in the ONC.
2.6 A possible history of mass accretion, and the IMFs
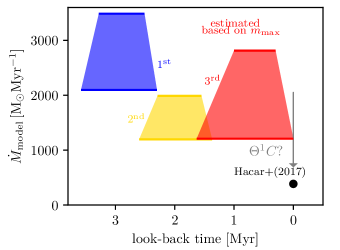
In an attempt to re-create the inflow history into the ONC, the masses of the three populations are corrected for a SFE of 33 per cent and divided by the one-sigma and 5–95 per cent age time-intervals for each of the first, second and third population (table 1 in Beccari et al. 2017). For the presently forming one it is assumed it formed over a time interval of Myr (lower limit) or 1.63 Myr (upper limit on the age from Beccari et al. 2017). The so estimated mass-inflow rates are compared to the currently observed value in Fig. 3.
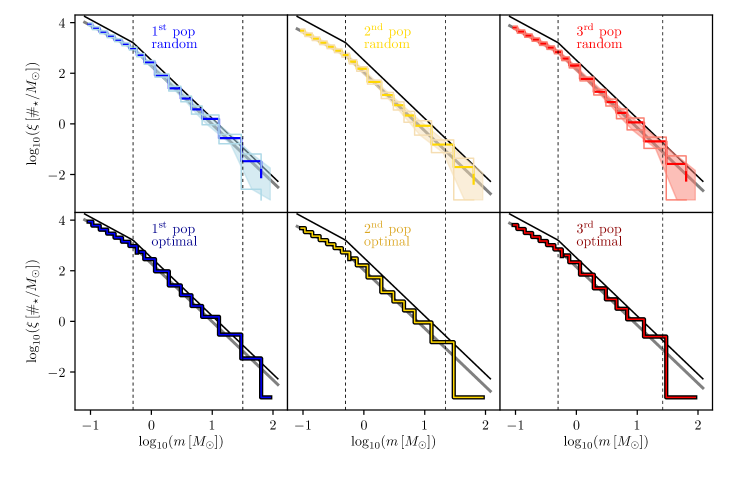
Given that Beccari et al. (2017) has now the means to separate the populations in the ONC in the colour-magnitude diagramme, it has become possible to observationally estimate their individual IMFs, by performing the complex transformation of luminosities to stellar masses for PMSs, taking into account that a large fraction of these is in unresolved multiple systems (Kroupa et al., 1991, 2013). Within the present model it is possible to calculate the model IMFs of the three populations as a prediction, as shown in Fig. 4.
3 Discussion
Proto-clusters with a molecular-gas inflow rate of over a time-scale of about Myr can form a co-eval population of stars with a mass in the range . About 40–60 per cent of these will be able to expel all their O stars within yr after the formation of the O stars (Pflamm-Altenburg & Kroupa, 2006). Since such co-eval populations have too few O stars to disperse the whole molecular cloud over scales larger than a pc, such systems are likely to be able to resume the inflow of molecular gas (Pflamm-Altenburg & Kroupa, 2009), and to form a second co-eval population with an age of about Myr older than the first, depending on how quickly the inflow resumes and begins to form a new population. In about 60 per cent of such cases the same process may repeat. The ONC, with currently three populations separated in age by about Myr, may have undergone such a history of repeated stellar-dynamical termination of feedback-halted filament-accretion. The ONC, observed at the present day, may thus be in the process of halting the formation of its third generation of stars with the Trapezium at its centre being in the process of decaying stellar-dynamically (see below).
This scenario appears to be plausible as it combines reasonably-understood physical processes which are the destructive photo-ionising effect of O stars on molecular clouds and stellar-dynamical ejections. It carries a number of predictions:
Firstly, clusters less massive than about should not show multiple populations of stars separated in age with age gaps less than a few Myr since in such clusters O stars would not form (for example there are no O stars in the whole combined population of in total a few stars formed in many small clusters in the southern part of the Orion A cloud, Hsu et al. 2012, 2013). During cluster assembly, the inflow-rate would be smaller than about Myr-1, such that an embedded cluster with a stellar mass may form within about 1 Myr. Formation ceases when the inflow decreases given a lack of gas supply, for example because the molecular cloud disperses. Magneto-hydrodynamic simulations show that about 50 per cent of the gas is ejected by the outflows alone (Machida & Matsumoto, 2012; Federrath et al., 2014; Bate et al., 2014). In combination with other feedback such as radiation feedback, the SFE may reach 33 per cent or less within the embedded-cluster volume of typically less than pc3 (Marks & Kroupa, 2012). This is indeed shown to be the case by observational constraints (André et al., 2014; Megeath et al., 2016).
Secondly, clusters which form the first co-eval population more massive than are never likely to expel all their O stars (Oh et al., 2015). The inflow of the molecular gas will be terminated and cannot resume because of the photo-destruction of the molecular cloud. For a SFE of 33 per cent and a time-scale of formation of 1 Myr, this yields a mass-inflow rate Myr-1. Such and more massive VYCs are therefore not likely to show the fine stratification of multi-age populations evident in the ONC, but such clusters may be contaminated by captured field stars (Pflamm-Altenburg & Kroupa, 2007). Also, such clusters may accrete gas from a molecular cloud once the precursor stars of core-collapse supernovae () have died, thus allowing populations of stars separated in age by a few dozens to 50 Myr (Pflamm-Altenburg & Kroupa, 2009; Bekki et al., 2017). That gas-accretion may indeed be leading to the formation of new stars in such clusters has been suggested by observation (For & Bekki, 2017).
Thirdly, it follows that if the above process is active then an embedded cluster can build-up a population of stars multiple times. For example, if three co-eval populations can form then the range of masses of the combined stellar population of the VYC can be . If the process repeats on a time-scale of a Myr for the life-time of a molecular cloud, 10 Myr, then the VYC could reach a combined stellar mass of . Therefore, VYCs with combined populations in the mass range may show a fine age stratification with populations separated by My. A rough estimate based on the available work (Pflamm-Altenburg & Kroupa, 2006; Oh et al., 2015) suggests that about 20 per cent of all such clusters ought to show three age sequences (assuming there is a chance of 60 per cent that each expels all its ionising stars within 1 Myr). To better ascertain how frequent this multi-population occurrence is, we need further numerical simulations using highly-precise and accurate Nbody integrators. It is plausible that the vast majority of embedded clusters containing two to three O star binaries will eject all O stars, in this event making this multi-age phenomenon the rule rather than the exception.
Fourthly, according to the present model the ONC should have ejected, in total, about 31 stars more massive than (Table 1), given that currently 10 are observed to still be within it (Pflamm-Altenburg & Kroupa, 2006). Since the four stars AE Aur, Col and Ori (binary, see below) have already been ejected, there should now be about 27 stars more massive than moving away from the ONC. About 44 per cent of these should have been ejected about 2.9 Myr ago, 24 per cent about 1.9 Myr ago, and 32 per cent are being ejected now (using the optimal sampling data in Tab. 1 in conjunction with the ages given in tab. 1 in Beccari et al. 2017). These should be found using Gaia astrometry mission data. It is to be cautioned though that these are rough estimates, based on the available observed population numbers by Beccari et al. (2017) and some of the stars can be very far away (250 pc for an ejection velocity of 100 km/s with ejection 2.5 Myr ago). Also, the two-step ejection process (Pflamm-Altenburg & Kroupa, 2010) implies that some of the ejected stars cannot be traced back to their birth sites. That stars are being ejected is indeed observed (Poveda et al., 2005; Chatterjee & Tan, 2012).
The scenario discussed here may help to understand a number of problems concerning the ONC:
Firstly, it has been noted that the proplyds (PMSs with their accretion cacoons) in the ONC may have short (yr) photo-evaporation time-scales posing a problem given that it has been thought that the Trapezium is much older (O’Dell, 1998). O’Dell et al. (2009) discuss this issue at length and in view of the complex gas flows within the ONC (see also Mc Leod et al. 2016), suggesting that the present configuration may be less than yr old. The present model may thus resolve this issue in that the inner ONC and the Trapezium may indeed be very young and of the order of yr old or even younger.
Secondly, it has been noted that in the inner region of the ONC the stellar velocity dispersion is too large given the observed mass. One interpretation is that the very recent expulsion of residual gas associated with the presently forming generation of stars has lead to the expansion of the population (Kroupa et al., 1999; Kroupa, 2000; Kroupa et al., 2001; Šubr et al., 2012). The Trapezium of massive stars at the core of the ONC is also observed to have a too large velocity dispersion for its mass. It may be possible that the Trapezium is at the moment undergoing stellar-dynamical decay which would be consistent with the present model. The large velocity of the main ionising star C Ori may be a result of this decay, as discussed by O’Dell et al. (2009). It has also been suggested that the Trapezium is bounded by the presence of a black hole of mass near , which may have formed from runaway merging and subsequent implosion of the merged massive star (Šubr et al., 2012)). The present scenario may relax the rational for this exotic, albeit interesting, possibility.
Thirdly, the repeated stellar-dynamical termination of feedback-halted filament-accretion model would explain why the oldest stars with an age of about Myr are most extended surrounding also the integral-shaped filament over a spatial scale of 5–10 pc (see Fig. 1). The first generation of stars most likely expanded after the expulsion of residual gas and these stars are now orbiting the general potential made by the ONC and the integral-shaped filament. An embedded cluster which undergoes realistic expulsion of residual gas expands significantly until a part of it re-virialises at a half-mass radius about 3- to 5-times larger than the half-mass radius of the pre-expulsion embedded cluster (Kroupa et al., 2001; Brinkmann et al., 2017). However, such calculations also show that the 50 per cent Lagrange radius of a cluster has expanded by a factor of about ten after about 2.5 Myr (Fig. 1 in Kroupa et al. 2001). The oldest ONC stars can thus be found at large distances around the Trapezium of up to 5 pc or more. The next generation of Myr old stars is in total a less massive population according to Beccari et al. (2017), and has therefore expanded less given the smaller velocity dispersion of the pre-gas-expulsion embedded cluster which is embedded within the expanded first population. The currently forming third population has not yet reacted significantly to the most recent and on-going gas blow-out and is therefore most-concentrated around the Trapezium. That gas is currently being expelled from the ONC is suggested from the rapid photo-erosion of the molecular material within the inner pc region centred on the ONC (O’Dell et al., 2009).
Fourthly, calculations of the trajectories of the stars AE Aur (spectral type O9.5V), Col (O9.5V) and Ori (O9III+B1III, binary) by Hoogerwerf et al. (2001); Gualandris et al. (2004) indicate that they all originated about 2.5 million years ago from a position close to the ONC, supporting the present scenario (see also the discussion in O’Dell et al. 2009). Note that, if the IMF is an optimally sampled distribution function, then this first population will have had just such stars as the most massive ones (Table 2). The evident association of these stars with the ONC posed a long-standing problem since it was thought that the ONC is younger than 2.5 Myr, while if it had formed 2.5 Myr ago, its association with a molecular cloud would appear unlikely given the destructive effect of its O stars. The present scenario may solve this problem by the ONC building up over time through a series of monolithic star bursts, the first one of which occurred about 3 Myr ago and which formed only a few massive stars which ejected each other out of the cluster. AE Aur, Col and Ori may be just these stars.
4 Conclusions
If molecular cloud cores have inflow rates of molecular gas towards a proto-cluster in the range /Myr then the proto-cluster can buildup within 1 Myr a first co-eval population of stars in the mass range . Such a population is likely to contain up to a few O stars which are likely to eject each other within 1 Myr. With the ionising sources gone, the inflow of molecular gas can again reach the potential minimum of the proto-cluster forming another similar population. Depending on how long the inflow can be sustained, the final VYC can have a stellar mass range of 1000 to for three such events for example, the three populations being separated in age by about 1 Myr. The mass range for VYCs to host multiple populations spans from (for two populations separated by one Myr) to (for ten populations, for a molecular cloud life time of 10 Myr).
The ONC discussed here lies in this mass range, and NGC 2024 may be another example at the lower end of this range (Getman et al., 2014). The physical process for creating such an age stratification is that the inflowing molecular gas builds up a first generation of stars which contain a few O stars. The O stars ionise the inflowing molecular gas therewith inhibiting star formation within the embedded cluster, although star formation may continue in the filament. These stars will orbit through the ONC and will attain a larger spatial distribution. In the majority of cases the O stars are ejected stellar-dynamically. With the ionising sources gone, the ionised gas can recombine and form molecules, and the still-inflowing gas can reach the embedded cluster volume in molecular form and form a new population of stars. This process can continue until the inflow tapers out, or becomes so massive that too many massive stars form for all to be ejected. Fig. 1 shows a cartoon of this process. The gas chemistry, which depends on the recombination and molecule formation rates, may be an interesting problem to consider under these conditions.
The model is here used to estimate the history of filamentary infall of molecular gas into the ONC. The three O stars AE Aur, Col and Ori may be the stars ejected when the first ONC population formed. The wider spatial dispersion of the older populations can be understood as a result of the expulsion of residual gas due to the feedback from the O stars, causing expansion of the respective population, and as a result of the wider orbits of the stars formed in the filament. When the O stars are ejected and star-formation within the inner ONC resumes, the whole population will contract somewhat due to the deepened potential. The whole cycle would need to be simulated self-consistently to gain more knowledge on the detailed dynamical and star-formation history of each component.
The here proposed repeated stellar-dynamical termination of feedback-halted filament-accretion model needs to be studied in much more detail, for example by performing gas-dynamical simulations with star formation and radiative and mechanical feedback including the self-consistent computation of high-precision and accurate stellar-dynamical processes including chain-regularisation procedures (Aarseth, 2003), to ascertain if the broad scenario outlined here is indeed viable. The AMUSE software framework (Portegies Zwart et al., 2009) may be interesting in this context. At the same time, the accumulation of data on the motions of individual stars in the various age groups, for example with the GAIA mission, should lead to a better understanding of the origin of the populations (for example as suggested in the present model as being expanding post-gas-expulsion populations), or if a very different model may be applicable. A different model based on an oscillating filament which launches proto-stars has been suggested by Stutz & Gould (2016); Boekholt et al. (2017) and may be relevant for understanding the observed structure and motions within and around the ONC.
Acknowledgements.
We thank Monika Petr-Gotzens for useful comments. PK thanks the ESO office in Garching for supporting his stay there as a scientific visitor. TJ was supported by Charles University in Prague through grant SVV-260441 and through a stipend from the SPODYR group at the University of Bonn. FD acknowledges the support from the DFG Priority Program 1573 “The physics of the interstellar medium”. This project was initiated in September in Prag at the conference Modelling and Observing Dense Stellar Systems 2017 (MODEST17). We thank, amongst the other organisers, Ladislav Subr and Jaroslav Haas for their organisational work.References
- Aarseth (2003) Aarseth, S. J. 2003, Gravitational N-Body Simulations
- Adams & Fatuzzo (1996) Adams, F. C. & Fatuzzo, M. 1996, ApJ, 464, 256
- André et al. (2014) André, P., Di Francesco, J., Ward-Thompson, D., et al. 2014, Protostars and Planets VI, 27
- Banerjee & Kroupa (2013) Banerjee, S. & Kroupa, P. 2013, ApJ, 764, 29
- Banerjee & Kroupa (2014) Banerjee, S. & Kroupa, P. 2014, ApJ, 787, 158
- Banerjee & Kroupa (2015) Banerjee, S. & Kroupa, P. 2015, MNRAS, 447, 728
- Banerjee & Kroupa (2017) Banerjee, S. & Kroupa, P. 2017, A&A, 597, A28
- Banerjee & Kroupa (2018) Banerjee, S. & Kroupa, P. 2018, in Astrophysics and Space Science Library, Vol. 424, The Birth of Star Clusters, ed. S. Stahler, 143
- Banerjee et al. (2012) Banerjee, S., Kroupa, P., & Oh, S. 2012, MNRAS, 426, 1416
- Bastian et al. (2010) Bastian, N., Covey, K. R., & Meyer, M. R. 2010, ARA&A, 48, 339
- Bate (2014) Bate, M. R. 2014, MNRAS, 442, 285
- Bate et al. (2014) Bate, M. R., Tricco, T. S., & Price, D. J. 2014, MNRAS, 437, 77
- Beccari et al. (2017) Beccari, G., Petr-Gotzens, M. G., Boffin, H. M. J., et al. 2017, A&A, 604, A22
- Bekki et al. (2017) Bekki, K., Jeřábková, T., & Kroupa, P. 2017, MNRAS, 471, 2242
- Belloni et al. (2017) Belloni, D., Askar, A., Giersz, M., Kroupa, P., & Rocha-Pinto, H. J. 2017, MNRAS, 471, 2812
- Boekholt et al. (2017) Boekholt, T. C. N., Stutz, A. M., Fellhauer, M., Schleicher, D. R. G., & Matus Carrillo, D. R. 2017, MNRAS, 471, 3590
- Bonnell & Smith (2011) Bonnell, I. A. & Smith, R. J. 2011, in IAU Symposium, Vol. 270, Computational Star Formation, ed. J. Alves, B. G. Elmegreen, J. M. Girart, & V. Trimble, 57–64
- Bontemps et al. (2010) Bontemps, S., Motte, F., Csengeri, T., & Schneider, N. 2010, A&A, 524, A18
- Bressan et al. (2012) Bressan, A., Marigo, P., Girardi, L., et al. 2012, MNRAS, 427, 127
- Brinkmann et al. (2017) Brinkmann, N., Banerjee, S., Motwani, B., & Kroupa, P. 2017, A&A, 600, A49
- Burkert (2017) Burkert, A. 2017, ArXiv e-prints
- Chatterjee & Tan (2012) Chatterjee, S. & Tan, J. C. 2012, ApJ, 754, 152
- Chini et al. (2004) Chini, R., Hoffmeister, V., Kimeswenger, S., et al. 2004, Nature, 429, 155
- Chini et al. (2006) Chini, R., Hoffmeister, V. H., Nielbock, M., et al. 2006, ApJ, 645, L61
- Da Rio et al. (2009) Da Rio, N., Robberto, M., Soderblom, D. R., et al. 2009, ApJS, 183, 261
- Da Rio et al. (2017) Da Rio, N., Tan, J. C., Covey, K. R., et al. 2017, ApJ, 845, 105
- Da Rio et al. (2016) Da Rio, N., Tan, J. C., Covey, K. R., et al. 2016, ApJ, 818, 59
- De Pree et al. (2014) De Pree, C. G., Peters, T., Mac Low, M.-M., et al. 2014, ApJ, 781, L36
- Draine (2011) Draine, B. T. 2011, Physics of the Interstellar and Intergalactic Medium
- Duarte-Cabral et al. (2013) Duarte-Cabral, A., Bontemps, S., Motte, F., et al. 2013, A&A, 558, A125
- Farias & Tan (2017) Farias, J. P. & Tan, J. C. 2017, ArXiv e-prints
- Federrath (2015) Federrath, C. 2015, MNRAS, 450, 4035
- Federrath (2016) Federrath, C. 2016, MNRAS, 457, 375
- Federrath et al. (2014) Federrath, C., Schrön, M., Banerjee, R., & Klessen, R. S. 2014, ApJ, 790, 128
- Felli et al. (1993) Felli, M., Churchwell, E., Wilson, T. L., & Taylor, G. B. 1993, A&AS, 98, 137
- Figer (2005) Figer, D. F. 2005, Nature, 434, 192
- For & Bekki (2017) For, B.-Q. & Bekki, K. 2017, MNRAS, 468, L11
- Getman et al. (2014) Getman, K. V., Feigelson, E. D., & Kuhn, M. A. 2014, ApJ, 787, 109
- Gualandris et al. (2004) Gualandris, A., Portegies Zwart, S., & Eggleton, P. P. 2004, MNRAS, 350, 615
- Hacar et al. (2017a) Hacar, A., Alves, J., Tafalla, M., & Goicoechea, J. R. 2017a, A&A, 602, L2
- Hacar et al. (2017b) Hacar, A., Tafalla, M., & Alves, J. 2017b, A&A, 606, A123
- Hacar et al. (2013) Hacar, A., Tafalla, M., Kauffmann, J., & Kovács, A. 2013, A&A, 554, A55
- Hillenbrand & Hartmann (1998) Hillenbrand, L. A. & Hartmann, L. W. 1998, ApJ, 492, 540
- Hoogerwerf et al. (2001) Hoogerwerf, R., de Bruijne, J. H. J., & de Zeeuw, P. T. 2001, A&A, 365, 49
- Hosokawa & Inutsuka (2006) Hosokawa, T. & Inutsuka, S.-i. 2006, ApJ, 646, 240
- Hsu et al. (2012) Hsu, W.-H., Hartmann, L., Allen, L., et al. 2012, ApJ, 752, 59
- Hsu et al. (2013) Hsu, W.-H., Hartmann, L., Allen, L., et al. 2013, ApJ, 764, 114
- Keto & Wood (2006) Keto, E. & Wood, K. 2006, ApJ, 637, 850
- Kirk et al. (2016) Kirk, H., Johnstone, D., Di Francesco, J., et al. 2016, ApJ, 821, 98
- Kirk & Myers (2011) Kirk, H. & Myers, P. C. 2011, ApJ, 727, 64
- Kirk & Myers (2012) Kirk, H. & Myers, P. C. 2012, ApJ, 745, 131
- Klaassen & Wilson (2007) Klaassen, P. D. & Wilson, C. D. 2007, ApJ, 663, 1092
- Koen (2006) Koen, C. 2006, MNRAS, 365, 590
- Kounkel et al. (2017) Kounkel, M., Hartmann, L., Loinard, L., et al. 2017, ApJ, 834, 142
- Kraus et al. (2009) Kraus, S., Weigelt, G., Balega, Y. Y., et al. 2009, A&A, 497, 195
- Kroupa (2000) Kroupa, P. 2000, New A, 4, 615
- Kroupa (2001) Kroupa, P. 2001, MNRAS, 322, 231
- Kroupa (2002) Kroupa, P. 2002, Science, 295, 82
- Kroupa (2008) Kroupa, P. 2008, in Lecture Notes in Physics, Berlin Springer Verlag, Vol. 760, The Cambridge N-Body Lectures, ed. S. J. Aarseth, C. A. Tout, & R. A. Mardling, 181
- Kroupa et al. (2001) Kroupa, P., Aarseth, S., & Hurley, J. 2001, MNRAS, 321, 699
- Kroupa et al. (1991) Kroupa, P., Gilmore, G., & Tout, C. A. 1991, MNRAS, 251, 293
- Kroupa et al. (1999) Kroupa, P., Petr, M. G., & McCaughrean, M. J. 1999, New A, 4, 495
- Kroupa et al. (2013) Kroupa, P., Weidner, C., Pflamm-Altenburg, J., et al. 2013, The stellar and sub-stellar initial mass function of simple and composite populations, ed. T. D. Oswalt & G. Gilmore, 115
- Kuruwita et al. (2017) Kuruwita, R. L., Federrath, C., & Ireland, M. 2017, MNRAS, 470, 1626
- Lada (2010) Lada, C. J. 2010, Philosophical Transactions of the Royal Society of London Series A, 368, 713
- Lada & Lada (2003) Lada, C. J. & Lada, E. A. 2003, ARA&A, 41, 57
- Lane et al. (2016) Lane, J., Kirk, H., Johnstone, D., et al. 2016, ApJ, 833, 44
- Luhman et al. (2017) Luhman, K. L., Robberto, M., Tan, J. C., et al. 2017, ApJ, 838, L3
- Machida & Matsumoto (2012) Machida, M. N. & Matsumoto, T. 2012, MNRAS, 421, 588
- Marks & Kroupa (2012) Marks, M. & Kroupa, P. 2012, A&A, 543, A8
- Maschberger & Clarke (2011) Maschberger, T. & Clarke, C. J. 2011, MNRAS, 416, 541
- Mc Leod et al. (2016) Mc Leod, A. F., Weilbacher, P. M., Ginsburg, A., et al. 2016, MNRAS, 455, 4057
- Megeath et al. (2016) Megeath, S. T., Gutermuth, R., Muzerolle, J., et al. 2016, AJ, 151, 5
- Menten et al. (2007) Menten, K. M., Reid, M. J., Forbrich, J., & Brunthaler, A. 2007, A&A, 474, 515
- Moe & Di Stefano (2017) Moe, M. & Di Stefano, R. 2017, ApJS, 230, 15
- Nielbock et al. (2007) Nielbock, M., Chini, R., Hoffmeister, V. H., et al. 2007, ApJ, 656, L81
- Nürnberger et al. (2007) Nürnberger, D. E. A., Chini, R., Eisenhauer, F., et al. 2007, A&A, 465, 931
- O’Dell (1998) O’Dell, C. R. 1998, AJ, 115, 263
- O’dell (2001) O’dell, C. R. 2001, ARA&A, 39, 99
- O’Dell et al. (2009) O’Dell, C. R., Henney, W. J., Abel, N. P., Ferland, G. J., & Arthur, S. J. 2009, AJ, 137, 367
- Oey & Clarke (2005) Oey, M. S. & Clarke, C. J. 2005, ApJ, 620, L43
- Oh & Kroupa (2016) Oh, S. & Kroupa, P. 2016, A&A, 590, A107
- Oh et al. (2015) Oh, S., Kroupa, P., & Pflamm-Altenburg, J. 2015, ApJ, 805, 92
- Peters et al. (2010a) Peters, T., Banerjee, R., Klessen, R. S., et al. 2010a, ApJ, 711, 1017
- Peters et al. (2010b) Peters, T., Mac Low, M.-M., Banerjee, R., Klessen, R. S., & Dullemond, C. P. 2010b, ApJ, 719, 831
- Pflamm-Altenburg & Kroupa (2006) Pflamm-Altenburg, J. & Kroupa, P. 2006, MNRAS, 373, 295
- Pflamm-Altenburg & Kroupa (2007) Pflamm-Altenburg, J. & Kroupa, P. 2007, MNRAS, 375, 855
- Pflamm-Altenburg & Kroupa (2009) Pflamm-Altenburg, J. & Kroupa, P. 2009, MNRAS, 397, 488
- Pflamm-Altenburg & Kroupa (2010) Pflamm-Altenburg, J. & Kroupa, P. 2010, MNRAS, 404, 1564
- Portegies Zwart et al. (2009) Portegies Zwart, S., McMillan, S., Harfst, S., et al. 2009, New A, 14, 369
- Poveda et al. (2005) Poveda, A., Allen, C., & Hernández-Alcántara, A. 2005, ApJ, 627, L61
- Prosser et al. (1994) Prosser, C. F., Stauffer, J. R., Hartmann, L., et al. 1994, ApJ, 421, 517
- Ramírez Alegría et al. (2016) Ramírez Alegría, S., Borissova, J., Chené, A.-N., et al. 2016, A&A, 588, A40
- Sana et al. (2012) Sana, H., de Mink, S. E., de Koter, A., et al. 2012, Science, 337, 444
- Scally & Clarke (2002) Scally, A. & Clarke, C. 2002, MNRAS, 334, 156
- Scally et al. (2005) Scally, A., Clarke, C., & McCaughrean, M. J. 2005, MNRAS, 358, 742
- Schneider et al. (2012) Schneider, N., Csengeri, T., Hennemann, M., et al. 2012, A&A, 540, L11
- Smith et al. (2016) Smith, R. J., Glover, S. C. O., Klessen, R. S., & Fuller, G. A. 2016, MNRAS, 455, 3640
- Spitzer (1978) Spitzer, L. 1978, Physical processes in the interstellar medium
- Stephens et al. (2017) Stephens, I. W., Gouliermis, D., Looney, L. W., et al. 2017, ApJ, 834, 94
- Sternberg et al. (2003) Sternberg, A., Hoffmann, T. L., & Pauldrach, A. W. A. 2003, The Astrophysical Journal, 599, 1333
- Stutz & Gould (2016) Stutz, A. M. & Gould, A. 2016, A&A, 590, A2
- Tan (2004) Tan, J. C. 2004, ApJ, 607, L47
- Tenorio-Tagle (1979) Tenorio-Tagle, G. 1979, A&A, 71, 59
- Šubr et al. (2012) Šubr, L., Kroupa, P., & Baumgardt, H. 2012, ApJ, 757, 37
- Weidner & Kroupa (2004) Weidner, C. & Kroupa, P. 2004, MNRAS, 348, 187
- Weidner & Kroupa (2006) Weidner, C. & Kroupa, P. 2006, MNRAS, 365, 1333
- Weidner et al. (2013) Weidner, C., Kroupa, P., & Pflamm-Altenburg, J. 2013, MNRAS, 434, 84
- Wen & O’dell (1995) Wen, Z. & O’dell, C. R. 1995, ApJ, 438, 784
- Whitworth (1979) Whitworth, A. 1979, MNRAS, 186, 59
- Wood & Churchwell (1989) Wood, D. O. S. & Churchwell, E. 1989, ApJS, 69, 831
- Wuchterl & Tscharnuter (2003) Wuchterl, G. & Tscharnuter, W. M. 2003, A&A, 398, 1081
- Yan et al. (2017) Yan, Z., Jerabkova, T., & Kroupa, P. 2017, A&A, 607, A126