Verticalization of bacterial biofilms
Abstract
Biofilms are communities of bacteria adhered to surfaces. Recently, biofilms of rod-shaped bacteria were observed at single-cell resolution and shown to develop from a disordered, two-dimensional layer of founder cells into a three-dimensional structure with a vertically-aligned core. Here, we elucidate the physical mechanism underpinning this transition using a combination of agent-based and continuum modeling. We find that verticalization proceeds through a series of localized mechanical instabilities on the cellular scale. For short cells, these instabilities are primarily triggered by cell division, whereas long cells are more likely to be peeled off the surface by nearby vertical cells, creating an “inverse domino effect”. The interplay between cell growth and cell verticalization gives rise to an exotic mechanical state in which the effective surface pressure becomes constant throughout the growing core of the biofilm surface layer. This dynamical isobaricity determines the expansion speed of a biofilm cluster and thereby governs how cells access the third dimension. In particular, theory predicts that a longer average cell length yields more rapidly expanding, flatter biofilms. We experimentally show that such changes in biofilm development occur by exploiting chemicals that modulate cell length.
Biofilms are groups of bacteria adhered to surfaces 1; 2; 3. These bacterial communities are common in nature, and foster the survival and growth of their constituent cells. A deep understanding of biofilm structure and development promises important health and industrial applications 4; 5. Unfortunately, little is known about the microstructural features of biofilms due to difficulties encountered in imaging individual cells inside large assemblies of densely-packed cells. Recently, however, advances in imaging technology have made it possible to observe growing, three-dimensional biofilms at single-cell resolution6; 7; 8.
In the case of Vibrio cholerae, the rod-shaped bacterium responsible for the pandemic disease cholera9; 10, high-resolution imaging revealed a surprisingly complex biofilm developmental program7; 8. Over the course of 12-24 hours of growth, an individual founder cell gives rise to a dome-shaped biofilm cluster, containing thousands of cells that are strongly vertically ordered, especially at the cluster core. Notably, this ordering is an intrinsically non-equilibrium phenomenon, as it is driven by growth, not by thermal fluctuations. Indeed, the striking extent of ordering cannot be explained by Onsager’s theory for the equilibrium ordering of rod-shaped objects7; 11.
An important clue to understanding the emergence of vertical order in V. cholerae biofilms comes from genetic analyses that established the biological components relevant for biofilm development12; 7; 8. To facilitate their growth as biofilms, V. cholerae cells secrete adhesive matrix components: Vibrio polysaccharide (VPS), a polymer that expands to fill gaps between cells, and cell-to-cell and cell-to-surface adhesion proteins. Cell-to-surface interactions enable vertical ordering by breaking overall rotational symmetry. However, despite previous work on the orientational dynamics of bacterial cells13; 14; 15; 16; 17; 18; 19; 20; 21; 22, the nature of this physical process remains unclear.
In this work, we establish the biophysical mechanisms controlling V. cholerae biofilm development. We show that the observed structural and dynamical features of growing biofilms can be reproduced by a simple, agent-based model. Our model treats individual cells as growing and dividing rods with cell-to-cell and cell-to-surface interactions, and thus serves as a minimal model for a wide range of biofilm-forming bacterial species. By examining individual cell verticalization events, we show that reorientation is driven by localized mechanical instabilities occurring in regions of surface cells subject to high in-plane compression. These threshold instabilities explain the tendency of surface-adhered cells to reorient rapidly following cell division. We incorporate these verticalization instabilities into a continuum theory, which allows us to predict the expansion speed of biofilms as well as overall biofilm morphology as a function of cell-scale properties. We verify these predictions in experiments in which we use chemicals that alter cell length. Our model thus elucidates how the mechanical and geometrical features of individual cells control the emergent features of the biofilm, which are relevant to the survival of the collective.
Biofilm radius and vertical ordering spread linearly over time
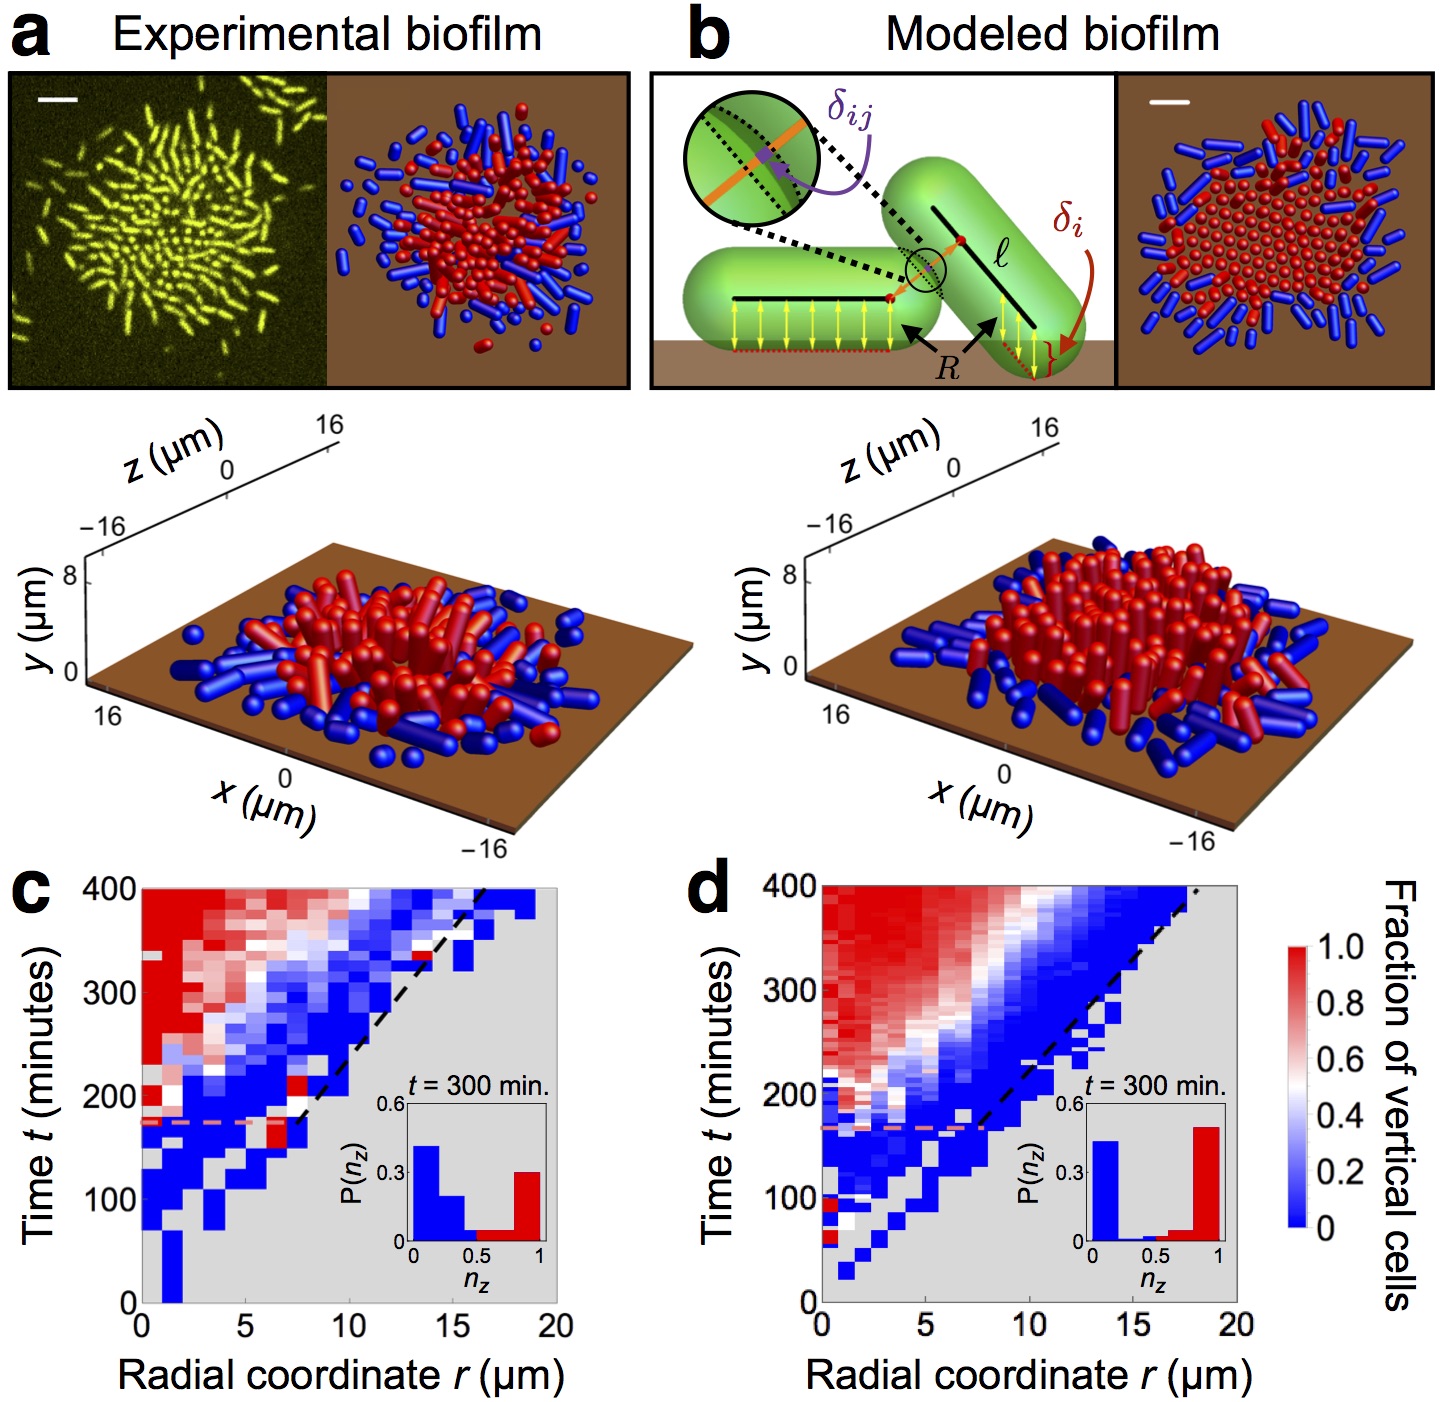
How do cells in V. cholerae biofilms become vertical? Biofilms grown from a single, surface-adhered founder cell initially expand along the surface (Fig. 1a, Supplementary Video 1). This horizontal expansion occurs because cells grow and divide along their long axes, which remain parallel to the surface due to cell-to-surface adhesion7. After about three hours, progeny near the biofilm center begin to reorient away from the surface (Fig. 1c). Reorientation events typically involve a sharp change in a cell’s verticality , defined as the component of the cell-orientation vector normal to the surface (inset Fig. 1c). At later times, the locations of the reorientation events spread outward, and eventually the biofilm develops a roughly circular region of vertical cells surrounded by an annular region of horizontal cells. Both of these regions subsequently expand outward with approximately equal, fixed velocities. The radial profile of verticality versus time shows that the local transition of cells from horizontal to vertical occurs rapidly, taking - minutes for cell-sized regions to develop a vertical majority.
Agent-based model captures spreading of biofilm and vertical ordering
To understand how the behavior of living biofilms arises from local interactions, we developed an agent-based model for biofilm growth (left inset Fig. 1b, Methods, Supplementary Fig. 1). The model extends existing agent-based models23; 24; 18 by incorporating the viscoelastic cell-to-surface adhesion25; 26 that is crucial for V. cholerae biofilm formation9; 12. Specifically, we treat the cells as soft spherocylinders that grow, divide, and adhere to the surface. We simulated biofilms by numerically integrating the equations of motion starting from a single, surface-adhered founder cell (Supplementary Video 2, Methods). To make the computations more tractable for systematic studies, we simulated only the surface layer of cells by removing from the simulation cells that become detached from the surface. This quasi-3D model is a reasonable approximation of the full 3D model at early times (Supplementary Fig. 2), and closely matches the dynamics and orientational order observed over the full duration of the experiment, including an inner region of vertical cells surrounded by an annular periphery of horizontal cells, both of which expand outward at a fixed rate (Fig. 1b,d). As in the experimental biofilm, the horizontal and vertical orientations of the modeled cells are sharply distinct (inset Fig. 1d), and the conversion from horizontal to vertical occurs rapidly (Fig. 1d). The emergence of this distinctive orientational-temporal pattern demonstrates that our simple agent-based model is sufficient to capture the physical interactions that underpin the observed “verticalization” transition of experimental biofilms.
Mechanical instabilities cause cell verticalization
Why do the experimental and modeled cells segregate into horizontal and vertical orientations, with transitions from horizontal to vertical proceeding rapidly? To investigate the local mechanics that drive verticalization, we considered the dynamics of a single model cell of cylinder length adhered to the surface. The surface provides a combination of attractive and repulsive forces that, in the absence of external forces, maintain the cell at a stable fixed point with elevation angle (i.e. horizontal) and penetration into the surface . However, when additional forces are applied to the cell, the cell may become unstable to vertical reorientation.
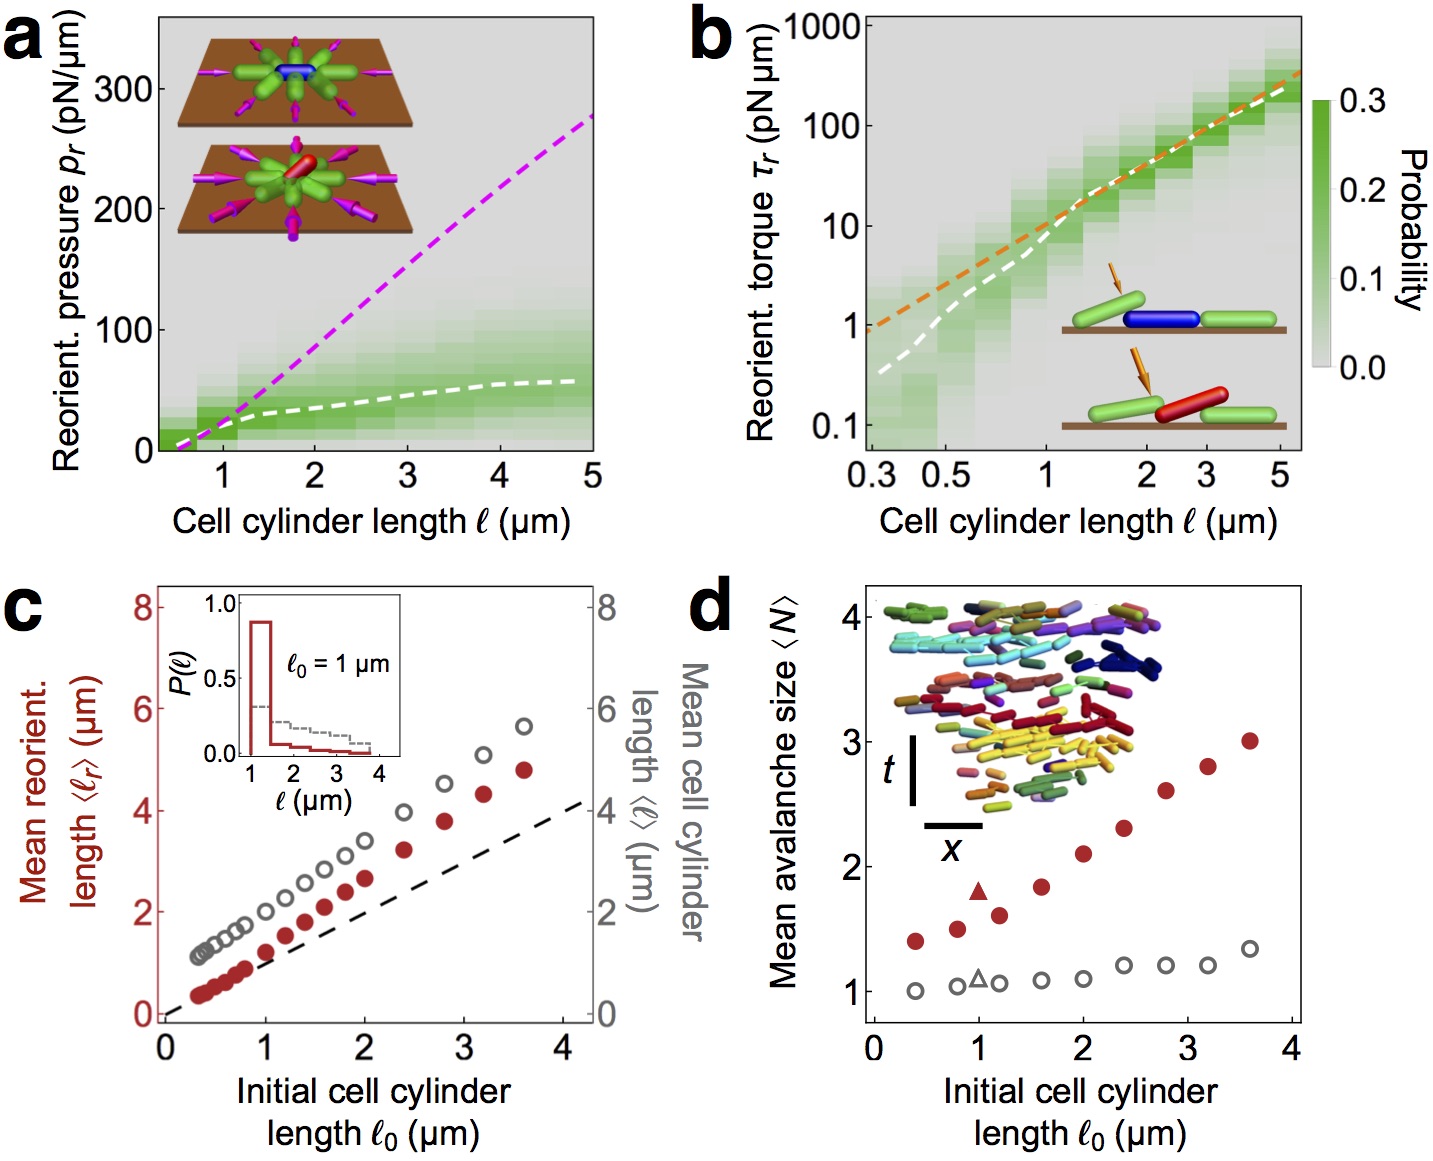
We determined the onset of this instability by performing a linear stability analysis for a cell under constant external forces (inset Fig. 2a). For simplicity, we took the external forces to be applied by a continuum of rigid, spherical pistons that are distributed uniformly around the cell perimeter. The pistons compress the cell in the plane with an applied surface pressure . For values of larger than a threshold surface pressure , the cell becomes linearly unstable to spontaneous reorientation (Supplementary Figs. 3-4). Our model yields a value of that increases with . In particular, over a broad range of , we find a simple linear increase of with (Fig. 2a). Intuitively, this increase occurs because the surface adhesion of the model cell scales with its contact area, creating an energy barrier to reorientation that increases with cell length.
To determine whether this simple model can predict verticalization events in the biofilm surface-layer simulations, we examined the forces acting on individual modeled cells throughout the development of a biofilm. Specifically, we computed the reorientation “surface pressure” , defined as the sum of the magnitudes of the in-plane cell-cell contact forces on a cell, normalized by the perimeter of its footprint, at the instant it begins to reorient. We determined the instant of reorientation as the time of the peak of the total in-plane force on a cell immediately prior to it becoming vertical (Supplementary Fig. 5). We found that the average reorientation surface pressure increases with , as expected from the compressive instability model (Fig. 2a). Furthermore, the predicted value is in good agreement with the observed for short cells. However, for long cells, saturates more rapidly than .
The dominant mechanism of verticalization depends on cell length
How can longer cells become vertical at surface pressures much lower than the threshold values predicted by the compressive instability model? The large extent of the discrepancy suggests that for long cells, the in-plane forces alone are insufficient to cause the instabilities. Indeed, incorporating the numerically-observed distribution of in-plane forces acting on cells into the compressive instability model does not significantly improve the prediction for (Supplementary Fig. 6). Thus, we hypothesized that in the case of long cells, forces acting in the direction might play an important role in triggering verticalization.
To explore this idea, we returned to the single-cell model and considered the effect of forces in the direction (inset Fig. 2b). Applying small forces in the direction to a cell with fixed center-of-mass height shifts the equilibrium elevation angle of the cell to a small finite value of , proportional to the net torque. Under large enough torque, a single end of the cell becomes free of the surface, at which point the cell becomes unstable to further rotation and effectively “peels” off the surface. This nonlinearity, inherent in the geometry of contact, competes with the compressive instability, and under specific conditions can initiate reorientation at much smaller values of surface pressure. Specifically, for a fixed center-of-mass penetration depth , the threshold torque for peeling a cell off the surface due to forces in the direction scales as (Supplementary Fig. 4). For the whole-biofilm surface-layer simulation, the average reorientation torque, defined as the total torque due to forces in the direction at the instant of reorientation, closely obeys the predicted scaling for long cells (Fig. 2b). Taken together, our predictions from the compressive and peeling instabilities explain the verticalization of cells over the entire range of cell lengths studied.
Cell division can trigger verticalization
For both compressive and peeling instabilities, the presence of an energy barrier to reorientation explains the sharp distinction we observed between horizontal and vertical cell orientations. Furthermore, both mechanisms predict larger reorientation thresholds for longer cell lengths. Hence, the model suggests that shorter cells should reorient more readily. To confirm this effect in our simulated biofilms, we compared the distribution of reorientation lengths , defined as the cell cylinder length at the instant of reorientation, to the full distribution of horizontal cell lengths for a series of simulations with different values of the initial cell cylinder length (Fig. 2c). For all values of , we found that the mean reorientation cell length is substantially smaller than the mean horizontal cell length. In addition, for simulations with average cell lengths comparable to those in our experiments, most reorientation events occur immediately after cell division. The limited time resolution of the experiments precludes a quantitative analysis of division-induced verticalization; nevertheless, the propensity for cell division to trigger reorientation is clearly observed in the experimental biofilm (Supplementary Video 1, Supplementary Fig. 7).
Verticalization is localized
We next investigated how the surface compression and peeling instabilities influence the propagation of reorientation through a biofilm. First, we generalized our model for the surface compression instability to the multi-cell level. A linear stability analysis of the model suggests that reorientation events should be independent and spatially localized for short cell lengths (Supplementary Fig. 3). By contrast, for long cell lengths, the tendency of neighboring vertical cells to trigger reorientation suggests an (inverse) domino-like effect in which one cell standing up can induce its neighbors to stand up.
To quantify the extent of cooperative verticalization, we computed the size of reorientation “avalanches”, defined as groups of verticalization events that are proximal in space and time27 (inset Fig. 2d, Supplementary Fig. 8). We found that the mean avalanche size increases with cell length, consistent with the prediction of the inverse domino effect for long cells (Fig. 2d). Interestingly, however, the distribution of avalanche sizes decays roughly exponentially for all values of cell length we studied (Supplementary Fig. 9), with only a modest number of cells () involved in typical avalanches (Fig. 2d). Our results indicate that the sizes of reorientation avalanches are limited by an emergent spatiotemporal scale governed by cell geometrical and mechanical properties, rather than by the growing total supply of horizontal cells.
A natural explanation for the small mean avalanche size comes from the reduction in cell footprint that occurs upon reorientation, which rapidly alleviates the local surface pressure responsible for verticalization (Supplementary Fig. 5). This effect combines with the disorder of the contact geometries and forces throughout the biofilm, which separates horizontal cells near the verticalization threshold into disconnected groups (Supplementary Video 3, Supplementary Fig. 10). Thus, although the inverse domino effect transiently increases verticalization cooperativity, avalanches quickly exhaust the supply of nearby horizontal cells that are susceptible to becoming vertical. Consequently, verticalization occurs throughout the biofilm in scattered, localized regions.
Two-fluid model describes propagation of verticalization
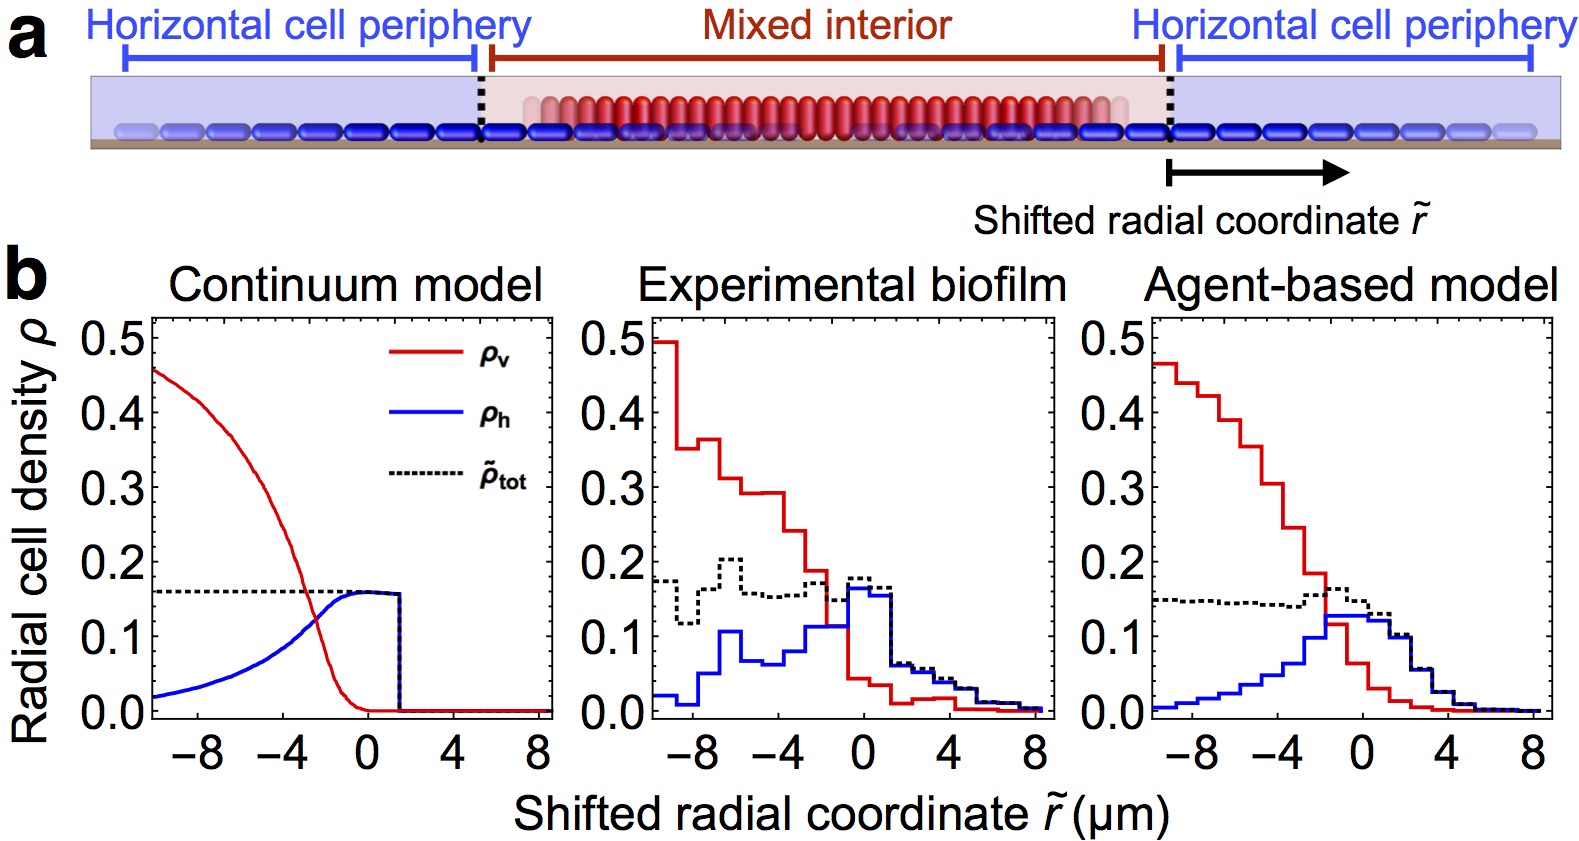
To understand how localized cell verticalization gives rise to the global patterning dynamics of the biofilm, we developed a two-dimensional continuum model that treats horizontal and vertical cell densities as two coupled fluids (Fig. 3a, Methods). The local horizontal cell density grows in the plane at a rate and converts to vertical cell density in regions of high surface pressure or, equivalently in our model, high total 2D cell density , where is the ratio of vertical to horizontal cell footprints. These interactions yield the following equation for the change in in regions of nonzero surface pressure:
| (1) |
where is the ratio of the Young’s modulus of the biofilm to the surface drag coefficient, is the Heaviside step function, and is the threshold surface density for verticalization. We simulated this continuum model, and found that for , the biofilm generically develops into a circular region containing both horizontal and vertical cells (“Mixed interior”) surrounded by an annular region containing horizontal cells (“Horizontal cell periphery”), closely matching both the experimental biofilm and the agent-based model biofilms (Fig. 3b, Supplementary Video 4, Supplementary Note). In this regime, the biofilm front spreads linearly in time at a fixed expansion speed . Furthermore, the total cell density and the surface pressure are constant in the mixed interior. This constancy is stabilized by the competing effects of cell growth and cell verticalization, and occurs provided that (Supplementary Fig. 11). When this condition is satisfied, verticalization can reduce cell density faster than cell density can be replenished by cell growth and cell transport due to gradients in surface pressure. Physically, this results in the cell density rapidly fluctuating around the verticalization threshold. This rapid alternation effectively tunes the verticalization rate down to , and thereby ensures a constant total cell density and surface pressure in the mixed interior. The resulting “dynamical isobaricity” (constancy of pressure) provides the boundary condition for the horizontal cell periphery that determines the horizontal expansion speed , independent of and . In the limit of slow expansion , is given by:
| (2) |
where and is the close-packed, but uncompressed, cell density. Thus, we find that increases with until it saturates to a maximum speed for . Intuitively, higher values of the verticalization threshold density sustain a wider periphery of horizontal cells, which results in a higher rate of increase in the total number of surface cells. Thus, our continuum model reveals how the geometrical and mechanical properties of individual cells influence the global morphology of the growing biofilm.
Increasing cell length yields more rapidly expanding, flatter biofilms
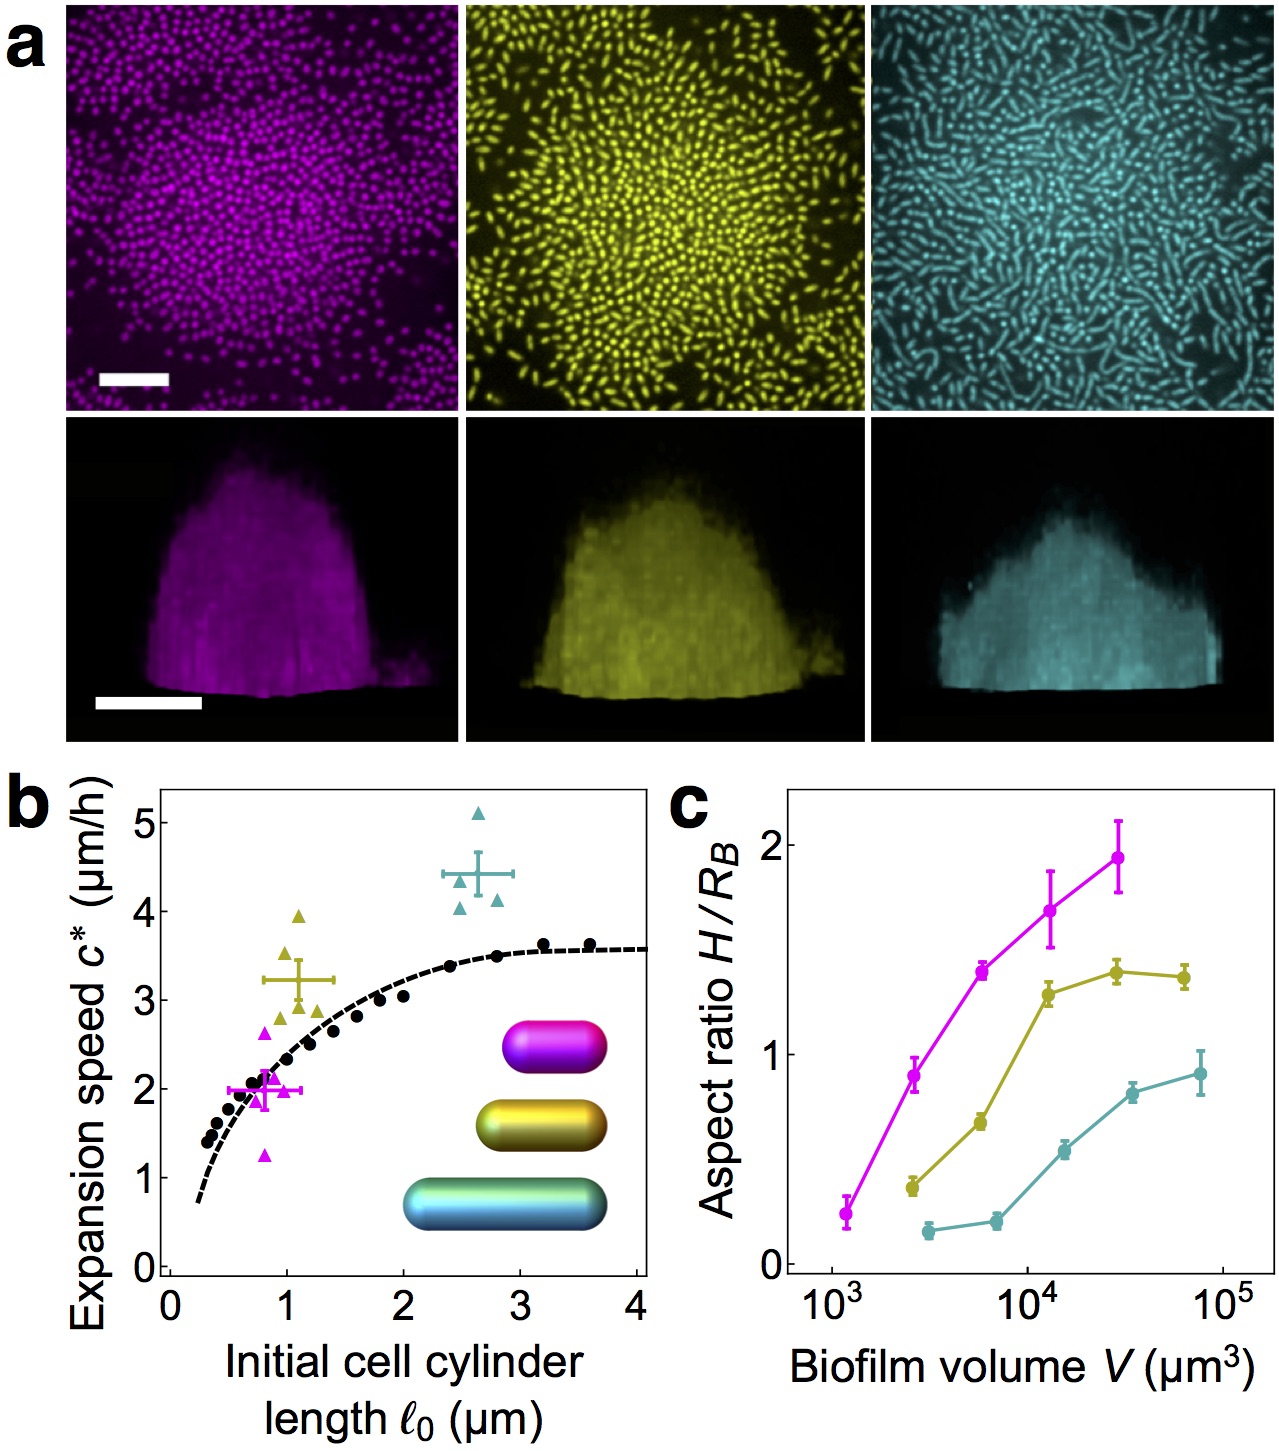
Because the threshold surface density for verticalization increases with cell length, we expect biofilms composed of longer cells to maintain a wider periphery of horizontal cells and to thereby expand faster along the surface than biofilms composed of shorter cells. To test this notion in our agent-based model, we computed the expansion speed of the modeled biofilms for a range of initial cell cylinder lengths (Fig. 4b). Upon fitting the continuum model parameters to those of the agent-based model (Supplementary Figs. 12-13), we found that the expansion velocities of the two models were equal to within a few percent. In living, experimental biofilms, we can increase or decrease the average cell length using chemical treatments10; 28 (Fig. 4a, top row). Similar to the agent-based model biofilms, in experimental biofilms, the surface expansion speed increases with increasing cell length (Fig. 4b, Supplementary Video 5). The experimentally observed speed appears to saturate as cell length is increased, as occurs in the modeled biofilms. Furthermore, when the model biofilm parameters are fitted to experiment (Supplementary Fig. 1), the experimental and model biofilm speeds agree to within twenty percent or better. Taken together, these observations support the conclusion that self-organized dynamical isobaricity governs the observed expansion of V. cholerae biofilms.
How do different surface expansion speeds influence the ensuing biofilm development into the direction? After a few hours, living biofilms grow into roughly semi-ellipsoidal shapes with volume , where is the basal radius and is the height. For equal rates of total volume growth, we expect a biofilm that expands more rapidly along the surface to develop a lower aspect ratio than a biofilm that expands less rapidly along the surface. We verified that this trend holds for the experimental biofilms (Fig. 4a, bottom row). In particular, the measured aspect ratio increases with cell length over a wide range of volumes (Fig. 4c). Thus, our results show how the elongated geometries of individual cells govern the global morphology of the collective.
Discussion
Bacterial biofilms are pervasive lifeforms that significantly influence health and industry1; 2; 4; 5; 29; 30. An important step towards control over biofilms was achieved when the molecular building blocks of V. cholerae biofilms were identified12. In particular, cell-to-surface adhesion factors were found to be necessary to generate vertically-ordered biofilm clusters8. Despite this progress, the dynamical process by which cells in biofilms become vertical has remained mysterious. Here, we showed that cell verticalization begins to occur when the local effective surface pressures that arise from cell growth become large enough to overcome the cell-to-surface adhesion that otherwise favors a horizontal orientation. Subsequently, the reduction in cell footprint that occurs upon cell verticalization, which acts to reduce the effective surface pressure, provides a mechanical feedback that controls the rate of biofilm expansion. Our continuum and agent-based models quantitatively capture the rate of horizontal expansion of experimental biofilms, and also predict the observed changes in the height-to-radius aspect ratio that occur with varying average cell length.
Our results suggest that bacteria have harnessed the physics of mechanical instabilities to enable the generation of complex architectures. We expect that individual cell parameters have evolved in response to selective pressures on global biofilm morphology, e.g. during resource competition31; 32; 6; 33; 34. Since optimal morphology may be condition dependent, cells may also have evolved adaptive strategies that alter biofilm architecture, which could be investigated experimentally by screening for environmental influences on cell size, shape, and surface adhesion35.
For simplicity, we focused on flat surfaces, nutrient-rich conditions, and V. cholerae strains that have been engineered to have simpler interactions than those in wild type biofilms (Methods). Moreover, our agent-based model does not explicitly incorporate the VPS matrix secreted by cells2; 36; 24. Understanding the modifying effects of the VPS matrix, cell and surface curvature (Supplementary Fig. 14), cell-to-cell adhesion (Supplementary Fig. 15), and chemical feedback37 will be important directions for future studies. More broadly, we must develop a systematic method to account for the diversity of architectures that can be produced by local mechanical interactions (Supplementary Discussion).
Our study of a two-fluid model for verticalizing biofilms led us to discover a novel type of front propagation. Interestingly, in the biofilm surface layer, the front profile of cell density is precisely uniform starting at some finite distance from the edge, whereas previous models of front propagation saturate asymptotically toward uniformity 38; 39; 40; 41. The self-organized nature of this process yields a universal dependence of the expansion speed on the cell geometrical and mechanical parameters that is robust to details of the mechanical feedback. We have focused on the mean-field behavior of biofilms, but an open question is to understand the role of fluctuations in the “pressure” acting on cells, e.g. either from a jamming perspective42, a fluctuating hydrodynamical perspective44; 43, or a combination of approaches.
In summary, we have elucidated the physical mechanism underlying a complex developmental program observed at the cellular scale in bacterial biofilms. The relative biochemical and biophysical simplicity of this prokaryotic system allowed us to quantitatively understand the developmental pathway from the scale of a single cell to the scale of a large community assembly. Going forward, we expect bacterial biofilms will take on increasingly important roles as tractable models that can be used to understand how living systems generate and maintain their structures.
References
- (1) Ghannoum M., Parsek M., Whiteley M., Mukherjee P. K. Microbial Biofilms, 2nd Ed. ASM Press Washington, DC (2015)
- (2) Flemming H. C. Wingender J. The biofilm matrix. Nat. Rev. Microbiol. 8, 623-633 (2010)
- (3) Gordon, V. D., Davis-Fields, M., Kovach, K., Rodesney, A. Biofilms and mechanics: a review of experimental techniques and findings. J. Phys. D: Appl. Phys. 50, 223002 (2017)
- (4) Hall-Stoodley L., Costerton J. W. Stoodley P. Bacterial biofilms: from the natural environment to infectious diseases. Nat. Rev. Microbiol. 2, 95-108 (2004)
- (5) Costerton J.W., Stewart P. S., Greenberg E.P. Bacterial biofilms: a common cause of persistent infections. Science 284, 1318-1322 (1999)
- (6) Stewart, E. J., Satorius, A. E., Younger, J. G. Solomon, M. J. Role of environmental and antibiotic stress on Staphylococcus epidermidis biofilm microstructure. Langmuir 29, 7017-7024 (2013)
- (7) Drescher, K., et al. Architectural transitions in Vibrio cholerae biofilms at single-cell resolution. Proc. Natl. Acad. Sci. 113, E2066-E2072 (2016)
- (8) Yan, J., Sharo, A. G., Stone, H. A., Wingreen, N. S. Bassler, B. L. Vibrio cholerae biofilm growth program and architecture revealed by single-cell live imaging. Proc. Natl. Acad. Sci. 113, E5337-E5343 (2016)
- (9) Teschler J. K., et al. Living in the matrix: assembly and control of Vibrio cholerae biofilms. Nat. Rev. Microbiol. 13, 255-268 (2015)
- (10) Bartlett, T. M., et al. A periplasmic polymer curves Vibrio cholerae and promotes pathogenesis. Cell 168, 172-185 (2017)
- (11) Onsager, L. The effects of shape on the interaction of colloidal particles Ann. N. Y. Acad. Sci. 51, 627-659 (1949)
- (12) Berk V, et al. (2012) Molecular architecture and assembly principles of Vibrio cholerae biofilms. Science 337, 236-239 (2012)
- (13) Doostmohammadi, A., Thampi, S. P., Yeomans, J. M. Defect-mediated morphologies in growing cell colonies. Phys. Rev. Lett. 117, 048102 (2016)
- (14) Marie-Cecilia D., et al. Asymmetric adhesion of rod-shaped bacteria controls microcolony morphogenesis. bioRxiv doi:10.1101/104679 (2017)
- (15) Enos-Berlage, J. L. McCarter, L. L. Relation of capsular polysaccharide production and colonial cell organization to colony morphology in Vibrio parahaemolyticus J. Bacteriol. 182, 5513-5520 (2000)
- (16) Boyer, D., et al. Buckling instability in ordered bacterial colonies. Phys. Biol. 8, 026008 (2011)
- (17) Smith, W. P. J., et al. Cell morphology drives spatial patterning in microbial communities. Proc. Natl. Acad. Sci. 114, E280-286 (2016)
- (18) You Z., Pearce, D. J. G., Sengupta, A. Giomi, L. Geometry and mechanics of micro-domains in growing bacterial colonies. arXiv:1703.04504 (2017)
- (19) Mamou, G., Mohan, G. B. M., Rouvinski, A., Rosenberg, A. Ben-Yehuda, S. Early developmental program shapes colony morphology in bacteria. Cell Rep. 14, 1850-1857 (2016)
- (20) Grant, M. A. A., Waclaw, B., Allen, R. J. Cicuta, P. The role of mechanical forces in the planar-to-bulk transition in growing Escherichia coli microcolonies. J. Royal Soc. Interface 11, DOI: 10.1098/rsif.2014.0400 (2014)
- (21) Su, P.-T., et al. Bacterial colony from two-dimensional division to three-dimensional development. PLoS One 7, e48098 (2012)
- (22) Asally, M., et al. Localized cell death focuses mechanical forces during 3D patterning in a biofilm. Proc. Natl. Acad. Sci. 109, 18891-18896 (2012)
- (23) Farrell, F. D. C., Hallatschek, O., Marenduzzo, D. Waclaw, B. Mechanically driven growth of quasi-two-dimensional microbial colonies. Phys. Rev. Lett. 111, 168101 (2013)
- (24) Ghosh, P., Mondal, J., Ben-Jacob, E. Levine, H. Mechanically-driven phase separation in a growing bacterial colony. Proc. Natl. Acad. Sci. 112, E2166-E2173 (2015)
- (25) Chen, Y., van der Mei, H. C., Busscher, H. J. Norde, W. Viscous nature of the bond between adhering bacteria and substratum surfaces probed by atomic force microscopy. Langmuir 30, 3165-3169 (2014)
- (26) Barthel, E. Adhesive elastic contacts - JKR and more. J. Phys. D 41, 163001 (2008)
- (27) Candelier, R., Dauchot, O., Biroli, G. Dynamical facilitation decreases when approaching the granular glass transition. Euro. Phys. Lett. 92 24003 (2010)
- (28) White, C. L., Kitich, A., Gober, J. W. Positioning cell wall synthetic complexes by the bacterial morphogenetic proteins MreB and MreD. Mol. Microbiol. 76, 616-633 (2010)
- (29) Drescher, K., Shen, Y., Bassler, B. L., Stone, H. A. Biofilm streamers cause catastrophic disruption of flow with consequences for environmental and medical systems. Proc. Natl. Acad. Sci. 110, 4345-4350 (2013)
- (30) Chong, K. K. L., et al. Enterococcus faecalis modulates immune activation and slows healing during wound infection. J. Infect. Dis. 216, 1644-1654 (2017)
- (31) Yang, D. C., Blair, K. M. Salama, N. R. Staying in shape: the impact of cell shape on bacterial survival in diverse environments. Microbiol. Mol. Biol. Rev. 80, 187-203 (2016)
- (32) Young, K. D. The selective value of bacterial shape. Microbial. Mol. Biol. Rev. 70, 660-703 (2006)
- (33) Stocker, R. Seymour, J. R. Ecology and physics of bacterial chemotaxis in the ocean. Microbial. Mol. Biol. Rev. 76, 792-812 (2012)
- (34) Chang, F., Huang, K. C. How and why cells grow as rods. BMC Biol. 12, 54 (2014)
- (35) Jubair, M., Morris Jr., J. G., Ali, A. Survival of Vibrio cholerae in nutrient-poor environments is associated with a novel “persister” phenotype. PLoS One 7, e45187 (2012)
- (36) Yan, J., Nadell, C. D., Stone, H. A., Wingreen, N. S., Bassler, B. L. Extracellular-matrix-mediated osmotic pressure drives Vibrio cholerae biofilm expansion and cheater exclusion. Nat. Commun. 8, 327 (2017)
- (37) Vicsek, T. Fluctuations and Scaling in Biology. Oxford University Press (2001)
- (38) Fisher, R. A. The wave of advance of advantageous genes. Ann. Eugenics 7, 353-369 (1937)
- (39) von Saarloos, W. Front propagation into unstable states, Phys. Rep. 386, 29-222 (2003)
- (40) Fort, J. Pujol, T. Progress in front propagation research. Rep. Prog. Phys. 71, (2008)
- (41) Puliafito, A., et al. Collective and single cell behavior in epithelial contact inhibition. Proc. Natl. Acad. Sci. 109, 739-744 (2012)
- (42) Delarue, M., et al. Self-driven jamming in growing microbial populations. Nat. Phys. 12, 762-766 (2016)
- (43) Bi, D., Lopez, J. H., Schwarz, J. M., Manning, M. L. A density-independent rigidity transition in biological tissues. Nat. Phys. 11, 1074-1078 (2015)
- (44) Marchetti, M. C., et al. Hydrodynamics of soft active matter. Rev. Mod. Phys. 85, 1143 (2013)
- (45) Beyhan S., Yildiz F. H. Smooth to rugose phase variation in Vibrio cholerae can be mediated by a single nucleotide change that targets c-di-GMP signaling pathway. Mol. Microbiol. 63, 995-1007 (2007)
- (46) Landau, L. D., Lifshitz, E. M., Kosevich, A. M. Pitaevskii, L. P. Theory of Elasticity. Pergamon Press (1986)
- (47) Galassi, M., et al. GNU Scientific Library Reference Manual (3rd Ed.). Los Alamos National Laboratory (2017)
- (48) https://github.com/farzanb/Agent-based-biofilm-model
- (49) Guyer, J. E., Wheeler, D., Warren, J. A. FiPy: Partial Differential Equations with Python. Comp. Sci. Eng. 11 6-15 (2009)
Acknowledgements.
We thank Benjamin Bratton, Xiaowen Chen, Siddhartha Jena, Nishant Pappireddi, Pierre Ronceray, and Josh Shaevitz for insightful discussions and encouragement, Gary Laevsky for assistance with imaging, and Thomas Bartlett and Zemer Gitai for sharing the strain and reagents. This work was supported by the NIH under Grant No. R01 GM082938. (F. B., Y. M., N. S. W.), the Howard Hughes Medical Institute (B. L. B.), NSF Grant MCB-0948112 (B. L. B.), NSF Grant MCB-1344191 (H. A. S., B. L. B., N. S. W.), NIH Grant 2R37GM065859 (F. B. B. L. B.), the Max Planck Society-Alexander von Humboldt Foundation (B. L. B.), and the Eric and Wendy Schmidt Transformative Technology Fund from Princeton University (H.A.S., B.L.B., N.S.W.). J. Y. holds a Career Award at the Scientific Interface from the Burroughs Wellcome Fund.Affiliations
Joseph Henry Laboratories of Physics, Princeton University, Princeton NJ 08544, USA
Farzan Beroz
Department of Mechanical and Aerospace Engineering, Princeton University, NJ 08544, USA
Jing Yan, Benedikt Sabass, Howard A. Stone
Department of Molecular Biology, Princeton University, Princeton NJ 08544, USA
Jing Yan, Bonnie L. Bassler, Ned S. Wingreen
Department of Physics, Ben-Gurion University of the Negev, Beer-Sheva, Israel
Yigal Meir
ICS-2/IAS-2, Forschungszentrum Jülich, Jülich, Germany.
Benedikt Sabass
Lewis-Sigler Institute for Integrative Genomics, Princeton University, Princeton NJ 08544, USA Ned S. Wingreen
Author contributions
F. B., J. Y., and N. S. W. conceived the research. F. B. performed all simulations and analysis. J.Y. carried out all experiments, and J. Y. and F. B. contributed to the experimental design. All authors contributed to the manuscript preparation.
Competing interests
The authors declare no competing financial interests.
Methods
Growing and imaging experimental biofilms
Strains and media. The V. cholerae strain used in this study is a derivative of wild-type Vibrio cholerae O1 biovar El Tor strain C6706, harboring a missense mutation in the vpvC gene (VpvC W240R) that elevates c-di-GMP levels and confers a rugose biofilm phenotype45. Additional mutations were engineered into this strain using Escherichia coli S17-pir carrying pKAS32. Specifically, the biofilm gene responsible for cell-cell adhesion, rbmA, was deleted. To avoid the effects of cell curvature, we deleted crvA encoding the periplasmic protein CrvA responsible for the curvature of V. cholerae cells. Biofilm experiments were performed in M9 minimal medium, supplemented with 2 mM MgSO4, CaCl2, and 0.5 glucose. When indicated, Cefalexin (Sigma Aldrich) was added at and A22 (a gift from the Gitai group) was used at . These concentrations were experimentally determined to modulate cell morphology without affecting overall mass accumulation.
Biofilm growth. V. cholerae strains were grown overnight at 37 ∘C in liquid LB medium with shaking, back-diluted 30-fold, and grown for an additional two hours with shaking in M9 medium until early exponential phase (OD600 = ). These re-grown cultures were diluted to OD600 = 0.001 and of the diluted cultures were added to wells of 96-well plates with 1.5 coverslip bottoms (MatTek). The cells were allowed to attach for ten minutes, after which the wells were washed twice with fresh M9 medium, and, subsequently, of fresh M9 medium was added, with or without drugs. The low initial inoculation density enabled isolated biofilm clusters to form. The locations of the founder cells were identified, and one hour after inoculation, imaging was begun on the microscope stage at 25 ∘C.
Microscopy. Details of the imaging system have been described elsewhere8. Briefly, images were acquired with a spinning disk confocal microscope (Yokogawa) a 543 nm laser (OEM DPSS), and an Andor iXon 897 EMCCD camera. For single-cell resolution imaging, a 60x water objective with a numerical aperture of 1.2 plus a 1.5x post-magnification lens was used. To avoid evaporation, immersion oil with a refractive index of 1.3300 0.0002 (Cargille) was used instead of water. The time difference between each image acquisition was 10 minutes, and the total imaging time was 8 hours. Only the bottom of the biofilm was imagined (with a step size of ) to avoid excessive photobleaching and phototoxicity. For coarse-grained imaging, a 20x multi-immersion objective was used without post-magnification. In this case, the time difference between each image acquisition was 30 minutes, and entire biofilms were imaged (with a step size of ). At the end of the coarse-grained time course, the biofilm clusters were imaged again with high magnification to determine cell lengths. All image acquisitions were automated using Nikon Element software. All cells harbored mKO fluorescent proteins expressed from the chromosome. Experimental images in Fig. 4 were false-colored to differentiate between different growth conditions.
Image processing. The cell segmentation protocol and Matlab codes have been described elsewhere in detail8. Cell position, cell length, and cell orientation were used as input for 3D rendering in Fig. 1a and for further analysis. For biofilm clusters grown in the presence of A22 or Cefalexin, cell lengths were manually measured in the bottom cell layers of the biofilms using the Nikon Element software. To define the biofilm shape parameters in the coarse-grained images, the bottom cell layers of the biofilms were first identified by finding the brightest -cross section, according to the total fluorescence intensity. The contour of the individual biofilm cluster was next identified using the three-dimensional Canny edge detection method implemented in Mathematica. To correct for the inevitable optical stretching in the -direction, we compared the heights obtained from the same cluster in the coarse-grained and the fine resolution images. By imaging a series of biofilm clusters of different sizes, we obtained a curve of a biofilm cluster’s actual height versus its apparent height in the coarse-grained images, which we used to calibrate the heights measured in the coarse-grained images.
Modeling biofilms
Agent-based model. We model the volume occupied by a cell as a cylinder of length with two hemispherical end caps each of radius . We treat cell growth as elongation that increases cell volume at a fixed rate (chosen randomly at birth from a narrow Gaussian distribution to desynchronize cell divisions). Cells are born with an initial cell cylinder length and grow to twice their total length. When a cell reaches the division length, the cell is instantaneously replaced by two identical daughter cells. In our model, cell-to-cell and cell-to-surface overlaps exert repulsive forces according to Hertzian contact mechanics for elastic materials46. In the case of the cell-to-surface overlap, we also include an attractive interaction with an energy proportional to the cell-to-surface contact area, i.e., the Derjaguin approximation25; 26. Finally, we include two sources of viscous drag: a modest damping of three-dimensional motion through the surrounding fluid and biopolymer matrix, and a much larger damping of sliding motion along the adhesive surfaceR34. We determine the parameters in our model by fitting to the experimental data (Supplementary Fig. 1).
Simulation of agent-based model. To simulate the agent-based model, we numerically integrate the equations of motion using an explicit embedded Runge-Kutta-Fehlberg method. Our implementation of this method in C++ is adapted from the GNU Scientific Library47, and available freely online at GitHub48. To account for symmetry-breaking microscopic irregularities, we add a small amount of random noise to each component of the generalized force at every time step ( to the force acting on the center-of-mass and to the generalized force acting on the orientation vector ). The initial conditions consist of a single cell of length at elevation angle and penetration depth .
Continuum model. To describe the radial expansion and orientational dynamics of the biofilm, we treated the horizontal cells and vertical cells as continuous fields and , with the total density defined as the sum , where is the ratio of vertical to horizontal cell footprints. In regions where exceeds the close-packing density , the rate of change of the horizontal cell density is proportional to the divergence of the flux of cells due to cell transport plus terms due to cell growth and cell verticalization. We assume that cell transport is given by the gradient of surface pressure divided by a surface viscosity coefficient , where surface pressure is approximated as linearly proportional to the areal deformation , i.e. following “Hooke’s law”. Cell growth in the plane is proportional to the local horizontal cell density and occurs at a fixed rate . We assume that cell verticalization locally converts horizontal cell density to vertical cell density at a fixed rate in regions where , where is the threshold surface density for verticalization.
Simulation of continuum model. We simulated the dynamics of the cell densities in Python using FiPy, a finite volume PDE solver49. We performed our simulation on a mesh containing points with a spacing of and a temporal step size of .
Data availability
The simulation used for the agent-based model is available on GitHub48. The code used for the analysis in the current study is available from the corresponding author following request.