SNhunt151: an explosive event inside a dense cocoon
Abstract
SNhunt151 was initially classified as a supernova (SN) impostor (nonterminal outburst of a massive star). It exhibited a slow increase in luminosity, lasting about 450 d, followed by a major brightening that reaches mag. No source is detected to mag in archival images at the position of SNhunt151 before the slow rise. Low-to-mid-resolution optical spectra obtained during the pronounced brightening show very little evolution, being dominated at all times by multicomponent Balmer emission lines, a signature of interaction between the material ejected in the new outburst and the pre-existing circumstellar medium. We also analyzed mid-infrared images from the Spitzer Space Telescope, detecting a source at the transient position in 2014 and 2015. Overall, SNhunt151 is spectroscopically a Type IIn SN, somewhat similar to SN 2009ip. However, there are also some differences, such as a slow pre-discovery rise, a relatively broad light-curve peak showing a longer rise time ( d) and a slower decline, along with a negligible change in the temperature around the peak ( K). We suggest that SNhunt151 is the result of an outburst, or a SN explosion, within a dense circumstellar nebula, similar to those embedding some luminous blue variables like Carinae and originating from past mass-loss events.
keywords:
galaxies: individual (UGC 3165) — stars: evolution — supernovae: general — supernovae: individual (SNhunt151).1 Introduction
Massive stars can lose mass via steady winds, binary interaction, or as a consequence of dramatic eruptions, generating dense and structured circumstellar cocoons. When these stars explode as supernovae (SNe), the ejecta interact with a pre-existing, optically thick circumstellar medium (CSM), producing collisionless shocks (see, e.g., Chevalier & Irwin 2012 or Ofek et al. 2013b) that convert the ejecta kinetic energy into radiation. This interaction strongly affects the SN spectroscopic and photometric display. The study of these observables gives us important clues to the progenitors’ mass-loss rates, hence constraining the late evolution of massive stars (see, e.g., Smith 2014).
Early-time spectra of H-rich interacting SNe (Type IIn) are characterized by a blue continuum with narrow hydrogen emission lines, with full width at half-maximum (FWHM) velocities up to about 2000 km s-1. These are believed to arise from the ionization of the pre-existing CSM because of its interaction with the SN ejecta. The narrow lines may have Lorentzian wings caused by electron scattering. However, relatively broad components (FWHM km s-1) can also be produced by fast-moving SN ejecta and are detectable when the CSM is optically thin (see, e.g., Terreran et al. 2016). Interacting SNe display a large variety of spectral line components (having different widths and profiles) and photometric parameters (SNe with both slowly and rapidly declining light curves). These observational differences indicate a substantial diversity in the energetics, as well as in the configuration of the progenitor star and its environment at the moment of explosion.
The typical SN signatures can be masked at all phases if the SN ejecta interact with dense CSM. In particular, the elements produced during the explosive nucleosynthesis (including O, C, Mg) are not frequently detected in SNe IIn.
A growing number of interacting SNe preceded by major optical outbursts weeks to years before the SN explosion (Ofek et al., 2014) has been observed. These pre-SN outbursts are often called “SN impostors” (e.g., SN 1997bs, Van Dyk et al. 2000; or the general discussions by Smith et al. 2011 and Van Dyk & Matheson 2012a) because they mimic in terms of energetic and spectral appearance a real SN explosion, though the star survives the burst. The discrimination between SN impostors and SNe IIn can be challenging. When outbursts of massive stars herald terminal SN explosions, the instabilities are presumably related to physical processes occurring when the star approaches the end of its evolution (see, e.g., Quataert & Shiode 2012; Smith & Arnett 2014; Fuller 2017). Well-studied examples include SN 2009ip (Smith et al. 2010; Foley et al. 2011; Pastorello et al. 2013a; Fraser et al. 2013; Mauerhan et al. 2013; Margutti et al. 2014; Fraser et al. 2015; Graham et al. 2017), SN 2010mc (Ofek et al., 2013a; Smith et al., 2014), LSQ13zm (Tartaglia et al., 2016), SN 2015bh (Ofek et al., 2016; Elias-Rosa et al., 2016; Thöne et al., 2017), and SN 2016bdu (Pastorello et al., 2017).
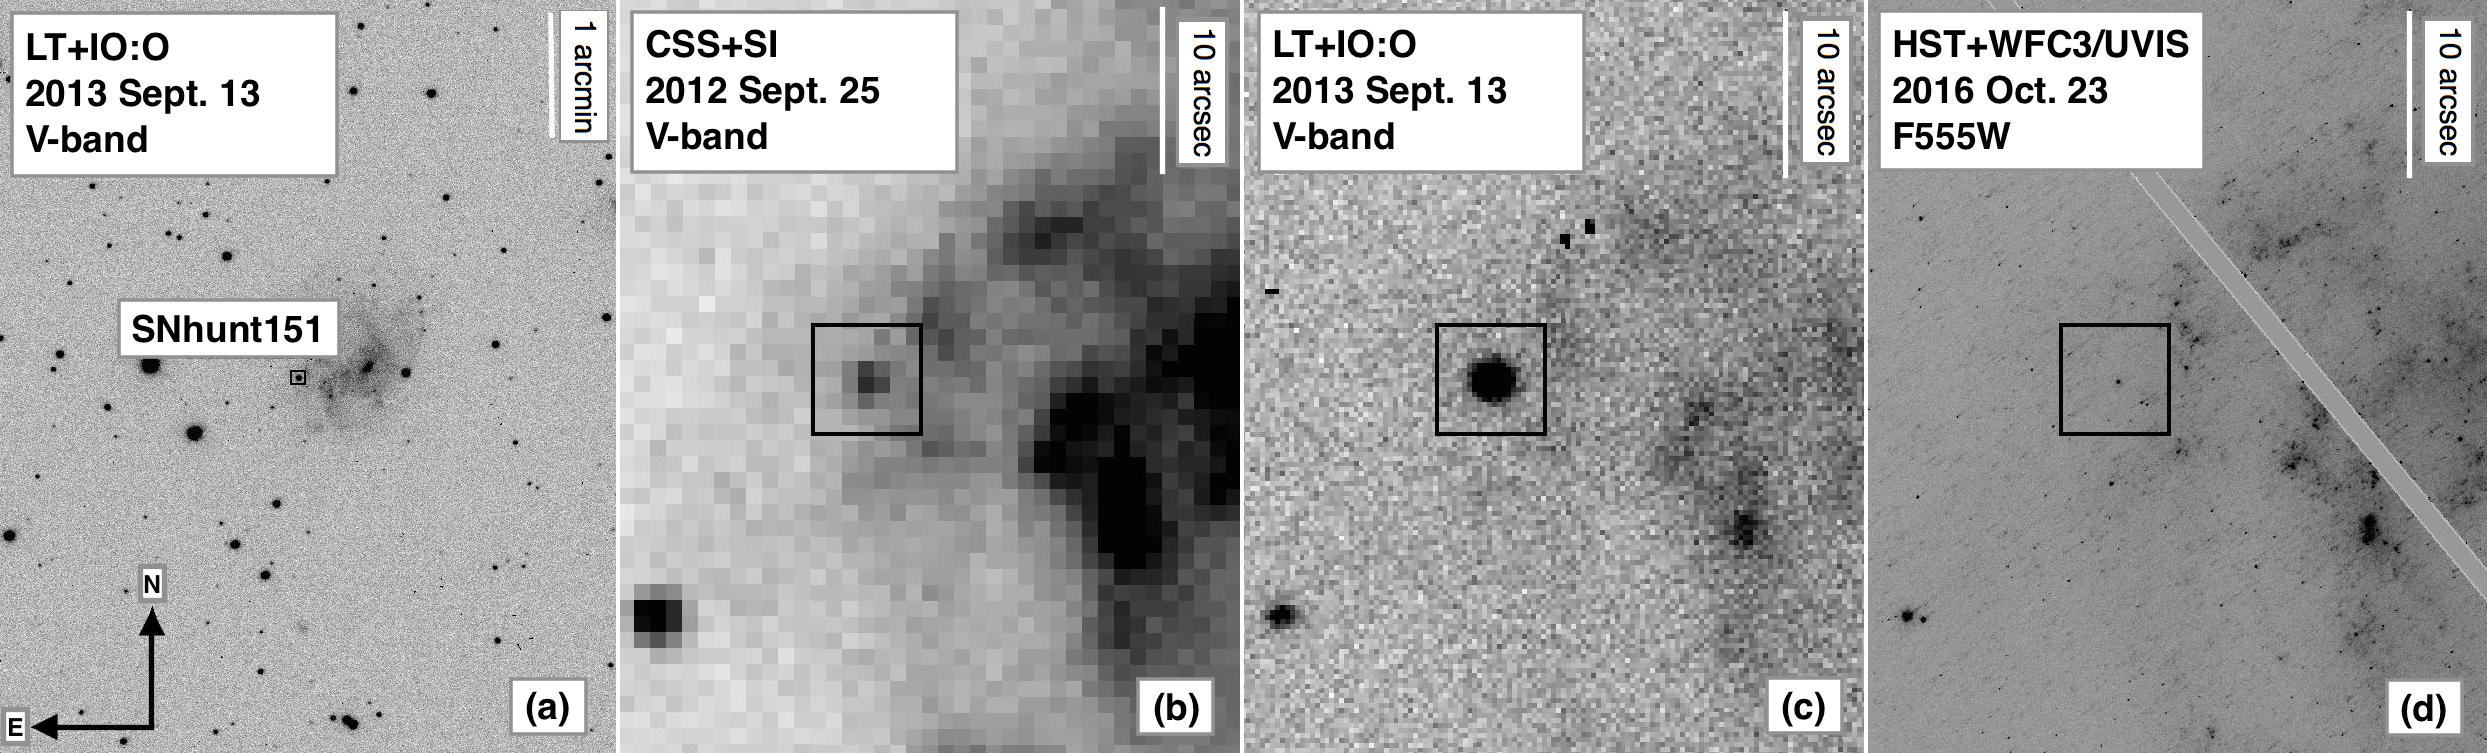
In this context, SNhunt151 (also known as PSN J04472985+2358555, XM07BW, and CSS131025:044730+235856) is an interesting object. It was discovered by the Catalina Real-Time Transient Survey (CRTS; Drake et al. 2009)111http://crts.caltech.edu. on 2012 September 25.41 (UT dates are used hereafter) at (J2000.0; Fig. 1). The object, hosted in the spiral galaxy UGC 3165, had an unfiltered magnitude of . The transient was reobserved, on 2013 August 30.17, showing a significant increase in its brightness, up to mag.
The presence of an H emission line in the spectrum of 2013 September 02.21, showing a complex profile composed of broad and narrow components (Pastorello et al., 2013b, c), is reminiscent of SN 2009ip. After the initial brightening, a further increase (by about 2 mag) in the luminosity was reported about 50 d later (Elias-Rosa et al., 2013).
In this manuscript, we present our study of SNhunt151. Basic information on the SN host galaxy, UGC 3165, is found in Section 2. Results of the photometric and spectroscopic monitoring campaign of SNhunt151 are presented in Sections 3 and 4. A discussion and brief summary follow in Section 5.
2 Host Galaxy, Distance, and Reddening
UGC 3165 is classified as an irregular galaxy (IAm222NED, NASA/IPAC Extragalactic Database; http://nedwww.ipac.caltech.edu/.). From the average recession velocity of the galaxy corrected for Local Group infall into the Virgo cluster (Mould et al., 2000) km s-1 (), and assuming H0 = 73 km s-1 Mpc-1, we derive a distance of Mpc ( mag). This distance will be adopted throughout this paper.
The Milky Way extinction along the line of sight of the transient is quite large, mag (NED; Schlafly & Finkbeiner 2011). Additionally, the higher-resolution spectra of the transient (taken on 2013 September 2 and 2013 November 1; see Table 13) exhibit a blended Na i D feature at the recession velocity of the host galaxy, with an average equivalent width (EW) of Å. Using the relations given by Turatto et al. (2003) and Poznanski et al. (2012), and assuming (Cardelli et al., 1989), we derive mag. Thus, we adopt mag333We consider a conservative uncertainty in the Milky Way extinction of about 10%.( mag) as the total extinction toward SNhunt151. We caution that a large dispersion is observed in the EW (Na i D) versus plane when a large SN sample is considered. For this reason, the derived extinction estimate cannot be considered secure (see, e.g., Elias-Rosa 2007; Poznanski et al. 2011; Phillips et al. 2013).
3 Photometry
3.1 Ground-Based Observations
Optical BVRI (Johnson-Cousins system), ugriz (Sloan system), and near-infrared (NIR) JHK images of SNhunt151 were taken using a large number of observing facilities, listed in Table 6. After discovery, the transient was observed for about 14 months with a gap of months when it was behind the Sun. Our data include 48 epochs taken before the discovery, starting on December 2003 [upper limit from the Sloan Digital Sky Survey (SDSS) DR9 444http://www.sdss.org.] up to March 2012. These data were taken mainly by amateur astronomers. One epoch was secured using the Ultraviolet and Optical Telescope on board the Swift satellite on 2013 September 05.65. However, only upper limits were estimated for the UVW2 ( mag) and UVW1 ( mag) bands (Vegamag).
Photometric observations were preprocessed following the standard recipe in iraf555iraf is distributed by the National Optical Astronomy Observatory, which is operated by the Associated Universities for Research in Astronomy, Inc., under cooperative agreement with the National Science Foundation. for CCD images (trimming, overscan, bias, and flat-field corrections). For the NIR exposures, we also applied an illumination correction and background-sky subtraction. For later epochs, multiple exposures obtained in the same night and filter were combined to improve the signal-to-noise ratio (S/N). The SN magnitudes were measured using point-spread-function (PSF) fitting with SNOoPy666SNOoPy is a package for SN photometry developed by E. Cappellaro. A package description can be found at http://sngroup.oapd.inaf.it/snoopy.html.. No template subtraction was performed since no major differences were found when comparing the photometry obtained through both PSF fitting and template subtraction. The data derived with the two methods are in agreement to within 0.1 mag.
In order to calibrate the instrumental magnitudes to standard photometric systems, we used the zero points and colour terms measured through reference SDSS stars in the field of SNhunt151. The Johnson-Cousins magnitudes of these reference stars were calculated from the Sloan magnitudes following the conversions of Chonis & Gaskell (2008). For the NIR photometry, we used the Two Micron All Sky Survey (2MASS) catalog as reference for the calibration. Once the local sequence was calibrated, we proceeded to calibrate our transient, even for non-photometric nights.
Unfiltered magnitudes from amateurs were scaled to Johnson-Cousins - or -band magnitudes, depending on the wavelength peak efficiency of the detectors. Uncertainty estimates were obtained through artificial-star experiments. This is combined (in quadrature) with the PSF fit error returned by DAOPHOT and the propagated errors from the photometric calibration.
3.2 Space-Based Observations
The SNhunt151 site was also observed by the Hubble Space Telescope (HST) with the Ultraviolet-Visible (UVIS; pixel-1) Channel of the Wide-Field Camera 3 (WFC3) in the and bands. These images were taken on 2016 October 23 as part of the SN snapshot survey GO-14668 (PI: A. V. Filippenko), 1113.1 days after the -band peak of SNhunt151’s Event B (see below).
A source was detected at the transient position in all images with root-mean-square uncertainties (Fig. 1(d)), through comparison with ground-based, post-discovery Copernico Telescope+AFOSC and NOT+ALFOSC images taken on 2013 August 31 (seeing ) and 2014 August 24 (seeing ).
The magnitudes of the source in vegamag were obtained using Dolphot777Dolphot is a stellar photometry package that was adapted from HSTphot for general use (Dolphin, 2000) with the individual WFC3 pre-mosaic frames. We used the WFC3 module of v2.0, updated 2016 April; http://americano.dolphinsim.com/dolphot/.. We assume that the and bandpasses correspond approximately to Johnson-Cousins and , respectively; thus, we include these measurements in Table 7.
3.3 Light Curves
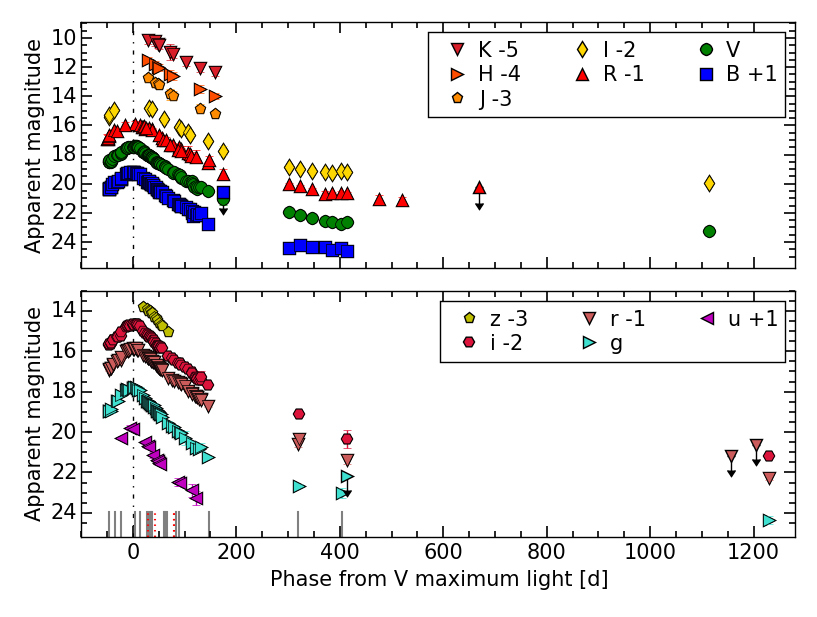
The and light curves are shown in Figure 2, relative to the maximum date on 2013 October 06.3, or MJD 56571.8 (estimated by low-order polynomial fitting; in the following we will adopt this epoch as the reference). As we can see, SNhunt151 was discovered well before maximum light. The light curves also show a relatively fast decline after maximum, similar to those of the rapidly declining SNe II (e.g., Anderson et al. 2014). Optical light curves of SNhunt151 show post-maximum decline rates between 1.8 and 2.8 mag (100 d)-1, and those in the NIR have a slightly slower decline ( mag (100 d)-1). At late times ( d), SNhunt151 decreases in brightness by mag with respect to maximum light, and shows a slower decline ( mag (100 d)-1). Table 1 summarises the magnitude and epochs at maximum light, as well as the decline rates of SNhunt151.
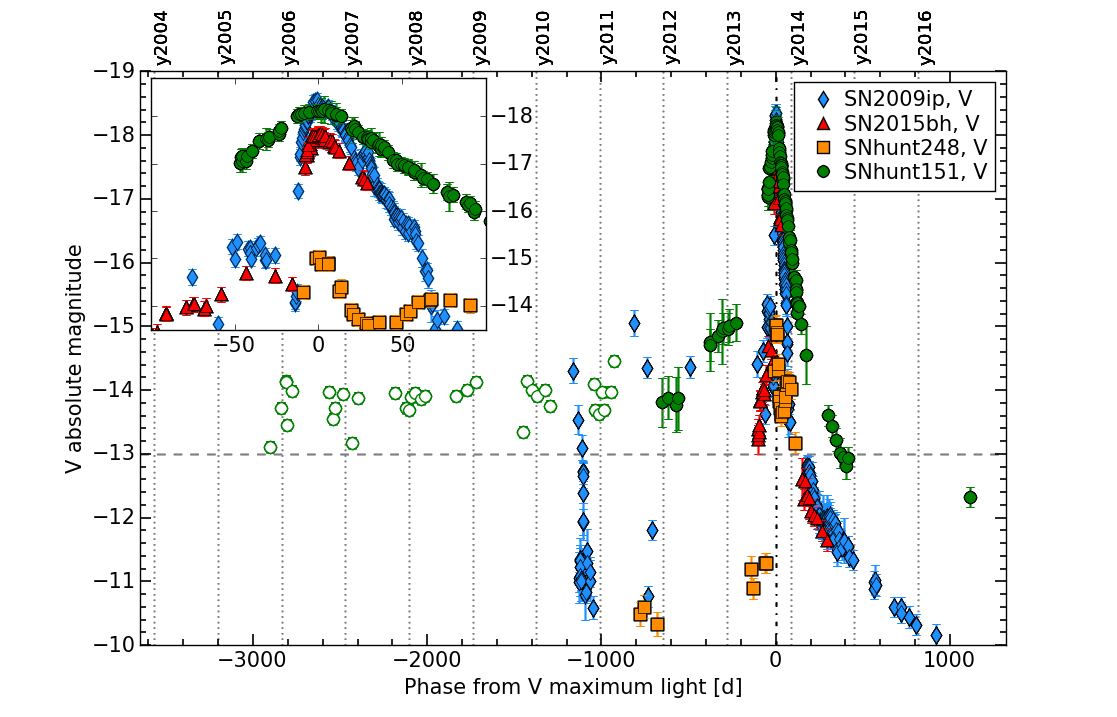
The SNhunt151 site was observed several times over almost a decade before the transient discovery (see Table 7 and Figure 3, and Figure 1(b)). Until the end of 2011, we did not detect a source at the position of the transient, at an absolute magnitude brighter than mag. However, from December 2011 we began to detect some flux, followed by a slow luminosity rise (labelled Event A) of about 1.6 mag in 450 days ( mag (100 d)-1), corresponding to a rise from mag to mag. Note that this rise may also consist of multiple distinct outbursts, since the observational campaign was interrupted twice. After August 2013, the transient brightness showed a much steeper increase, reaching a peak of mag in (labelled Event B), consistent with the typical magnitudes at peak of most Type IIn SNe (between and mag; Kiewe et al. 2012), or the Event B of the SN 2009ip-like family of transients ( mag; Pastorello et al. 2017, submitted).
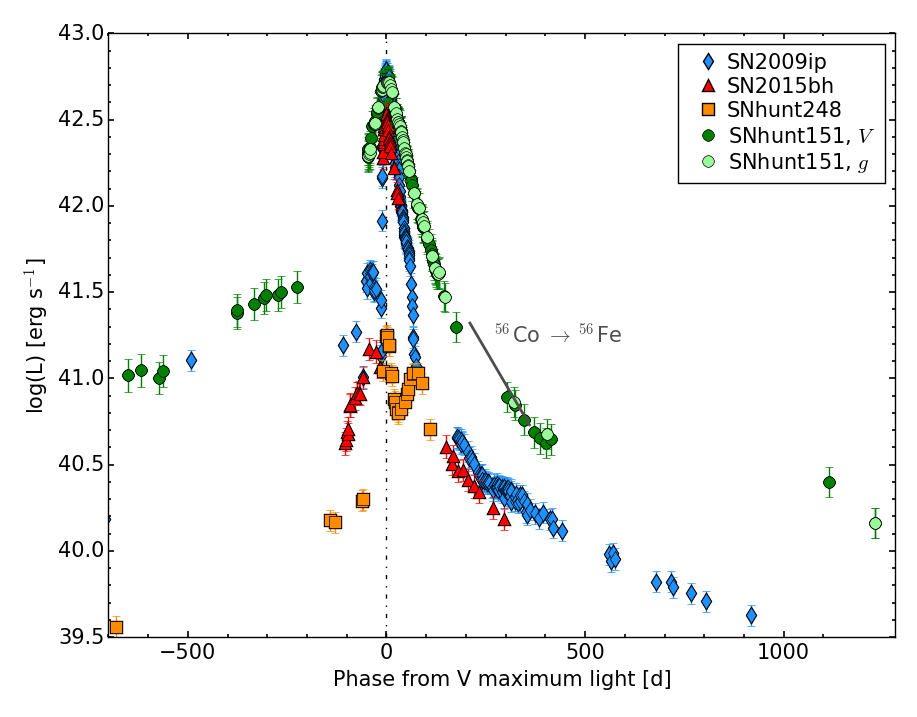
The absolute magnitude light curve of SNhunt151 is compared in Figure 3 with those of SN 2009ip (Maza et al., 2009; Smith et al., 2010; Foley et al., 2011; Pastorello et al., 2013a; Mauerhan et al., 2013; Fraser et al., 2013), SN 2015bh (Elias-Rosa et al., 2016), and the SN impostor SNhunt248 (Kankare et al., 2015). For these objects we have adopted the distance and extinction values from the literature (see Table 5). From this comparison, we note that while the brightness at maximum of Event B of SNhunt151 is similar to those of the other transients in the sample (with the exception of the SN impostor SNhunt248 during its “2014b” peak), none of them matches the slowly rising Event A. We also note that the Event B light curve of SNhunt151 is broader than those of the other transients, with both a longer rise time and a slower decline.
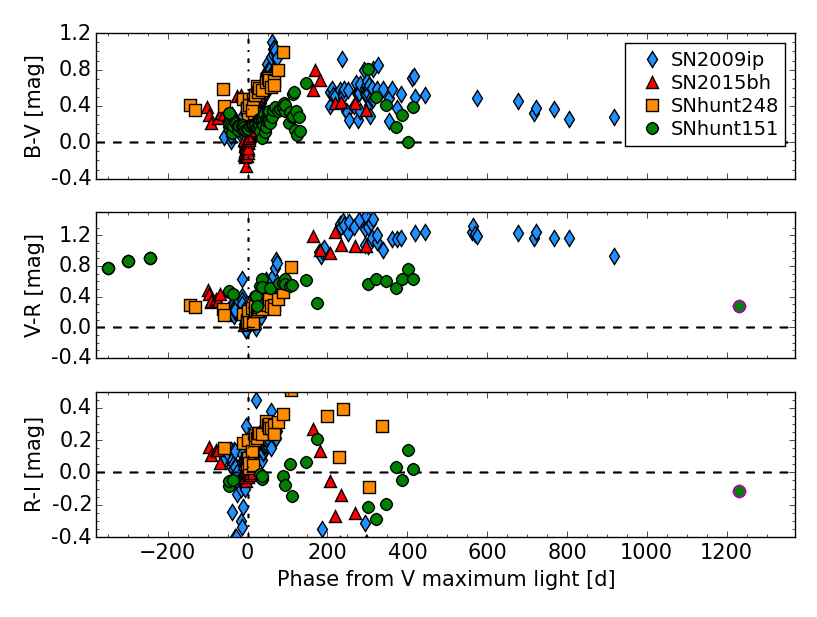
We also find differences in the colour curves of the objects of our sample (Fig. 4). SNhunt151 shows a relatively flat and slow colour evolution toward the red for the and colours, but an almost constant colour. The approximated Johnson-Cousins colour at our last epoch (phase 1229 d, adopting the conversions of Chonis & Gaskell (2008)) also follows this trend. No other object from our sample of comparisons exhibits similar behaviour.
We computed a pseudobolometric light curve of SNhunt151, integrating the wavelength range covered from the to the bands (Fig. 5). The fluxes at the effective wavelengths were derived from extinction-corrected apparent magnitudes, when observations in the or bands were available. When no observation in individual filters was available, the missing photometric epoch was recovered by interpolating the values from epochs close in time or, when necessary, extrapolating assuming a constant colour from the closest available epoch. The pseudobolometric fluxes were estimated integrating the spectral energy distribution (SED) at each epoch following the trapezoidal rule, and assuming zero contribution outside the integration boundaries. Finally, the luminosity was derived from the integrated flux accounting for the adopted distance. The bolometric luminosity errors account for the uncertainties in the distance estimate, the extinction, and the apparent magnitudes. The pseudobolometric light curves of SN 2009ip, SN 2015bh, and SNhunt248 were computed in a similar manner as that of SNhunt151.
Fitting low-order polynomials to the pseudobolometric light curve of SNhunt151, we estimate a peak luminosity for Event B of erg s-1. The pseudobolometric peak of SNhunt151 is comparable to that of SN 2009ip, and is more luminous than those of the other transients of the sample (see Fig. 5 and Table 2). Note that the Event A maximum is around 15 times fainter than the light-curve peak of Event B. The pseudobolometric tail of SNhunt151 seems to follow roughly the radioactive decay tail of 56Co to 56Fe seen in SNe II, at least until d. However, the last two points taken at phase d are brighter by mag than the expected luminosity of a 56Co-decay-powered light curve.
| Banda | Early rise (Event A) | MJDmax | Decline from max.b | Tail rate at d | |
|---|---|---|---|---|---|
| [mag (100 d)-1] | (mag) | [mag (100 d)-1] | [mag (100 d)-1] | ||
| - | 56572.0 (0.8) | 18.2 (0.1) | 2.23 (0.26) | 0.21 (0.15) | |
| 0.35 (0.15) | 56571.8 (1.0) | 17.4 (0.1) | 2.09 (0.18) | 0.69 (0.11) | |
| 0.35 (0.23) | 56572.1 (1.2) | 16.9 (0.1) | 1.92 (0.24) | 0.49 (0.15) | |
| - | - | - | 1.81 (0.17) | 0.28 (0.08) | |
| - | 56568.3 (1.2) | 18.8 (0.1) | 2.39 (0.40) | - | |
| - | 56571.1 (0.4) | 17.8 (0.1) | 2.29 (0.18) | 0.45 (0.23)c | |
| - | 56572.6 (0.8) | 16.9 (0.1) | 1.98 (0.16) | 0.97 (0.19) | |
| - | 56571.9 (0.5) | 16.7 (0.1) | 2.04 (0.14) | 1.32 (0.45) | |
| - | - | - | 2.81 (0.15) | - | |
| - | - | - | 1.85 (0.26) | - | |
| - | - | - | 1.80 (0.23) | - | |
| - | - | - | 1.84 (0.33) | - |
a Apparent magnitude at peak of the light curves could not be constrained.
b Considering the interval from d to 175 d after -band maximum light.
c Note that the tail rates for the Sloan bands were derived from just two epochs.
| Object | Luminosity |
|---|---|
| ( erg s-1) | |
| SN 2009ip | 6.1 (1.3) |
| SN 2015bh | 3.3 (0.7) |
| SNhunt248 | 0.2 (0.1) |
| SNhunt151 | 5.2 (1.3) |
4 Spectroscopy
Spectroscopic monitoring of SNhunt151 started soon after the confirmation of the object, on 2013 August 20, and lasted 15 months. We collected a total of 16 optical and 4 NIR spectra. Basic information on the spectroscopic observations can be found in Table 13.
All spectra were reduced following standard procedures with iraf routines. The two-dimensional frames were debiased and flat-field corrected, before the extraction of the one-dimensional spectra.
Several pairs of NIR spectra were taken at each epoch at different positions along the slit, and consecutive pairs were subtracted from each other in order to remove the sky background. The subtracted images were aligned to match the spectrum profile and added together. Finally, the source spectrum was extracted from the combined images.
The one-dimensional optical and NIR spectra were then wavelength calibrated by comparison with arc-lamp spectra obtained during the same night and with the same instrumental configuration, and flux calibrated using spectrophotometric standard stars. The wavelength calibration was verified against the bright night-sky emission lines and adjusted if necessary. The absolute flux calibration of the spectra was cross-checked against the broadband photometry and corrected, when necessary. Finally, the strongest telluric absorption bands in the optical spectra were removed using standard-star spectra (in some cases, residuals are still present after the correction).
4.1 Spectral Evolution
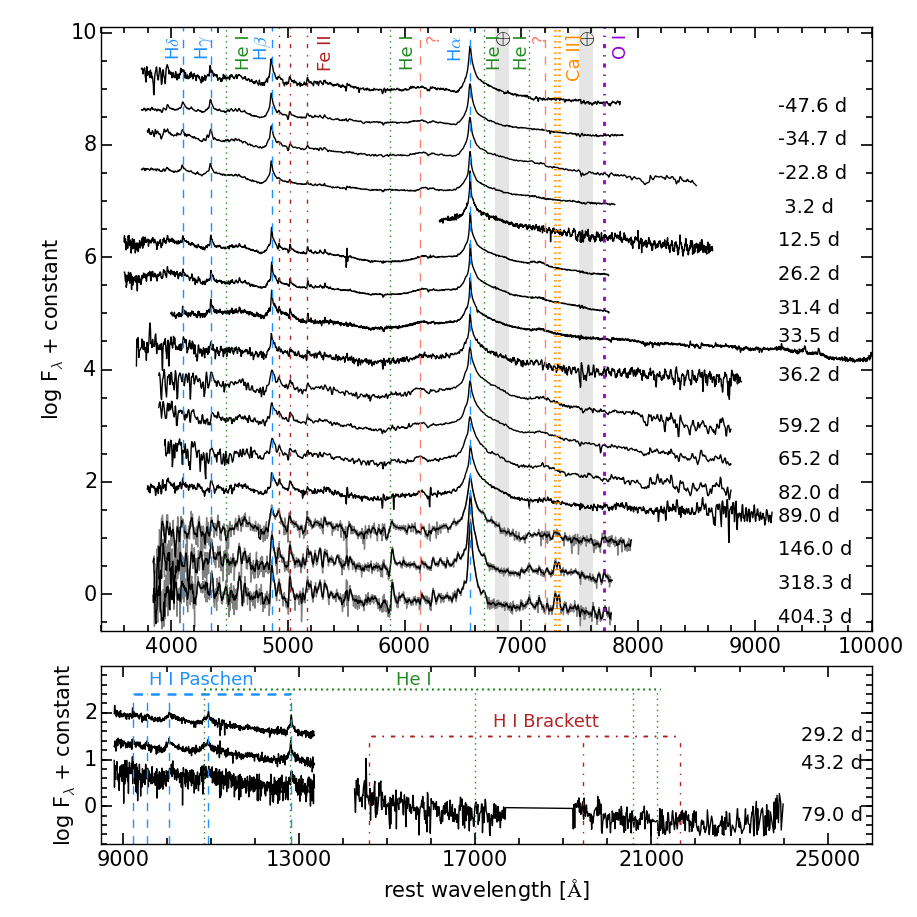
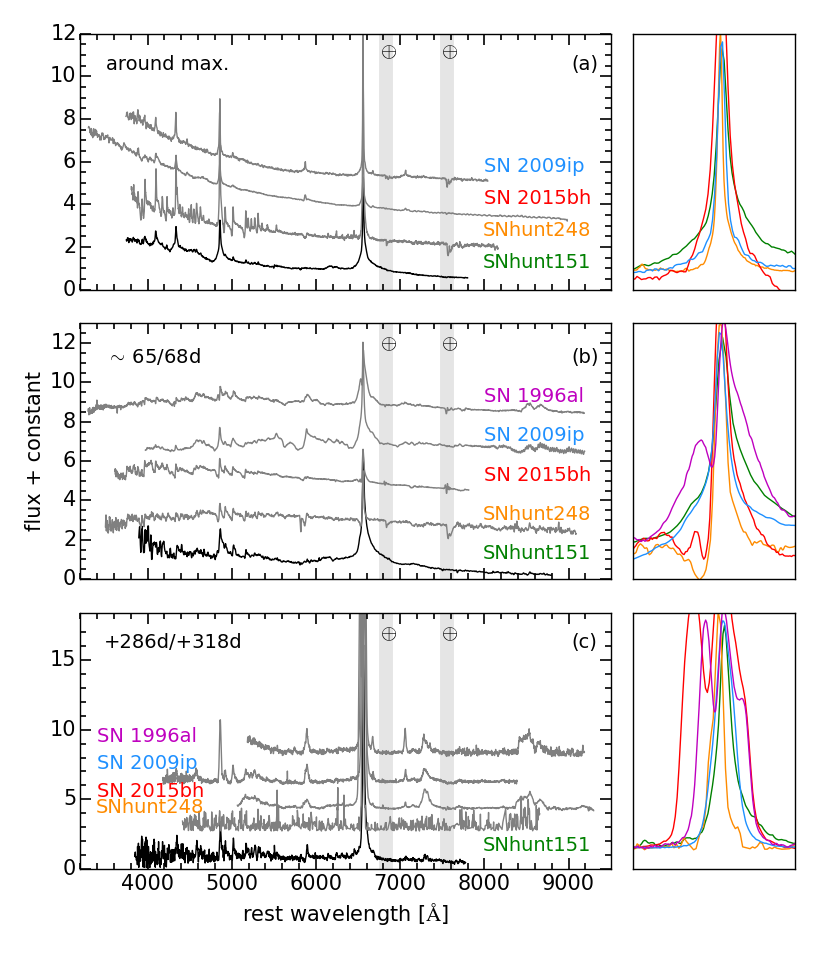
Figure 6 shows the sequence of optical and NIR spectra of SNhunt151, while in Figure 7 we compare the optical spectra at representative epochs with those of the Type IIn SN 1996al (Benetti et al., 2016), and the transients SN 2009ip (Pastorello et al., 2013a; Fraser et al., 2013, 2015), SN 2015bh (Elias-Rosa et al., 2016), and SNhunt248888Note that the SNhunt248 phases are considered with respect to its major peak, “2014b.” (Kankare et al., 2015) at similar epochs. All of the spectra have been corrected for extinction and redshift using values from the literature (see also Table 5).
The spectra of SNhunt151 taken from d to d during Event B exhibit a rather blue continuum and very little evolution. They are dominated by multicomponent Balmer lines in emission, and some relatively weak Fe ii features. While the Balmer lines do not show evolution during this period, the iron lines become slightly stronger after d from maximum light. We can also distinguish two broad emission features centered at 6130 and 7200 (they are more evident in the spectra between phases 59 and 82 d), with FWHM and 175 ( and 8000 km s-1), respectively. Similar structure is not seen in H. A possible explanation is the presence of a bipolar jet interacting with the dense CSM. This mechanism was also proposed for SN 2010jp, which shows a roughly similar (but rapidly evolving) H profile (Smith et al., 2012).
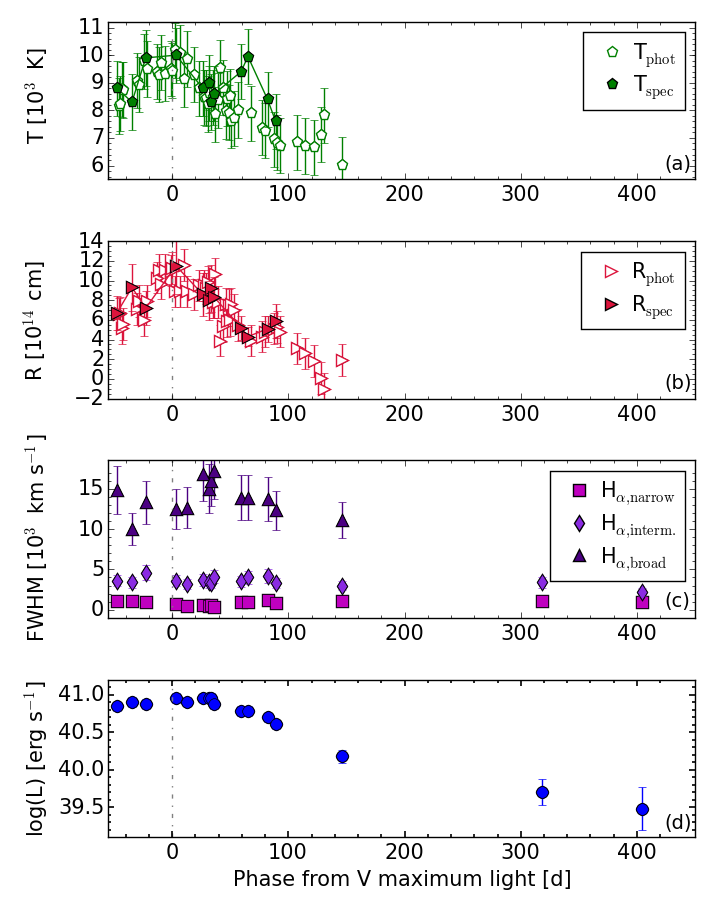
The photospheric temperatures at these epochs are estimated by fitting the SED of SNhunt151 with a blackbody function after removing the strongest features of the spectra. As shown in Figure 8(a) and in Table 3, there is no clear evidence of variation of temperature around the peak. This is in the range to K (a lower temperature was estimated only for the last spectrum taken just before the seasonal gap, 89 d after maximum light). This behaviour is not seen in other Type IIn SNe (e.g., Taddia et al. 2013), or for the reference transients used here. In all these cases, the temperature is close to 20,000 K at the major peak, decreasing later to 8000–5000 K, and then remaining nearly constant in the following days; see, for example, SN 2009ip (Margutti et al., 2014) and SN 2015bh (Elias-Rosa et al., 2016). We also estimated and plotted the photospheric temperatures derived from the SED of SNhunt151 obtained from broadband photometry. Here there is some evidence of evolution, with a possible slow decrease of temperature after Event B. Similarly, the radius of the photosphere exhibits a likely slow evolution peaking at cm during Event B, and then decreases to cm at 146 d (Fig. 8(b)). At later phases (60 and 80 d after the peak of Event B), the estimated radius seems to increase and then decrease again. This fluctuation of the value of the photospheric radius is possibly caused by a geometric effect (e.g., an asymmetry in the CSM distribution) or a nonlinear CSM density profile (see, e.g., Benetti et al. 2016). Note that these estimates of the radius are approximate, owing to the assumptions made to derive the temperatures and the luminosities of SNhunt151. For instance, the derived temperatures are more likely lower-limit estimates since we have assumed black-body spectra without taking into account effects such as the metal line blanketing.
Around maximum light, SNhunt151 spectra are dominated by Balmer features such as those of the transients SN 2009ip and SN 2015bh. SNhunt151, unlike these transients, does not show He i features, and its H profile exhibits a broader component (Fig. 7(a)). At phase 65–68 d (Fig. 7(b)), SNhunt151 is still relatively blue, while the other transients at the same phase turned red. Another difference to be noted is the absence of P-Cygni minima in the iron and Balmer lines.
At late phases ( d), the broader component of the H line seems to be weakening, while the spectra are still dominated by the narrow component (see Section 4.2). Resolved narrow lines ( km s-1 FWHM) of He i 5876, 6678, and 7065 are now evident in the spectra, as well as [Ca ii] 7291, 7323. A hint of O i 7774 might be identified, but because of the low S/N in that region, it is only a tentative identification. Fe ii lines are still strong and show low-contrast P-Cygni profiles (for example, Fe ii 4923, 5018, and 5169) with expansion velocities between 900 and 1400 km s-1 from the absorption minima.
These features are still weak if we compare SNhunt151 spectra with those of the transients of our sample at similar epochs (Fig. 7(c)). We also highlight the differences between the H profiles (see inset in Fig. 7(c)), with SNhunt151 showing a quite symmetric profile. This is similar to that of SN 2009ip, except for an extended red wing of SNhunt151, and unlike the asymmetric H profiles of SNhunt248 and SN 2015bh, or the double-peaked one of SN 1996al.
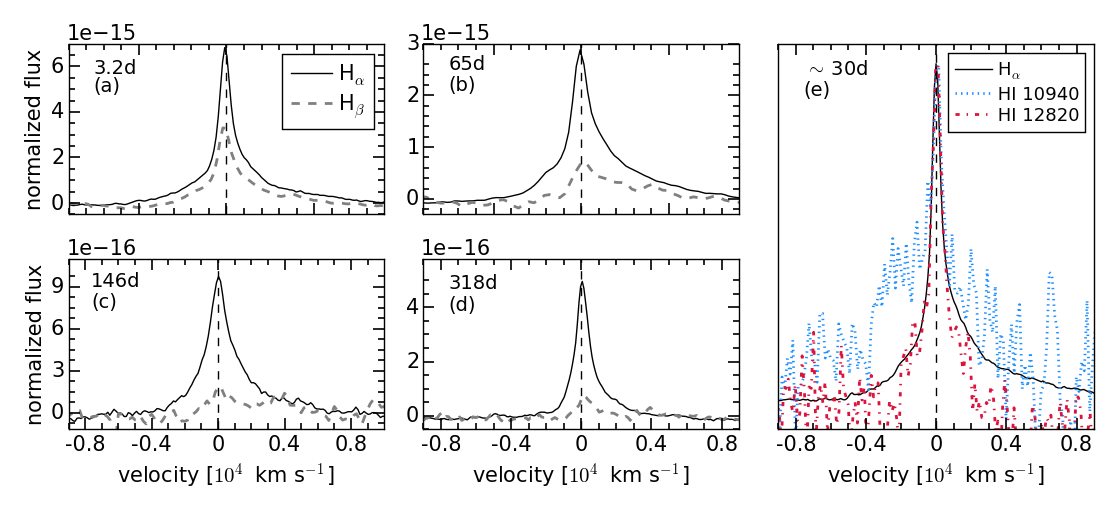
The NIR spectra of SNhunt151 (Fig. 6, lower panel) are dominated by the hydrogen Paschen series. A trace of Br and He i features may also be detected. In fact, comparing the profile of the strongest Paschen lines of our spectrum at phase d with H at a similar epoch (Fig. 9(e)), we can see how the Paschen line at 10940 is clearly blended with He i 10,830, while the line at 12,820 Å is similar to H but apparently without the broad red wing. As at optical wavelengths, no P-Cygni profiles are seen.
| Date | MJD | Phase | Temperaturea | FWHM | FWHMHα,inter | FWHMHα,br | LuminosityHα | EWHαc |
|---|---|---|---|---|---|---|---|---|
| (days) | (K) | (km s-1) | (km s-1) | (km s-1) | ( erg s-1) | |||
| 20130820 | 56524.20 | 47.6 | 8800 | 1020 (204) | 3600 (720) | 14,860 (2972) | 70 (10) | 300 (60) |
| 20130902 | 56537.18 | 34.7 | 8300 | 1070 (214) | 3400 (680) | 10,000 (2000) | 80 (12) | 240 (50) |
| 20130914 | 56549.01 | 22.8 | 9900 | 970 (194) | 4600 (920) | 13,300 (2660) | 75 (11) | 195 (40) |
| 20131010 | 56575.07 | 3.2 | 8600 | 650 (130) | 3600 (720) | 12,500 (2500) | 90 (13) | 190 (40) |
| 20131019 | 56584.31 | 12.5 | - | 430 (86) | 3150 (630) | 12,650 (2530) | 80 (11) | 200 (40) |
| 20131102 | 56598.05 | 26.2 | 8800 | 580 (116) | 3700 (740) | 16,800 (3360) | 90 (12) | 200 (40) |
| 20131107 | 56603.26 | 31.4 | 9000 | 450 (90) | 3400 (680) | 15,000 (3000) | 90 (12) | 220 (45) |
| 20131109 | 56605.39 | 33.5 | 8300 | 570 (114) | 3300 (660) | 16,000 (3200) | 90 (13) | 230 (45) |
| 20131112 | 56608.04 | 36.2 | 8600 | 390 (78) | 4100 (820) | 17,200 (3440) | 75 (11) | 260 (50) |
| 20131205 | 56631.07 | 59.2 | 9400 | 910 (182) | 3500 (700) | 13,900 (2780) | 60 (9) | 270 (50) |
| 20131211 | 56637.00 | 65.2 | 9950 | 980 (196) | 4000 (800) | 13,900 (2780) | 60 (9) | 290 (60) |
| 20131227 | 56653.85 | 82.0 | 8400 | 1220 (244) | 4200 (840) | 13,700 (2740) | 50 (7) | 280 (55) |
| 20140103 | 56660.87 | 89.0 | 7600 | 840 (168) | 3300 (660) | 12,300 (2460) | 40 (6) | 270 (55) |
| 20140301 | 56717.88 | 146.0 | - | 1070 (214) | 3000 (600) | 11,100 (2220) | 15 (3) | 285 (55) |
| 20140821 | 56890.19 | 318.3 | - | 1020 (204) | 3400 (680) | - | 5 (2) | 280 (55) |
| 20141115 | 56976.16 | 404.3 | - | 900 (180) | 2200 (440) | - | 3 (2) | 300 (60) |
a We consider a conservative uncertainty in the temperature of about 1000 K.
b We consider a conservative uncertainty in the velocities of about 20%.
c We consider a conservative uncertainty in the EW of about 20%.
4.2 Evolution of the Balmer Lines
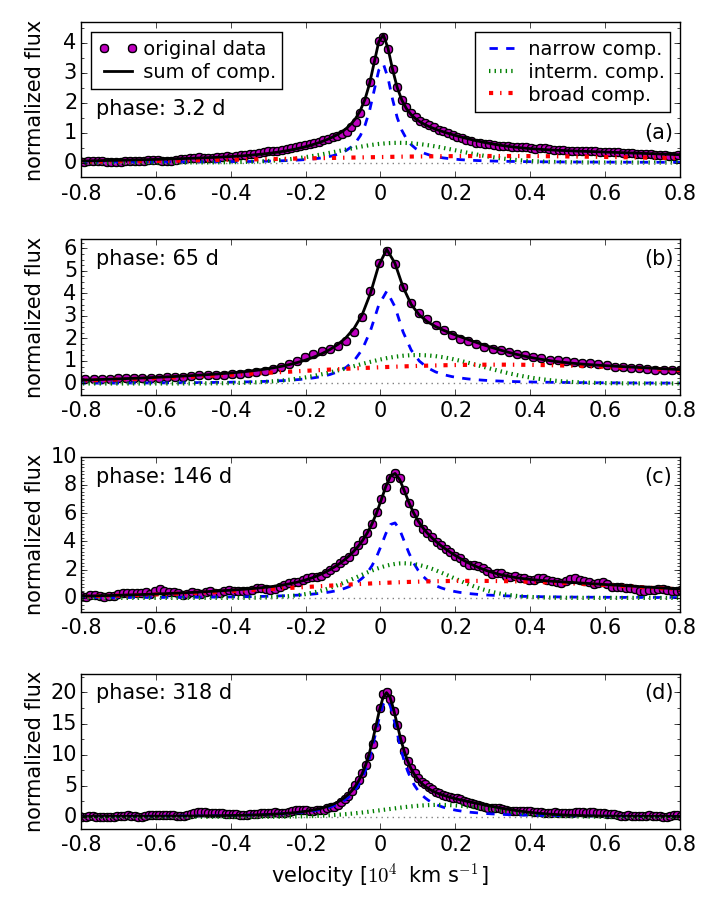
H is the most prominent line in the SNhunt151 spectra, and the analysis of its profile may allow us to probe the environment of the transient. As we can see in Figure 9, the H profile seems to consist of multiple components which do not show relative evolution with time. H exhibits a similar profile at earlier phases, but it is probably contaminated by iron lines at phases later than d. Following a procedure described by Elias-Rosa et al. 2016 for SN 2015bh, we decompose the line profile at all epochs into three emission components. We used a Lorentzian profile for the narrow component, and Gaussian functions for the intermediate and broad components, except for the two latest-time spectra in which there is no evidence for a broad component. Figure 10 displays the results of the multicomponent fit at some representative epochs: 3.2 d, 65 d, 146 d, and 318 d. The derived velocities are listed in Table 3, and their evolution is shown in Figure 8(c).
The FWHM of the narrow H emission999The narrow-line component was resolved in all spectra. We first corrected the measured FWHM for the spectral resolution, and then computed the velocity. remains nearly constant, with a velocity of km s-1 as determined from our highest-resolution spectra (–215 km s-1). The intermediate component, related to the shocked ejecta region between the forward shock and the reverse shock, also remains roughly constant with an average FWHM of km s-1. The broader component also exhibits an apparently constant evolution ( km s-1 FWHM), and then disappears in the last two spectra ( d).
The velocity of the broad component of H is high in comparison with the velocities of the H-rich material expelled in major eruptions of massive stars such as luminous blue variables (LBVs; e.g., Smith 2008; Pastorello et al. 2013a). It is more indicative of a SN explosion, but in this case the lack of evolution is rather puzzling. In fact, it is likely possible that the broad component is the Lorentzian wing of the narrow line, owing to electron scattering in the opaque CSM (e.g., Chugai 2001).
Interestingly, the total luminosity of the H line (Fig. 8(d), and Table 3) remains almost constant at erg s-1 until d, and decreases thereafter to erg s-1 in our last spectrum.
5 Discussion and Summary
In the previous sections, we analysed the observed properties of SNhunt151. This transient shows a slow rise of around 450 d, ranging from a -band absolute magnitude of approximately mag to mag, then followed by a major rebrightening which peaks at mag. Recent HST+WFC3 and GTC+OSIRIS images, taken around 3 yr after maximum, show a source at the position of SNhunt151 of mag in () and mag in . These late epochs do not follow the typical radioactive heating expected in SNe II, but instead indicate a shallower decline. During Event B, the spectra are always dominated by Balmer lines, and show negligible evolution.
As for other similar transients found in the last decade (e.g., SN 2009ip), it is arduous finding a unique interpretation for the chain of events of SNhunt151. As seen in previous sections, some observables of SNhunt151 could resemble those of the SN 2009ip-like transients. However, there are also significant differences, as follows.
-
(1)
No significant variability brighter than mag in the historical light curve (from the end of 2003 to the end of 2011).
-
(2)
Slow prediscovery rise (Event A).
-
(3)
Broad Event B with respect to other SN 2009ip-like transients.
-
(4)
Stronger ejecta-CSM interaction (or a thicker envelope) over its entire evolution.
-
(5)
No clear evidence of evolution in the temperature.
-
(6)
No evidence of P-Cygni profiles in the Balmer lines during the entire evolution, and in iron features until phase d.
A possible scenario is that during the outbursts, SNhunt151 is surrounded by a nebula or cocoon of material hiding the inner engine. In some respects, this resembles the case of the Homunculus Nebula around Carinae (e.g., Smith 2012). The nebula would enclose a recent event that can be almost anything, such as a collision between massive shells ejected by a very massive star, a merger event in a close binary system, or a terminal core-collapse SN explosion (either during Event A with the successive strong interaction of the SN ejecta and a circumstellar shell, or during Event B preceded by a giant eruption in Event A). One of the possible explanations for the lack of spectral evolution is that we are observing an asymmetric environment from an unfavorable orientation, where the more dense material conceals what is below.
Using the pseudobolometric luminosity, we attempt to constrain the total energy radiated by SNhunt151. We estimate an energy of erg during Event A, and erg during Event B. The latter radiated energy is comparable to that of SNe IIn such as SN 2011ht ( erg; Roming et al. 2012), or even the luminous SN 1998S ( erg; Liu et al. 2000; Fassia et al. 2000; Pozzo et al. 2004). These values are also similar to the high energy of other types of transients, such as the controversial SN 2009ip ( erg and erg for its respective events 2012a and 2012b; Margutti et al. 2014), or SN 1961V ( erg during the prepeak plateau, and erg during the major and brief peak; Bertola 1963, 1964, 1965, 1967). The “Great Eruption" of Carinae released a radiated energy of erg (e.g., Humphreys & Martin 2012); however, it is noteworthy that the eruption lasted 20 yr. Summarising, the amount of energy radiated during both Event A and Event B of SNhunt151 is not a conclusive argument to assess whether the object is a terminal event.
The main puzzle is Event A. Slow rising light curves have been previously seen in some Type IIn SNe, such as SN 2008iy (Miller et al., 2010), but with a luminosity at the peak which is a factor of 2.5 brighter than the maximum luminosity of SNhunt151 Event A. Given the SNhunt151 observables, it seems unavoidable that there is a considerable amount of opaque material between the engine and the observer. Thus, the diffusion of the photons through the material is slow. Following the relations reported by Ofek et al. 2013a, from the rise time of the possible SN explosion (i.e., from Event B of SNhunt151, d) we can estimate an upper limit to the amount of mass between the transient and us. Assuming as wind velocity the value inferred for the narrow H component during that rise ( km s-1), we derive a mass-loss rate M☉ yr-1. This value is comparable to that of LBV giant eruptions (e.g., Smith 2016).
One interesting comparison is with SN 1961V. As we see in Figure 11, the magnitude at the end of Event A of SNhunt151 is suggestively similar to that of the pseudoplateau shown by SN 1961V before its peak. The origin of this first event in SN 1961V depends on the interpretation. If SN 1961V was a true core-collapse SN (Smith et al., 2011; Kochanek et al., 2011), then the light curve could be a combination of a Type II-Plateau-like SN, followed by a peak arising from interaction of the SN ejecta with the CSM. Instead, if the SN 1961V is a SN impostor (e.g., Van Dyk & Matheson 2012a, b), the pre-peak event is due to a series of minor eruptions and interaction with the material previously ejected.
An argument against the interpretation of SN 1961V as a SN impostor is the lack of detectable mid-infrared (MIR) emission at the transient position, expected from the dust shell formed around surviving LBVs (Kochanek et al., 2011). A counterexample is Carinae, which is extremely luminous at IR wavelengths (e.g., Smith 2012).
Looking for some evidence of dust around SNhunt151, we inspected the Spitzer Space Telescope Heritage Archive101010http://sha.ipac.caltech.edu/applications/Spitzer/SHA/. after the transient discovery. We found images at four epochs: 2005 February 23 and 24 (3.6, 4.5, 5.8, and 8.0 m channels; Programme ID 3584, PI D. Padgett), 2014 November 27 (3.6 and 4.5 m channels; Programme ID 10139, PI O. D. Fox), and 2015 May 23 (3.6 and 4.5 m channels; Programme ID 11053, PI O. D. Fox), taken with the InfraRed Array Camera (IRAC) aboard Spitzer. We worked with the Post Basic Calibrated Data (pbcd), which are already fully coadded and calibrated. We did not detect a source at the SNhunt151 position in the first two epochs (year 2005); however, a source is well detected in the last two (years 2014 and 2015) in both Spitzer channels. We estimate the integrated flux of the source (in the observations of 2005 we use an aperture of pixels around the transient position) using MOPEX111111MOPEX is a Spitzer software package: http://irsa.ipac.caltech.edu/data/SPITZER/docs/dataanalysistools/tools/mopex/.. Following the “recipe” advised by the Spitzer team, we obtained the values reported in Table 4. The late-time NIR detections may suggest the formation of dust in a cool dense shell in SNhunt151, as in Carinae and other SNe IIn (e.g., Fox et al. 2011, 2013) or, alternatively, an IR echo produced by foreground, pre-existing dust.
In summary, here we have discussed our observations of a unique object, SNhunt151. Its nature is still uncertain, but we support the hypothesis that we are observing a dense nebula of material and dust at the position of the transient, which reprocesses radiation from the underlying energetic outburst and enshrouds the mechanism that gives rise to the chain of events. It is clear that we should still keep an eye on SNhunt151 in the future.
| Date | MJD | Phasea | 3.6 m | 4.5 m | 5.8 m | 8.0 m | Program ID/P.I. |
|---|---|---|---|---|---|---|---|
| (days) | (Jy) | (Jy) | (Jy) | (Jy) | |||
| 20050223 | 53424.87 | 3584/D. Padgett | |||||
| 20050224 | 53425.39 | 3584/D. Padgett | |||||
| 20141127 | 56988.00 | 416.2 | - | - | 10139/O. D. Fox | ||
| 20150523 | 57165.81 | 594.0 | - | - | 11053/O. D. Fox |
a Phases are relative to maximum light, MJD .

Acknowledgements
We thank S. Spiro, R. Rekola, A. Harutyunyan, and M. L. Graham for their help with the observations. We are grateful to the collaboration of Massimo Conti, Giacomo Guerrini, Paolo Rosi, and Luz Marina Tinjaca Ramirez from the Osservatorio Astronomico Provinciale di Montarrenti. The staffs at the different observatories provided excellent assistance with the observations.
The research leading to these results has received funding from the European Union Seventh Framework Programme (FP7/2007-2013) under grant agreement No. 267251, “Astronomy Fellowships in Italy” (AstroFIt).” N.E.-R. acknowledges financial support from MIUR PRIN 2010-2011, “The Dark Universe and the Cosmic Evolution of Baryons: From Current Surveys to Euclid." N.E.-R., A.P., S.B., L.T., M.T., and G.T are partially supported by the PRIN-INAF 2014 (project “Transient Universe: Unveiling New Types of Stellar Explosions with PESSTO”). G.P. acknowledges support provided by the Millennium Institute of Astrophysics (MAS) through grant IC120009 of the Programa Iniciativa Cientíifica Milenio del Ministerio de Economía, Fomento y Turismo de Chile. T.K. acknowledges financial support from the Emil Aaltonen Foundation. CRTS was supported by the NSF grants AST-0909182, AST-1313422, and AST-1413600. A.V.F. is grateful for generous financial assistance from the Christopher R. Redlich Fund, the TABASGO Foundation, the Miller Institute for Basic Research in Science (UC Berkeley), and NASA/HST grant GO-14668 from the Space Telescope Science Institute, which is operated by AURA, Inc. under NASA contract NAS5-26555. The work of A.V.F. was conducted in part at the Aspen Center for Physics, which is supported by NSF grant PHY-1607611; he thanks the Center for its hospitality during the neutron stars workshop in June and July 2017. N.E.-R. acknowledges the hospitality of the “Institut de Ciències de l’Espai" (CSIC), where this work was completed.
This research is based on observations made with the Nordic Optical Telescope, operated by the Nordic Optical Telescope Scientific Association at the Observatorio del Roque de los Muchachos, La Palma, Spain, of the Instituto de Astrofísica de Canarias; the Gran Telescopio Canarias (GTC), installed in the Spanish Observatorio del Roque de los Muchachos of the Instituto de Astrofísica de Canarias, on the island of La Palma; the Italian Telescopio Nazionale Galileo (TNG), operated on the island of La Palma by the Fundaci n Galileo Galilei of the INAF (Istituto Nazionale di Astrofisica) at the Spanish Observatorio del Roque de los Muchachos of the Instituto de Astrofísica de Canarias; the Liverpool Telescope, operated on the island of La Palma by Liverpool John Moores University in the Spanish Observatorio del Roque de los Muchachos of the Instituto de Astrofísica de Canarias with financial support from the UK Science and Technology Facilities Council; the 1.82-m Copernico Telescope and the Schmidt 67/92 cm of INAF-Asiago Observatory; the Catalina Real Time Survey (CRTS) Catalina Sky Survey (CSS) 0.7 m Schmidt Telescope; and the Las Cumbres Observatory (LCO) network. This work is also based in part on archival data obtained with the NASA/ESA Hubble Space Telescope, obtained from the Data Archive at the Space Telescope Science Institute (STScI), which is operated by the Association of Universities for Research in Astronomy (AURA), Inc., under NASA contract NAS5-26555; the Spitzer Space Telescope, which is operated by the Jet Propulsion Laboratory, California Institute of Technology, under a contract with NASA (support was provided by NASA through an award issued by JPL/Caltech); and the Swift telescope.
This work has made use of the NASA/IPAC Extragalactic Database (NED), which is operated by the Jet Propulsion Laboratory, California Institute of Technology, under contract with NASA.
References
- Anderson et al. (2014) Anderson J. P., et al., 2014, ApJ, 786, 67
- Benetti et al. (2016) Benetti S., et al., 2016, MNRAS, 456, 3296
- Bertola (1963) Bertola F., 1963, Contributions dell’Osservatorio Astrofisica dell’Universita di Padova in Asiago, 142, 3
- Bertola (1964) Bertola F., 1964, Annales d’Astrophysique, 27, 319
- Bertola (1965) Bertola F., 1965, Contributions dell’Osservatorio Astrofisica dell’Universita di Padova in Asiago, 171, 3
- Bertola (1967) Bertola F., 1967, Information Bulletin on Variable Stars, 196, 1
- Cardelli et al. (1989) Cardelli J. A., Clayton G. C., Mathis J. S., 1989, ApJ, 345, 245
- Chevalier & Irwin (2012) Chevalier R. A., Irwin C. M., 2012, ApJ, 747, L17
- Chonis & Gaskell (2008) Chonis T. S., Gaskell C. M., 2008, AJ, 135, 264
- Chugai (2001) Chugai N. N., 2001, MNRAS, 326, 1448
- Dolphin (2000) Dolphin A. E., 2000, PASP, 112, 1383
- Drake et al. (2009) Drake A. J., et al., 2009, ApJ, 696, 870
- Elias-Rosa (2007) Elias-Rosa N., 2007, in di Salvo T., Israel G. L., Piersant L., Burderi L., Matt G., Tornambe A., Menna M. T., eds, American Institute of Physics Conference Series Vol. 924, The Multicolored Landscape of Compact Objects and Their Explosive Origins. pp 395–400, doi:10.1063/1.2774886
- Elias-Rosa et al. (2013) Elias-Rosa N., et al., 2013, The Astronomer’s Telegram, 5521
- Elias-Rosa et al. (2016) Elias-Rosa N., et al., 2016, MNRAS, 463, 3894
- Fassia et al. (2000) Fassia A., et al., 2000, MNRAS, 318, 1093
- Foley et al. (2011) Foley R. J., Berger E., Fox O., Levesque E. M., Challis P. J., Ivans I. I., Rhoads J. E., Soderberg A. M., 2011, ApJ, 732, 32
- Fox et al. (2011) Fox O. D., et al., 2011, ApJ, 741, 7
- Fox et al. (2013) Fox O. D., Filippenko A. V., Skrutskie M. F., Silverman J. M., Ganeshalingam M., Cenko S. B., Clubb K. I., 2013, AJ, 146, 2
- Fraser et al. (2013) Fraser M., et al., 2013, MNRAS, 433, 1312
- Fraser et al. (2015) Fraser M., et al., 2015, MNRAS, 453, 3886
- Fuller (2017) Fuller J., 2017, MNRAS, 470, 1642
- Graham et al. (2017) Graham M. L., et al., 2017, MNRAS, 469, 1559
- Humphreys & Martin (2012) Humphreys R. M., Martin J. C., 2012, in Davidson K., Humphreys R. M., eds, Astrophysics and Space Science Library Vol. 384, Eta Carinae and the Supernova Impostors. p. 1, doi:10.1007/978-1-4614-2275-4_1
- Kankare et al. (2015) Kankare E., et al., 2015, A&A, 581, L4
- Kiewe et al. (2012) Kiewe M., et al., 2012, ApJ, 744, 10
- Kochanek et al. (2011) Kochanek C. S., Szczygiel D. M., Stanek K. Z., 2011, ApJ, 737, 76
- Liu et al. (2000) Liu Q.-Z., Hu J.-Y., Hang H.-R., Qiu Y.-L., Zhu Z.-X., Qiao Q.-Y., 2000, A&AS, 144, 219
- Margutti et al. (2014) Margutti R., et al., 2014, ApJ, 780, 21
- Mauerhan et al. (2013) Mauerhan J. C., et al., 2013, MNRAS, 430, 1801
- Maza et al. (2009) Maza J., et al., 2009, Central Bureau Electronic Telegrams, 1928, 1
- Miller et al. (2010) Miller A. A., et al., 2010, MNRAS, 404, 305
- Mould et al. (2000) Mould J. R., et al., 2000, ApJ, 529, 786
- Ofek et al. (2013a) Ofek E. O., et al., 2013a, Nature, 494, 65
- Ofek et al. (2013b) Ofek E. O., et al., 2013b, ApJ, 763, 42
- Ofek et al. (2014) Ofek E. O., et al., 2014, ApJ, 789, 104
- Ofek et al. (2016) Ofek E. O., et al., 2016, preprint, (arXiv:1605.02450)
- Pastorello et al. (2013a) Pastorello A., et al., 2013a, ApJ, 767, 1
- Pastorello et al. (2013b) Pastorello A., et al., 2013b, The Astronomer’s Telegram, 5358
- Pastorello et al. (2013c) Pastorello A., et al., 2013c, The Astronomer’s Telegram, 5359
- Pastorello et al. (2017) Pastorello A., et al., 2017, preprint, (arXiv:1707.00611)
- Phillips et al. (2013) Phillips M. M., et al., 2013, ApJ, 779, 38
- Poznanski et al. (2011) Poznanski D., Ganeshalingam M., Silverman J. M., Filippenko A. V., 2011, MNRAS, 415, L81
- Poznanski et al. (2012) Poznanski D., Prochaska J. X., Bloom J. S., 2012, MNRAS, 426, 1465
- Pozzo et al. (2004) Pozzo M., Meikle W. P. S., Fassia A., Geballe T., Lundqvist P., Chugai N. N., Sollerman J., 2004, MNRAS, 352, 457
- Quataert & Shiode (2012) Quataert E., Shiode J., 2012, MNRAS, 423, L92
- Roming et al. (2012) Roming P. W. A., et al., 2012, ApJ, 751, 92
- Schlafly & Finkbeiner (2011) Schlafly E. F., Finkbeiner D. P., 2011, ApJ, 737, 103
- Smith (2008) Smith N., 2008, Nature, 455, 201
- Smith (2012) Smith N., 2012, in Davidson K., Humphreys R. M., eds, Astrophysics and Space Science Library Vol. 384, Eta Carinae and the Supernova Impostors. p. 145, doi:10.1007/978-1-4614-2275-4_7
- Smith (2014) Smith N., 2014, ARA&A, 52, 487
- Smith (2016) Smith N., 2016, preprint, (arXiv:1612.02006)
- Smith & Arnett (2014) Smith N., Arnett W. D., 2014, ApJ, 785, 82
- Smith & Frew (2011) Smith N., Frew D. J., 2011, MNRAS, 415, 2009
- Smith et al. (2010) Smith N., et al., 2010, AJ, 139, 1451
- Smith et al. (2011) Smith N., Li W., Silverman J. M., Ganeshalingam M., Filippenko A. V., 2011, MNRAS, 415, 773
- Smith et al. (2012) Smith N., et al., 2012, MNRAS, 420, 1135
- Smith et al. (2014) Smith N., Mauerhan J. C., Prieto J. L., 2014, MNRAS, 438, 1191
- Taddia et al. (2013) Taddia F., et al., 2013, A&A, 555, A10
- Tartaglia et al. (2016) Tartaglia L., et al., 2016, MNRAS, 459, 1039
- Terreran et al. (2016) Terreran G., et al., 2016, MNRAS, 462, 137
- Thöne et al. (2017) Thöne C. C., et al., 2017, A&A, 599, A129
- Turatto et al. (2003) Turatto M., Benetti S., Cappellaro E., 2003, in Hillebrandt W., Leibundgut B., eds, From Twilight to Highlight: The Physics of Supernovae. p. 200 (arXiv:astro-ph/0211219), doi:10.1007/10828549_26
- Van Dyk & Matheson (2012a) Van Dyk S. D., Matheson T., 2012a, in Davidson K., Humphreys R. M., eds, Astrophysics and Space Science Library Vol. 384, Eta Carinae and the Supernova Impostors. p. 249, doi:10.1007/978-1-4614-2275-4_11
- Van Dyk & Matheson (2012b) Van Dyk S. D., Matheson T., 2012b, ApJ, 746, 179
- Van Dyk et al. (2000) Van Dyk S. D., Peng C. Y., King J. Y., Filippenko A. V., Treffers R. R., Li W., Richmond M. W., 2000, PASP, 112, 1532
Appendix A Properties of the supernovae used in this work.
| Object | Host Galaxy | Redshift | Distance† | max date | Sources | |
|---|---|---|---|---|---|---|
| (Mpc) | (mag) | (MJD) | ||||
| SN 1961V | NGC 1058 | 0.002 | 9.3 | 0.05 | 37641.0 | a |
| Car | - | 0.00008 | 0.0023 | 0.24 | b | |
| SN 1996al | NGC 7689 | 0.007 | 22.9 | 0.11 | 50265.0 | c |
| SN 2009ip | NGC 7259 | 0.006 | 25.0 | 0.02 | 56207.7 | d |
| SN 2015bh | NGC 2770 | 0.007 | 29.3 | 0.21 | 57166.9 | e |
| SNhunt248 | NGC 5806 | 0.005 | 21.9 | 0.05 | 56828.0‡ | f |
| SNhunt151 | UGC 3165 | 0.013 | 51.8 | 0.64 | 56571.8 | This work |
† Distances have been scaled to H0 = 73 km s-1 Mpc-1.
‡ This epoch corresponds to the “2014b” peak of SNhunt248.
Appendix B Tables of photometry and spectroscopy of SNhunt151
| Tables Code | Telescope | Instrument | Pixel Scale | Location |
|---|---|---|---|---|
| (arcsec pixel-1) | ||||
| AFOSC | 1.82 m Copernico Telescope | AFOSC | 0.52 | Mount Ekar, Asiago, Italy |
| ALFOSC | 2.56 m Nordic Optical Telescope | ALFOSC | 0.19 | Roque de Los Muchachos, La Palma, Canary Islands, Spain |
| Apogee | 0.53 m Ritchey-Chretien Telescope | Apogee | 1.17 | Osservatorio Astronomico Provinciale di Montarrenti, Siena, Italy |
| FLI-New | 0.50 m Newtonian Telescope | FLI Proline CCD | 2.32 | Osservatorio di Monte Agliale,Lucca, Italy |
| IO:O | 2.00 m Liverpool Telescope | IO:O | 0.30 | Roque de Los Muchachos, La Palma, Canary Islands, Spain |
| kb71 | 1.00 m-03 Telescope | kb71 | 0.47 | LCOGTa node at Siding Spring Observatory, Australia |
| kb77 | 1.00 m-04 Telescope | kb77 | 0.47 | LCOGT node at Cerro Tololo Inter-American Observatory, Chile |
| kb78 | 1.00 m-05 Telescope | kb78 | 0.47 | LCOGT node at Cerro Tololo Inter-American Observatory, Chile |
| kb74 | 1.00 m-08 Telescope | kb74 | 0.47 | LCOGT node at Cerro Tololo Inter-American Observatory, Chile |
| kb73 | 1.00 m-09 Telescope | kb73 | 0.47 | LCOGT node at Cerro Tololo Inter-American Observatory, Chile |
| kb70 | 1.00 m-10 Telescope | kb70 | 0.47 | LCOGT node at South African Astronomical Observatory, South Africa |
| kb05 | 1.00 m-11 Telescope | kb05 | 0.47 | LCOGT node at Siding Spring Observatory, Australia |
| kb75 | 1.00 m-12 Telescope | kb75 | 0.47 | LCOGT node at South African Astronomical Observatory, South Africa |
| kb79 | 1.00 m-13 Telescope | kb79 | 0.47 | LCOGT node at South African Astronomical Observatory, South Africa |
| kb76 | 1.00 m-13 Telescope | kb76 | 0.47 | LCOGT node at South African Astronomical Observatory, South Africa |
| LRS | 3.58 m Telescopio Nazionale Galileo | LRS | 0.25 | Roque de Los Muchachos, La Palma, Canary Islands, Spain |
| NOTCam | 2.56 m Nordic Optical Telescope | NOTCam | 0.24 | Roque de Los Muchachos, La Palma, Canary Islands, Spain |
| NICS | 3.58 m Telescopio Nazionale Galileo | NICS | 0.25 | Roque de Los Muchachos, La Palma, Canary Islands, Spain |
| OSIRIS | 10.4 m Gran Telescopio CANARIAS | OSIRIS | 0.25 | Roque de Los Muchachos, La Palma, Canary Islands, Spain |
| Palomar | 5.10 m Hale Telescope | DBSP | 0.39 | Palomar Observatory, California, USA |
| PTF | 1.20 m Samuel Oschin Telescope | CCD | 1.01 | Palomar Observatory, California, USA |
| RATCam | 2.00 m Liverpool Telescope | RATCam | 0.28 | Roque de Los Muchachos, La Palma, Canary Islands, Spain |
| SBIG | 0.67/0.92 m Schmidt Telescope | SBIG | 0.86 | Mount Ekar, Asiago, Italy |
| SDSS | 2.50 m Telescope | Sloan Digital Sky Survey CCD | 0.39 | Apache Point Observatory, New Mexico, USA |
| SI | 1.52 m Cassegrain reflector | SI 600-386 | 0.96 | Catalina Sky Survey node at Mount Lemmon Observatory, USA |
| SOAR | 4.10 m Southern Astrophysical Research Telescope | Goodman | 0.15 | Cerro Tololo Inter-American Observatory, Chile |
| Spitzer | 0.8-m Spitzer Space Telescipe | IRAC | 0.60 | - |
| T17FLI | 0.43 m iTelescope.Net T17 | FLI-New-Beta | 0.92 | Siding Spring Observatory, Australia |
| T18SBIG | 0.32 m iTelescope.Net T18 | SBIG STL-6303 3 CCD Camera | 0.63 | AstroCamp Observatory, Nerpio, Spain |
| T21FLI | 0.43 m iTelescope.Net T21 | FLI-New | 0.96 | Mayhill, New Mexico, USA |
| T7SBIG | 0.43 m iTelescope.Net T7 | SBIG STL-11000 3 CCD Camera | 0.73 | AstroCamp Observatory, Nerpio, Spain |
| T9SBIG | 0.32 m iTelescope.Net T9 | SBIG ST-8 3 CCD Camera | 0.80 | AstroCamp Observatory, Nerpio, Spain |
| WFC3 | 2.40 m Hubble Space Telescope | WFC3/UVIS | 0.04 | - |
a LCOGT = Las Cumbres Observatory Global Telescope Network.
| Date | MJD | Phasea | Instrument Key | ||||
|---|---|---|---|---|---|---|---|
| (days) | (mag) | (mag) | (mag) | (mag) | |||
| 20051028 | 53671.48 | -2900.4 | - | - | - | SI | |
| 20051227 | 53731.40 | -2840.4 | - | - | - | SI | |
| 20060125 | 53760.44 | -2811.4 | - | - | - | SI | |
| 20060126 | 53761.23 | -2810.6 | - | - | - | SI | |
| 20060202 | 53768.29 | -2803.6 | - | - | - | SI | |
| 20060303 | 53797.32 | -2774.5 | - | - | - | SI | |
| 20060928 | 54006.43 | -2565.4 | - | - | - | SI | |
| 20061020 | 54028.43 | -2543.4 | - | - | - | SI | |
| 20061101 | 54040.31 | -2531.5 | - | - | - | SI | |
| 20061217 | 54086.26 | -2485.6 | - | - | - | SI | |
| 20070207 | 54138.18 | -2433.7 | - | - | - | SI | |
| 20070313 | 54172.18 | -2399.7 | - | - | - | SI | |
| 20071016 | 54389.42 | -2182.4 | - | - | - | SI | |
| 20071215 | 54449.38 | -2122.5 | - | - | - | SI | |
| 20071231 | 54465.20 | -2106.7 | - | - | - | SI | |
| 20080112 | 54477.29 | -2094.6 | - | - | - | SI | |
| 20080207 | 54503.15 | -2068.7 | - | - | - | SI | |
| 20080312 | 54537.12 | -2034.7 | - | - | - | SI | |
| 20080404 | 54560.13 | -2011.7 | - | - | - | SI | |
| 20080928 | 54737.45 | -1834.4 | - | - | - | SI | |
| 20081130 | 54800.39 | -1771.5 | - | - | - | SI | |
| 20090120 | 54851.20 | -1720.7 | - | - | - | SI | |
| 20091017 | 55121.47 | -1450.4 | - | - | - | SI | |
| 20091109 | 55144.44 | -1427.4 | - | - | - | SI | |
| 20091111 | 55146.98 | -1424.9 | - | - | - | Apogee | |
| 20091210 | 55175.20 | -1396.7 | - | - | - | SI | |
| 20100107 | 55203.22 | -1368.6 | - | - | - | SI | |
| 20100220 | 55247.12 | -1324.7 | - | - | - | SI | |
| 20100319 | 55274.15 | -1297.7 | - | - | - | SI | |
| 20100906 | 55445.37 | -1126.5 | - | - | - | PTF | |
| 20101020 | 55489.99 | -1081.9 | - | - | - | Apogee | |
| 20101128 | 55528.31 | -1043.5 | - | - | - | SI | |
| 20101203 | 55533.33 | -1038.5 | - | - | - | SI | |
| 20101209 | 55539.98 | -1031.9 | - | - | - | Apogee | |
| 20101225 | 55555.26 | -1016.6 | - | - | - | SI | |
| 20110112 | 55573.08 | -998.8 | - | - | - | SI | |
| 20110127 | 55588.16 | -983.7 | - | - | - | SI | |
| 20110207 | 55599.21 | -972.6 | - | - | - | PTF | |
| 20110306 | 55626.12 | -945.7 | - | - | - | SI | |
| 20110326 | 55646.14 | -925.7 | - | - | - | SI | |
| 20111031 | 55865.11 | -706.7 | - | - | - | Apogee | |
| 20111117 | 55882.05 | -689.8 | - | - | - | Apogee | |
| 20111225 | 55920.18 | -651.7 | - | 21.75 (0.35) | - | - | SI |
| 20120117 | 55943.80 | -628.0 | - | - | - | Apogee | |
| 20120129 | 55955.13 | -616.7 | - | 21.68 (0.30) | - | - | SI |
| 20120217 | 55974.82 | -597.0 | - | - | - | Apogee | |
| 20120226 | 55983.79 | -588.1 | - | - | - | Apogee | |
| 20120314 | 56000.16 | -571.7 | - | 21.79 (0.40) | - | - | SI |
| 20120323 | 56009.17 | -562.7 | - | 21.69 (0.47) | - | - | SI |
| 20120925 | 56195.41 | -376.4 | - | 20.86 (0.21) | - | - | SI |
| 20120926 | 56196.42 | -375.4 | - | 20.81 (0.43) | - | - | T21FLI |
| 20121023 | 56223.10 | -348.8 | - | - | 19.57 (0.46) | - | Apogee |
| 20121107 | 56238.34 | -333.5 | - | 20.71 (0.19) | - | - | SI |
| 20121203 | 56264.18 | -307.7 | - | 20.64 (0.48) | - | - | SI |
| 20121208 | 56269.31 | -302.5 | - | 20.59 (0.19) | - | - | SI |
| 20121211 | 56272.98 | -298.9 | - | - | 19.33 (0.22) | - | Apogee |
| 20130106 | 56298.22 | -273.6 | - | 20.60 (0.20) | - | - | SI |
| 20130107 | 56303.91 | -267.9 | - | - | - | Apogee | |
| 20130113 | 56305.17 | -266.7 | - | 20.55 (0.21) | - | - | SI |
| 20130203 | 56326.74 | -245.1 | - | - | 19.21 (0.19) | - | Apogee |
| Date | MJD | Phasea | Instrument Key | ||||
|---|---|---|---|---|---|---|---|
| (days) | (mag) | (mag) | (mag) | (mag) | |||
| 20130223 | 56346.19 | -225.7 | - | 20.50 (0.24) | - | - | SI |
| 20130818 | 56522.14 | -49.7 | - | - | 17.93 (0.33) | - | FLI-New |
| 20130819 | 56523.11 | -48.7 | - | - | 17.91 (0.28) | - | FLI-New |
| 20130820 | 56524.17 | -47.7 | - | - | 17.87 (0.24) | - | LRS |
| 20130821 | 56525.06 | -46.8 | 19.39 (0.24) | 18.54 (0.13) | 17.72 (0.09) | 17.40 (0.09) | SBIG |
| 20130821 | 56525.43 | -46.4 | 19.35 (0.12) | 18.41 (0.07) | - | - | kb74 |
| 20130822 | 56526.10 | -45.8 | 19.31 (0.24) | 18.50 (0.20) | 17.67 (0.11) | 17.31 (0.09) | SBIG |
| 20130822 | 56526.44 | -45.4 | 19.34 (0.11) | 18.40 (0.05) | - | - | kb74 |
| 20130824 | 56528.79 | -43.1 | 19.25 (0.17) | 18.50 (0.08) | - | - | kb71 |
| 20130825 | 56529.40 | -42.4 | 19.22 (0.09) | 18.41 (0.06) | - | - | kb78 |
| 20130828 | 56532.39 | -39.5 | 19.02 (0.08) | 18.30 (0.04) | - | - | kb73 |
| 20130901 | 56536.08 | -35.8 | 18.87 (0.12) | 18.08 (0.06) | 17.29 (0.08) | 16.93 (0.12) | AFOSC |
| 20130905 | 56540.16 | -31.7 | - | - | 17.39 (0.20) | - | Apogee |
| 20130905 | 56540.39 | -31.5 | - | 18.04 (0.19) | - | - | T21FLI |
| 20130906 | 56541.46 | -30.4 | 18.89 (0.05) | 18.06 (0.04) | - | - | kb74 |
| 20130907 | 56542.44 | -29.4 | 18.83 (0.06) | 17.99 (0.04) | - | - | kb74 |
| 20130913 | 56548.18 | -23.7 | 18.68 (0.04) | 17.93 (0.03) | - | - | IO:O |
| 20130913 | 56548.43 | -23.4 | 18.69 (0.05) | 17.88 (0.04) | - | - | kb74 |
| 20130914 | 56549.43 | -22.4 | 18.62 (0.04) | 17.82 (0.03) | - | - | kb74 |
| 20130922 | 56557.12 | -14.7 | - | - | 16.94 (0.18) | - | Apogee |
| 20130924 | 56559.08 | -12.8 | 18.35 (0.03) | 17.56 (0.04) | - | - | kb70 |
| 20130925 | 56560.39 | -11.5 | 18.32 (0.06) | 17.52 (0.04) | - | - | kb74 |
| 20130926 | 56561.39 | -10.5 | 18.27 (0.05) | 17.52 (0.04) | - | - | kb74 |
| 20130928 | 56563.33 | -8.5 | 18.28 (0.04) | 17.49 (0.04) | - | - | kb78 |
| 20131001 | 56566.20 | -5.7 | 18.22 (0.06) | 17.47 (0.04) | - | - | IO:O |
| 20131006 | 56571.21 | -0.6 | 18.23 (0.03) | 17.46 (0.04) | - | - | IO:O |
| 20131007 | 56572.29 | 0.4 | 18.22 (0.04) | 17.45 (0.04) | - | - | kb73 |
| 20131008 | 56573.46 | 1.6 | - | 17.43 (0.22) | - | - | T21FLI |
| 20131009 | 56574.06 | 2.2 | 18.22 (0.05) | 17.46 (0.05) | - | - | kb70 |
| 20131010 | 56575.15 | 3.3 | - | 17.41 (0.24) | - | - | T18SBIG |
| 20131011 | 56576.77 | 4.9 | - | - | 16.90 (0.18) | - | T17FLI |
| 20131012 | 56577.35 | 5.5 | 18.23 (0.05) | 17.43 (0.02) | - | - | kb78 |
| 20131014 | 56579.03 | 7.2 | 18.24 (0.04) | 17.44 (0.04) | - | - | kb70 |
| 20131014 | 56579.10 | 7.2 | - | 17.49 (0.18) | - | - | T18SBIG |
| 20131017 | 56582.04 | 10.2 | 18.33 (0.06) | 17.53 (0.04) | - | - | kb75 |
| 20131017 | 56582.44 | 10.6 | - | 17.51 (0.18) | - | - | T21FLI |
| 20131019 | 56584.68 | 12.8 | - | - | 16.98 (0.21) | - | T17FLI |
| 20131020 | 56585.04 | 13.2 | 18.36 (0.05) | 17.56 (0.04) | - | - | kb70 |
| 20131024 | 56589.68 | 17.8 | - | - | 17.10 (0.31) | - | T17FLI |
| 20131026 | 56591.35 | 19.5 | 18.61 (0.05) | 17.80 (0.05) | - | - | kb73 |
| 20131026 | 56591.63 | 19.8 | - | 17.86 (0.24) | - | - | T9SBIG |
| 20131026 | 56591.67 | 19.8 | - | - | 17.09 (0.16) | - | T17FLI |
| 20131028 | 56593.09 | 21.2 | - | 17.77 (0.13) | - | - | T18SBIG |
| 20131028 | 56593.38 | 21.5 | - | 17.83 (0.08) | 17.06 (0.05) | - | T21FLI |
| 20131030 | 56595.04 | 23.2 | - | - | 17.26 (0.16) | - | T17FLI |
| 20131030 | 56595.21 | 23.4 | 18.68 (0.04) | 17.89 (0.04) | - | - | IO:O |
| 20131101 | 56597.08 | 25.2 | - | - | 17.14 (0.18) | - | Apogee |
| 20131102 | 56598.50 | 26.7 | 18.86 (0.05) | 17.99 (0.04) | - | - | kb74 |
| 20131104 | 56600.99 | 29.1 | 18.89 (0.06) | 18.01 (0.05) | - | - | kb75 |
| 20131104 | 56601.00 | 29.1 | 18.84 (0.05) | 18.04 (0.04) | - | - | kb75 |
| 20131105 | 56601.10 | 29.2 | 18.86 (0.04) | 18.04 (0.04) | - | - | IO:O |
| 20131107 | 56603.04 | 31.2 | 18.91 (0.04) | 18.05 (0.02) | - | - | IO:O |
| 20131107 | 56603.10 | 31.2 | 18.84 (0.07) | 18.10 (0.05) | 17.20 (0.07) | 16.80 (0.04) | SBIG |
| 20131107 | 56603.42 | 31.6 | - | 18.03 (0.16) | - | - | T21FLI |
| 20131108 | 56604.24 | 32.4 | 18.93 (0.05) | 18.06 (0.03) | - | - | kb78 |
| 20131111 | 56607.25 | 35.4 | 19.01 (0.06) | 18.17 (0.04) | - | - | kb77 |
| 20131111 | 56607.28 | 35.4 | 19.04 (0.06) | 18.18 (0.04) | - | - | kb78 |
| 20131112 | 56608.12 | 36.3 | - | 18.15 (0.21) | - | - | T18SBIG |
| 20131112 | 56608.89 | 37.0 | 18.92 (0.07) | 18.25 (0.07) | 17.26 (0.07) | 16.89 (0.07) | SBIG |
| 20131113 | 56609.01 | 37.2 | - | 18.17 (0.08) | 17.28 (0.07) | - | T7SBIG |
| Date | MJD | Phasea | Instrument Key | ||||
|---|---|---|---|---|---|---|---|
| (days) | (mag) | (mag) | (mag) | (mag) | |||
| 20131115 | 56611.08 | 39.2 | 19.06 (0.06) | 18.25 (0.04) | - | - | IO:O |
| 20131115 | 56611.19 | 39.3 | 19.11 (0.08) | 18.22 (0.04) | - | - | kb78 |
| 20131117 | 56613.25 | 41.4 | 19.25 (0.13) | 18.32 (0.06) | - | - | kb78 |
| 20131120 | 56616.29 | 44.4 | 19.22 (0.11) | 18.49 (0.08) | - | - | kb78 |
| 20131122 | 56618.05 | 46.2 | 19.36 (0.04) | 18.49 (0.03) | - | - | IO:O |
| 20131122 | 56618.96 | 47.1 | 19.35 (0.07) | 18.57 (0.06) | - | - | kb79 |
| 20131124 | 56620.98 | 49.1 | 19.41 (0.04) | 18.57 (0.03) | - | - | IO:O |
| 20131126 | 56622.04 | 50.2 | - | - | 17.66 (0.21) | - | Apogee |
| 20131126 | 56622.99 | 51.1 | 19.48 (0.04) | 18.61 (0.04) | - | - | IO:O |
| 20131127 | 56623.14 | 51.3 | 19.55 (0.07) | 18.60 (0.06) | - | - | kb78 |
| 20131129 | 56625.04 | 53.2 | 19.50 (0.04) | 18.64 (0.03) | - | - | IO:O |
| 20131129 | 56625.18 | 53.3 | 19.59 (0.05) | 18.63 (0.04) | - | - | kb78 |
| 20131202 | 56628.54 | 56.7 | 19.57 (0.07) | 18.74 (0.04) | - | - | kb05 |
| 20131202 | 56628.96 | 57.1 | - | 18.70 (0.13) | 17.84 (0.10) | - | T7SBIG |
| 20131203 | 56629.95 | 58.1 | - | - | 17.99 (0.25) | - | Apogee |
| 20131206 | 56632.00 | 60.2 | - | - | - | 17.59 (0.21) | AFOSC |
| 20131207 | 56633.00 | 61.2 | - | 18.81 (0.20) | - | - | T7SBIG |
| 20131208 | 56634.14 | 62.3 | 19.77 (0.07) | 18.86 (0.05) | - | - | kb74 |
| 20131208 | 56634.97 | 63.1 | - | - | 18.00 (0.24) | - | Apogee |
| 20131210 | 56636.32 | 64.5 | 19.86 (0.06) | 18.89 (0.05) | - | - | kb74 |
| 20131214 | 56640.33 | 68.5 | 19.99 (0.16) | 18.99 (0.13) | - | - | kb74 |
| 20131217 | 56643.97 | 72.1 | - | - | 18.36 (0.30) | - | Apogee |
| 20131222 | 56648.47 | 76.6 | 20.13 (0.18) | 19.16 (0.07) | - | - | kb71 |
| 20131223 | 56649.76 | 77.9 | - | 19.25 (0.26) | 18.31 (0.12) | - | T7SBIG |
| 20131225 | 56651.92 | 80.1 | 20.21 (0.13) | 19.22 (0.05) | - | - | kb75 |
| 20140101 | 56658.93 | 87.1 | - | - | 18.66 (0.20) | - | Apogee |
| 20140102 | 56659.97 | 88.1 | 20.38 (0.07) | 19.36 (0.04) | - | - | IO:O |
| 20140103 | 56660.96 | 89.1 | 20.42 (0.04) | 19.43 (0.04) | 18.50 (0.03) | 18.11 (0.05) | LRS |
| 20140104 | 56661.96 | 90.1 | 20.45 (0.04) | 19.40 (0.03) | - | - | IO:O |
| 20140106 | 56663.91 | 92.1 | - | - | 18.79 (0.37) | - | Apogee |
| 20140107 | 56664.89 | 93.0 | 20.54 (0.36) | 19.58 (0.09) | 18.59 (0.04) | 18.26 (0.09) | AFOSC |
| 20140107 | 56664.93 | 93.1 | 20.55 (0.32) | 19.52 (0.09) | - | - | IO:O |
| 20140117 | 56674.33 | 102.5 | 20.61 (0.30) | 19.78 (0.28) | - | - | kb74 |
| 20140121 | 56678.84 | 107.0 | 20.73 (0.23) | 19.78 (0.13) | 18.89 (0.47) | 18.42 (0.17) | SBIG |
| 20140125 | 56682.74 | 110.9 | 20.75 (0.23) | 19.86 (0.10) | 18.95 (0.05) | 18.68 (0.15) | AFOSC |
| 20140126 | 56683.76 | 111.9 | - | - | 19.11 (0.31) | - | Apogee |
| 20140128 | 56685.45 | 113.6 | 20.99 (0.25) | 19.84 (0.07) | - | - | kb71 |
| 20140128 | 56685.92 | 114.1 | 20.89 (0.09) | 19.98 (0.07) | - | - | IO:O |
| 20140131 | 56688.44 | 116.6 | 21.18 (0.32) | 20.02 (0.09) | - | - | kb71 |
| 20140202 | 56690.80 | 119.0 | 20.95 (0.42) | 20.20 (0.10) | - | - | kb70 |
| 20140205 | 56693.91 | 122.1 | 21.14 (0.10) | 20.18 (0.05) | - | - | IO:O |
| 20140206 | 56694.72 | 122.9 | - | - | 19.14 (0.45) | - | Apogee |
| 20140207 | 56695.43 | 123.6 | 21.05 (0.33) | 20.35 (0.14) | - | - | kb05 |
| 20140208 | 56696.44 | 124.6 | - | 20.20 (0.33) | - | - | kb71 |
| 20140211 | 56699.86 | 128.0 | 21.14 (0.10) | 20.25 (0.09) | - | - | IO:O |
| 20140214 | 56702.86 | 131.0 | 20.98 (0.25) | 20.25 (0.20) | - | - | IO:O |
| 20140301 | 56717.86 | 146.0 | 21.79 (0.08) | 20.52 (0.05) | 19.55 (0.05) | 19.07 (0.04) | LRS |
| 20140302 | 56718.77 | 146.9 | - | - | 19.39 (0.28) | - | Apogee |
| 20140330 | 56746.85 | 175.0 | - | 21.02 (0.43) | 20.34 (0.33) | 19.73 (0.33) | AFOSC |
| 20140330 | 56746.85 | 175.0 | - | - | - | AFOSC | |
| 20140805 | 56874.21 | 302.4 | 23.38 (0.17) | 21.96 (0.07) | 21.03 (0.09) | 20.83 (0.09) | ALFOSC |
| 20140825 | 56894.20 | 322.3 | 23.24 (0.11) | 22.12 (0.08) | 21.14 (0.06) | 21.01 (0.09) | ALFOSC |
| 20140918 | 56918.20 | 346.3 | 23.36 (0.14) | 22.34 (0.10) | 21.37 (0.12) | 21.16 (0.15) | ALFOSC |
| 20141013 | 56943.21 | 371.4 | 23.33 (0.27) | 22.55 (0.19) | 21.67 (0.20) | 21.23 (0.25) | ALFOSC |
| 20141027 | 56957.27 | 385.4 | 23.54 (0.14) | 22.62 (0.07) | 21.64 (0.10) | 21.27 (0.18) | ALFOSC |
| 20141112 | 56973.20 | 401.4 | 23.38 (0.20) | 22.76 (0.13) | 21.64 (0.14) | 21.09 (0.14) | ALFOSC |
| 20141124 | 56986.01 | 414.2 | 23.63 (0.12) | 22.63 (0.08) | 21.65 (0.11) | 21.21 (0.13) | ALFOSC |
| 20150124 | 57046.87 | 475.0 | - | - | 22.02 (0.24) | - | ALFOSC |
| 20150310 | 57091.94 | 520.1 | - | - | 22.11 (0.19) | - | ALFOSC |
| 20150806 | 57240.20 | 668.3 | - | - | - | ALFOSC | |
| 20161023 | 57684.97 | 1113.1 | - | 23.24 (0.02) | - | 21.95 (0.01) | WFC3 |
a Phases are relative to maximum light, MJD .
| Date | MJD | Phasea | Instrument Key | |||||
|---|---|---|---|---|---|---|---|---|
| (days) | (mag) | (mag) | (mag) | (mag) | (mag) | |||
| 20031221 | 52994.50 | -3577.4 | SDSS | |||||
| 20110207 | 55599.14 | -972.7 | - | - | - | - | PTF | |
| 20110208 | 55600.13 | -971.7 | - | - | - | - | PTF | |
| 20130821 | 56525.44 | -46.4 | - | 18.96 (0.06) | 17.93 (0.05) | 17.66 (0.04) | - | kb74 |
| 20130822 | 56526.45 | -45.4 | - | 18.95 (0.04) | 17.87 (0.04) | 17.64 (0.04) | - | kb74 |
| 20130824 | 56528.80 | -43.0 | - | 18.95 (0.08) | 17.82 (0.05) | 17.64 (0.04) | - | kb71 |
| 20130825 | 56529.42 | -42.4 | - | 18.88 (0.05) | 17.81 (0.04) | 17.60 (0.04) | - | kb78 |
| 20130828 | 56532.42 | -39.4 | - | - | 17.68 (0.04) | 17.43 (0.02) | - | kb73 |
| 20130830 | 56534.17 | -37.7 | - | - | 17.62 (0.03) | 17.42 (0.02) | - | RATCam |
| 20130906 | 56541.47 | -30.4 | - | 18.45 (0.03) | 17.50 (0.04) | 17.29 (0.04) | - | kb74 |
| 20130907 | 56542.46 | -29.4 | - | 18.46 (0.05) | 17.43 (0.04) | 17.27 (0.04) | - | kb74 |
| 20130913 | 56548.18 | -23.7 | 19.29 (0.06) | - | 17.42 (0.03) | 17.26 (0.02) | - | IO:O |
| 20130914 | 56549.46 | -22.4 | - | 18.17 (0.03) | 17.28 (0.02) | 17.05 (0.02) | - | kb74 |
| 20130924 | 56559.10 | -12.8 | - | 17.93 (0.04) | 17.00 (0.03) | 16.78 (0.03) | - | kb70 |
| 20130925 | 56560.42 | -11.4 | - | 17.86 (0.03) | 16.95 (0.04) | 16.72 (0.03) | - | kb74 |
| 20130926 | 56561.42 | -10.4 | - | 17.89 (0.02) | 16.98 (0.03) | 16.74 (0.02) | - | kb74 |
| 20130928 | 56563.36 | -8.5 | - | 17.91 (0.02) | 16.93 (0.03) | 16.68 (0.02) | - | kb78 |
| 20131001 | 56566.20 | -5.7 | 18.78 (0.11) | - | 16.90 (0.03) | 16.73 (0.03) | - | IO:O |
| 20131006 | 56571.21 | -0.6 | 18.83 (0.05) | 17.84 (0.02) | 16.87 (0.03) | 16.72 (0.02) | - | IO:O |
| 20131007 | 56572.30 | 0.5 | - | 17.81 (0.05) | 16.86 (0.04) | 16.67 (0.04) | - | kb73 |
| 20131009 | 56574.07 | 2.2 | - | 17.79 (0.03) | 16.87 (0.03) | 16.68 (0.03) | - | kb70 |
| 20131012 | 56577.36 | 5.5 | - | 17.79 (0.02) | 16.86 (0.03) | 16.64 (0.02) | - | kb78 |
| 20131014 | 56579.04 | 7.2 | - | 17.84 (0.03) | 16.91 (0.03) | 16.66 (0.03) | - | kb70 |
| 20131017 | 56582.05 | 10.2 | - | 17.90 (0.03) | 16.95 (0.02) | 16.70 (0.03) | - | kb75 |
| 20131020 | 56585.07 | 13.2 | - | 17.91 (0.12) | - | 16.76 (0.16) | - | kb70 |
| 20131026 | 56591.32 | 19.5 | - | 18.18 (0.04) | 17.19 (0.02) | 16.97 (0.02) | 16.79 (0.06) | kb73 |
| 20131030 | 56595.21 | 23.4 | 19.49 (0.12) | 18.31 (0.03) | 17.22 (0.03) | 17.09 (0.03) | - | IO:O |
| 20131102 | 56598.68 | 26.8 | - | 18.44 (0.03) | 17.29 (0.03) | 17.17 (0.03) | 16.90 (0.05) | kb71 |
| 20131105 | 56601.10 | 29.2 | 19.70 (0.10) | 18.47 (0.03) | 17.32 (0.02) | 17.24 (0.03) | - | IO:O |
| 20131105 | 56601.24 | 29.4 | - | 18.48 (0.03) | 17.34 (0.05) | 17.21 (0.03) | 16.99 (0.05) | kb73 |
| 20131107 | 56603.04 | 31.2 | 19.73 (0.12) | 18.52 (0.03) | 17.34 (0.03) | 17.27 (0.04) | - | IO:O |
| 20131108 | 56604.30 | 32.5 | - | 18.56 (0.03) | 17.38 (0.03) | 17.24 (0.02) | 17.02 (0.04) | kb78 |
| 20131111 | 56607.26 | 35.4 | - | 18.60 (0.02) | 17.48 (0.02) | 17.30 (0.04) | 17.09 (0.07) | kb77 |
| 20131112 | 56608.43 | 36.6 | - | 18.65 (0.03) | 17.48 (0.03) | 17.33 (0.03) | 17.12 (0.06) | kb74 |
| 20131115 | 56611.08 | 39.2 | 20.12 (0.15) | 18.64 (0.04) | 17.53 (0.03) | 17.46 (0.03) | - | IO:O |
| 20131116 | 56612.25 | 40.4 | - | 18.75 (0.03) | 17.55 (0.03) | 17.45 (0.02) | - | kb77 |
| 20131117 | 56613.21 | 41.4 | - | 18.67 (0.12) | - | 17.52 (0.22) | 17.29 (0.10) | kb77 |
| 20131120 | 56616.22 | 44.4 | - | 18.82 (0.08) | 17.67 (0.04) | 17.57 (0.05) | 17.34 (0.08) | kb73 |
| 20131122 | 56618.04 | 46.2 | 20.39 (0.09) | 18.93 (0.02) | 17.73 (0.02) | 17.70 (0.02) | - | IO:O |
| 20131123 | 56619.16 | 47.3 | - | 18.96 (0.04) | 17.69 (0.03) | 17.76 (0.04) | 17.46 (0.05) | kb73 |
| 20131124 | 56620.97 | 49.1 | 20.45 (0.06) | 18.95 (0.03) | 17.76 (0.03) | 17.75 (0.03) | - | IO:O |
| 20131126 | 56622.23 | 50.4 | - | 19.02 (0.04) | 17.80 (0.04) | 17.77 (0.03) | 17.59 (0.06) | kb77 |
| 20131126 | 56622.99 | 51.1 | 20.52 (0.10) | 19.07 (0.03) | 17.81 (0.02) | 17.76 (0.03) | - | IO:O |
| 20131129 | 56625.04 | 53.2 | 20.56 (0.06) | 19.11 (0.03) | 17.86 (0.03) | 17.83 (0.03) | - | IO:O |
| 20131130 | 56626.20 | 54.3 | - | 19.13 (0.03) | 17.86 (0.03) | 17.80 (0.02) | 17.67 (0.06) | kb78 |
| 20131202 | 56628.56 | 56.7 | - | 19.23 (0.04) | 17.95 (0.03) | 17.86 (0.04) | 17.73 (0.10) | kb05 |
| 20131214 | 56640.15 | 68.3 | - | 19.54 (0.09) | 18.30 (0.05) | 18.22 (0.04) | 18.04 (0.09) | kb77 |
| 20131222 | 56648.08 | 76.2 | - | 19.71 (0.04) | 18.41 (0.04) | 18.36 (0.04) | - | kb77 |
| 20131225 | 56651.88 | 80.0 | - | 19.76 (0.03) | 18.46 (0.04) | 18.41 (0.04) | - | kb75 |
| 20140102 | 56659.96 | 88.1 | 21.47 (0.18) | 19.94 (0.03) | 18.54 (0.03) | 18.56 (0.04) | - | IO:O |
| 20140104 | 56661.96 | 90.1 | 21.54 (0.15) | 19.99 (0.03) | 18.58 (0.02) | 18.59 (0.02) | - | IO:O |
| 20140107 | 56664.93 | 93.1 | - | 20.04 (0.06) | 18.63 (0.03) | 18.67 (0.04) | - | IO:O |
| 20140116 | 56673.34 | 101.5 | - | 20.29 (0.33) | 18.70 (0.10) | 18.77 (0.17) | - | kb74 |
| 20140121 | 56678.85 | 107.0 | - | - | 18.97 (0.04) | 18.89 (0.04) | - | kb70 |
| 20140128 | 56685.43 | 113.6 | - | - | 19.06 (0.04) | 19.05 (0.05) | - | kb71 |
| 20140128 | 56685.92 | 114.1 | 21.89 (0.34) | 20.54 (0.07) | 19.11 (0.06) | 19.08 (0.16) | - | IO:O |
| 20140204 | 56692.81 | 121.0 | - | - | 19.20 (0.09) | 19.27 (0.20) | - | kb76 |
| 20140205 | 56693.91 | 122.1 | 22.25 (0.35) | 20.78 (0.06) | 19.23 (0.03) | 19.28 (0.03) | - | IO:O |
| 20140207 | 56695.45 | 123.6 | - | - | 19.24 (0.07) | 19.31 (0.07) | - | kb71 |
| 20140208 | 56696.42 | 124.6 | - | - | 19.28 (0.10) | 19.38 (0.19) | - | kb05 |
| Date | MJD | Phasea | Instrument Key | |||||
|---|---|---|---|---|---|---|---|---|
| (days) | (mag) | (mag) | (mag) | (mag) | (mag) | |||
| 20140211 | 56699.86 | 128.0 | - | 20.83 (0.07) | 19.36 (0.04) | 19.42 (0.07) | - | IO:O |
| 20140214 | 56702.86 | 131.0 | - | 20.75 (0.19) | 19.38 (0.07) | 19.44 (0.08) | - | IO:O |
| 20140215 | 56703.21 | 131.4 | - | - | 19.42 (0.22) | 19.27 (0.32) | - | kb74 |
| 20140301 | 56717.86 | 146.0 | - | 21.21 (0.04) | 19.71 (0.03) | 19.69 (0.06) | - | LRS |
| 20140821 | 56890.19 | 318.3 | - | - | 21.59 (0.17) | - | - | OSIRIS |
| 20140824 | 56893.21 | 321.4 | - | 22.66 (0.06) | 21.37 (0.11) | 21.12 (0.11) | - | OSIRIS |
| 20141115 | 56976.15 | 404.3 | - | 23.03 (0.25) | - | - | - | OSIRIS |
| 20141124 | 56985.21 | 413.4 | - | 22.39 (0.22) | 22.33 (0.44) | - | OSIRIS | |
| 20161207 | 57729.02 | 1157.2 | - | - | - | - | AFOSC | |
| 20170123 | 57776.91 | 1205.1 | - | - | - | - | AFOSC | |
| 20170216 | 57800.96 | 1229.1 | - | 24.36 (0.19) | 23.26 (0.10) | 23.17 (0.12) | - | OSIRIS |
a Phases are relative to maximum light, MJD = 56571.8 1.0.
| Date | MJD | Phasea | Instrument Key | |||
|---|---|---|---|---|---|---|
| (days) | (mag) | (mag) | (mag) | |||
| 20131105 | 56600.08 | 28.2 | 15.77 (0.28) | 15.48 (0.20) | 15.16 (0.28) | NICS |
| 20131119 | 56614.06 | 42.2 | 16.09 (0.26) | 15.81 (0.26) | 15.24 (0.28) | NICS |
| 20131125 | 56621.04 | 49.2 | 16.18 (0.27) | 16.00 (0.19) | 15.39 (0.31) | NOTCam |
| 20131127 | 56622.15 | 50.3 | 16.24 (0.14) | 16.02 (0.22) | 15.45 (0.31) | NICS |
| 20131217 | 56643.07 | 71.2 | 16.85 (0.38) | 16.44 (0.22) | 15.94 (0.56) | NOTCam |
| 20131223 | 56648.97 | 77.1 | 16.96 (0.32) | 16.59 (0.26) | 16.09 (0.27) | NICS |
| 20140116 | 56673.94 | 102.1 | - | - | 16.66 (0.23) | NOTCam |
| 20140212 | 56700.93 | 129.1 | 17.85 (0.29) | 17.47 (0.27) | 17.07 (0.28) | NOTCam |
| 20140314 | 56730.87 | 159.0 | 18.24 (0.17) | 17.98 (0.20) | 17.35 (0.23) | NOTCam |
a Phases are relative to maximum light, MJD .
| Date | MJD | Phasea | Instrumental Setup | Grism/Grating+Slit | Spectral Range | Resolution |
| (Å) | (Å) | |||||
| 20130820 | 56524.20 | TNG+LRS | LR-B+ | 3750–7850 | 12 | |
| 20130902 | 56537.18 | TNG+LRS | LR-B+ | 3750–7850 | 12 | |
| 20130914 | 56549.01 | Ekar1.82m+AFOSC | gm4+VPH6+ | 3800–8500 | 13.5/15 | |
| 20131010 | 56575.07 | 3.2 | TNG+LRS | LR-B+ | 3750–7800 | 12 |
| 20131019 | 56584.31 | 12.5 | SOAR+Goodman | KOSI 600+ | 6300–8650 | 5 |
| 20131102 | 56598.05 | 26.2 | GTC+OSIRIS | R1000B+ | 3600–7750 | 7 |
| 20131107 | 56603.26 | 31.4 | GTC+OSIRIS | R1000B+ | 3600–7750 | 7 |
| 20131109 | 56605.39 | 33.5 | Palomar+DBSP | BLUE (600/4000)+ | 4000–10000 | 3 |
| 20131112 | 56608.04 | 36.2 | NOT+ALFOSC | gm4+ | 3700–8880 | 14 |
| 20131205 | 56631.06 | 59.2 | Ekar1.82m+AFOSC | gm4+VPH6+ | 3900–8800 | 14 |
| 20131211 | 56637.00 | 65.2 | Ekar1.82m+AFOSC | gm4+VPH6+ | 3900–8800 | 13.5/15 |
| 20131227 | 56653.75 | 82.0 | Ekar1.82m+AFOSC | gm4+VPH6+ | 3900–8800 | 13.5/15 |
| 20140103 | 56660.77 | 89.0 | TNG+LRS | LR-B/R+ | 3800–9150 | 10.5 |
| 20140301 | 56717.78 | 146.0 | TNG+LRS | LR-B+ | 3900–8000 | 10.5 |
| 20140821 | 56890.19 | 318.3 | GTC+OSIRIS | R1000B+ | 3850–7750 | 7 |
| 20141114 | 56976.16 | 404.3 | GTC+OSIRIS | R1000B+ | 3850–7750 | 7 |
| 20131105 | 56601.03 | 29.2 | TNG+NICS | IJ+ | 8750–13,500 | 28 |
| 20131118 | 56615.00 | 43.1 | TNG+NICS | IJ+ | 8750–13,500 | 28 |
| 20131224 | 56650.84 | 79.0 | TNG+NICS | IJ+ | 8700–14,500 | 28 |
| 20131225 | 56651.89 | 80.0 | TNG+NICS | HK+ | 14,750–24,800 | 54 |
a Phases are relative to maximum light, MJD .