On the interpretation of the Fermi GBM transient observed in coincidence with LIGO Gravitational Wave Event GW150914
Abstract
The weak transient detected by the Fermi Gamma-ray Burst Monitor (GBM) 0.4 s after GW150914 has generated much speculation regarding its possible association with the black-hole binary merger. Investigation of the GBM data by Connaughton et al. (2016) revealed a source location consistent with GW150914 and a spectrum consistent with a weak, short Gamma-Ray Burst.
Greiner et al. (2016) present an alternative technique for fitting background-limited data in the low-count regime, and call into question the spectral analysis and the significance of the detection of GW150914-GBM presented in Connaughton et al. (2016).
The spectral analysis of Connaughton et al. (2016) is not subject to the limitations of the low-count regime noted by Greiner et al. (2016). We find Greiner et al. (2016) used an inconsistent source position and did not follow the steps taken in Connaughton et al. (2016) to mitigate the statistical shortcomings of their software when analyzing this weak event. We use the approach of Greiner et al. (2016) to verify that our original spectral analysis is not biased.
The detection significance of GW150914-GBM is established empirically, with a False Alarm Rate (FAR) of Hz. A post-trials False Alarm Probability (FAP) of () of this transient being associated with GW150914 is based on the proximity in time to the GW event of a transient with that FAR. The FAR and the FAP are unaffected by the spectral analysis that is the focus of Greiner et al. (2016).
1 Introduction
With the detection by the Laser Interferometer Gravitational-wave Observatory (LIGO; LIGO Scientific Collaboration et al. (2015)) (Abbott et al., 2016c, a; The LIGO Scientific Collaboration et al., 2017) of two highly significant gravitational wave (GW) events and one additional probable GW event during their O1 science run came the search for possible electromagnetic counterparts. A concerted observational follow-up campaign, organized in advance of the first science operation period of LIGO, O1, involved dozens of ground- and space-based telescopes, including the Gamma-ray Burst Monitor (GBM) on the Fermi Gamma-ray Space Telescope. GBM is an all-sky monitor of the transient sky between 8 keV and 40 MeV, consisting of 12 Sodium Iodide (NaI) scintillators sensitive below 1 MeV and 2 Bismuth Germanate (BGO) scintillators sensitive above 200 keV. Meegan et al. (2009) provide a comprehensive description of GBM and we list only the GBM capabilities that are salient to the work presented here. The NaI detectors have different orientations that together cover the whole sky with highest sensitivity along the observatory pointing axis, and falling off at very large angles to the boresight of the observatory. By examining the relative count rates measured in the 12 detectors the arrival direction of any detected signal can be reconstructed with an accuracy ranging from tens to hundreds of square degrees on the sky, depending on the intensity of the event. The BGO detectors have a more omnidirectional response and contribute mostly to the spectral analysis of transients above 200 keV. GBM’s participation in the follow-up campaigns to GW events during O1 contributes broad sky coverage, coarse but useful source localization capability, high duty cycle, and energy coverage that provides good sensitivity to short Gamma-Ray Bursts (sGRBs). A summary of the follow-up observations to the first GW event, GW150914, is presented in Abbott et al. (2016b), with more observational details in Abbott et al. (2016d).
Because the most likely progenitor for a sGRB is the merger of compact objects in a binary system involving at least one neutron star, and because the number of sGRBs detected in the LIGO horizon is low (Siellez et al., 2014) – zero so far with measured redshift – the GBM team has deployed offline searches of the GBM data for sGRBs too weak to trigger GBM on-board. These offline searches are described in more detail in Connaughton et al. (2016) (VC+16). An untargeted offline search of the GBM data yields around 80 new candidates per year (Briggs et al., in preparation), tripling the GBM sGRB detection rate. A targeted search of the GBM data designed specifically to look for counterparts to GW events is even more sensitive. Details of the targeted offline search deployed during O1 are provided in Blackburn et al. (2015) and VC+16. It can be summarized as a search over the whole sky, coherently combining the data from all 14 GBM detectors (NaI and BGO) to test the statistical preference for a source above background. The search is performed over a user-specified time window, revealing short-duration candidates typically between 0.256 s to 8.192 s in duration, with candidates ranked by a Bayesian likelihood statistic. At each tested sky position the full instrument response is convolved in turn with three template source spectra. The likelihood of a source being present is evaluated with each template. The preferred spectral template and the most likely arrival direction for any transient are the template and sky position that maximize the likelihood. A high likelihood value implies that the relative rates in the 14 detectors are consistent with a source coming from that direction. Conversion of the likelihood into a FAR came originally from running the search on 2 months of GBM data (Blackburn et al., 2013) and depends on the preferred template spectrum for each candidate. The FAR does not assign meaning to a particular transient – it is calculated empirically with respect to the distribution of transients in the GBM data, including astrophysical transients and background fluctuations. There are more soft transients in the GBM data than hard, likely associated with galactic sources. For a given likelihood value, therefore, a transient that prefers the soft spectrum has a higher FAR than one preferring the hard spectrum. In VC+16 we report the detection with the targeted offline search of the GBM data of a transient preferring the hard spectral template, 0.4 s after GW150914, with a FAR of about Hz. We verified the conversion of likelihood into FAR established in Blackburn et al. (2013) by running the search on 220 ks of data taken on days around the GW event, and in Connaughton et al. (2016) we used the very similar FAR from the contemporaneous data in preference to the earlier result. In the absence of theoretical predictions for an electromagnetic signal from a binary black hole merger, we assume that the closer in time a candidate occurs relative to the GW time, the more likely it is that the events are related. Assuming the probability of association scales inversely with the relative time to the GW event, we find a FAP of 0.0022 for a candidate with this FAR. Under a more conservative assumption that the relative time probability is uniform over a 60 s search window, the FAP would be 0.028. This empirical result emerges from a procedure developed a priori by running the search on months of GBM data and is independent of and unaffected by subsequent investigation of the data to probe the nature of the transient.
The targeted search can additionally consider the consistency of possible GBM sky locations with the source position region derived from the LIGO data. This capability was not implemented during O1 because we had not assessed the effect on the location-dependent likelihood of combining information from imperfect GBM localizations with LIGO sky regions of a different shape but similar size. Instead, a uniform sky prior was assumed and the source could come from any direction. We explored further the localization of the gamma-ray transient using the process employed by the GBM team in regular operations. This process informed the development of the targeted search, which retains common features such as its use of spectral templates and grid searches for likely source arrival directions.
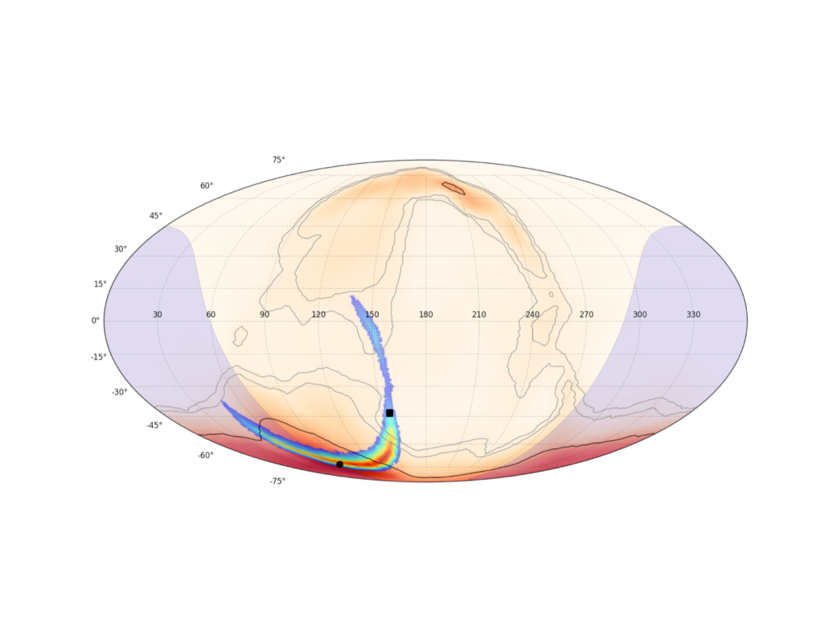
The localization code (Connaughton et al., 2015) finds the minimum on a resolution grid of arrival directions. The observed background-subtracted rates in the 12 NaI detectors are compared with the rates expected from simulations of three template spectra using the detector responses for sources at each point on the grid. A statistical uncertainty region is defined by tracing the gradient of within the grid around the most likely position. When applied to GW150914-GBM, this uncertainty region is large, with the 68% confidence level region covering 3000 sq degrees, as shown in Figure 1, and encompasses large regions of the LIGO localization arc. The relative GBM detector rates are incompatible at this confidence level with a source outside the uncertainty region. The systematic uncertainties for triggered GRBs are small compared with this large region (Connaughton et al., 2015) but we have not yet estimated any additional systematic effects that might apply to the localization of such a weak transient, and we omit systematic uncertainties from these localization contours. Consistency is seen between the arrival directions of the GBM-detected transient and the GW event, albeit with large uncertainties in both instruments. Combining the GBM localization with the LIGO localization region and excluding the part of the sky hidden to Fermi by the Earth allows a 2/3 reduction of the LIGO localization region, assuming of course the events are related.
In VC+16, we report spectral fits to the GBM data for GW150914-GBM performed using the rmfit spectral analysis software package111http://fermi.gsfc.nasa.gov/ssc/data/analysis/rmfit/ and appropriate detector responses. We sampled eleven positions along the LIGO arc in Figure 1 without considering whether the positions were consistent with the GBM localization, but excluding source locations behind the Earth to Fermi. Using data from the NaI and BGO detectors with the smallest angles to the source position, in all cases NaI 5 and BGO 0, we were able to obtain a power-law fit to the data for all positions along the LIGO arc, with an index value of sampled over the arc. An exponential cut-off fit was possible for one source position, in approximately 50% of the fit iterations, but the position was excluded as a possible source location by the GBM localization so that this should be considered an unreliable fit. The fluence calculated between 10 and 1000 keV, obtained by deconvolving the instrument response from positions sampled uniformly over the arc, was erg cm-2, among the 40% weakest short GRBs that trigger GBM. The fact that this transient did not trigger GBM is explained by its arrival geometry, at very large angle to the observatory boresight relative to which the GBM detectors are aligned. At the most likely source location, the detector with the smallest angle to the source direction is NaI 5 at . None of the NaI detectors had good, on-axis coverage of the source direction and thus many detectors registered the event counts via the back and side. None of the detectors individually registered statistically significant increases in the count rate above the background. Owing to the large angles of the NaI detectors to the observatory boresight, any source signal passes through significant obstacles on the satellite, suffering absorption at the lower energies and scattering at all energies. Because of this viewing geometry, although the fluence is among the distribution of fluences calculated for triggered short GRBs, it is much weaker in count space than GRBs that trigger GBM.
Greiner et al. (2016) (JG+16) present an alternative spectral fitting technique they have developed for fitting background-limited data in the low-count regime, and call into question the spectral analysis of VC+16 and the significance of the detection of GW150914-GBM in VC+16. The spectral analysis of VC+16 is not subject to the limitations of the low-count regime noted by JG+16. The detection significance of GW150914-GBM is unaffected by the spectral analysis that is the focus of JG+16. Our findings are summarized below.
-
•
JG+16 compare the spectral fit results obtained for simulated source spectra from the rmfit software used in VC+16 with those from their own software package. As the simulated source becomes weaker, they show that rmfit overestimates the amplitude of the spectrum and their software does not. In VC+16 we use 8-channel data to perform the spectral deconvolution and not the finely-binned 128-channel data used in JG+16. This mitigates the known limitations of rmfit when calculating fit parameters and their uncertainties in the low-count regime.
-
•
As evidence that rmfit overestimates the amplitude of the spectrum, JG+16 convolve the fit parameters of VC+16 with a detector response and find the predicted counts above background exceed the observed counts in that detector. The fit parameters in VC+16 were obtained by sampling source positions over the entire LIGO arc. The fit of JG+16 is for a single source direction, where the detector response is nearly three times greater in effective area than most of the positions on the arc. When we convolve our fit parameters for this single favorable source position with the appropriate detector response, we match the observed counts in the detector, implying no rmfit -induced bias exists in our fit.
-
•
We repeat our spectral fits with 8-channel data and the XSPEC software package using a fitting statistic appropriate for the low-count data. We find results very similar to VC+16, showing our spectral fits using rmfit are not biased by low-count statistics. The amplitude parameters in JG+16 are significantly lower and spectral indices softer (though with very large uncertainties) than those obtained with XSPEC (or rmfit).
-
•
Visual inspection of the background levels in JG+16 suggests they are higher than those in VC+16. These background fits result in lower background-subtracted counts in the source interval, hence lower fit amplitudes and fluences in an analysis of the source spectrum. We suggest that a different approach to fitting background levels is the main difference between the fits in the two papers, and not the limitations of the spectral fitting software used in VC+16.
-
•
If the background fits of JG+16 are correct, then the lower fluences they obtain suggest compatibility with non-detection by SPI-ACS from all positions on the arc. JG+16 do not draw this natural conclusion, implied by their own spectral analysis, instead concluding that the lower (but non-zero) fluence indicates no source is present.
-
•
JG+16 look for a statistical preference for a source plus background over just background using data from just two detectors. VC+16 use data from all 14 detectors in the source detection procedure and in the calculation of its significance and FAR.
-
•
The source position selected by JG+16 for spectral analysis of GW150914-GBM is completely excluded by the GBM localization ( level). Testing for a source at that position will not yield evidence of a source because the relative rates measured in the GBM detectors are incompatible with a source at that location.
-
•
The assertion of JG+16 that the spectrum of GW150914-GBM is “very soft” like a galactic source is not borne out by their own spectral fits or by cursory visual inspection of the detector count data.
-
•
JG+16 state that the FAR for GW150914-GBM is an optimistic lower limit because the true spectrum of GW150914-GBM is softer than the template spectrum with which it was discovered. The FAR is derived empirically and does not require that the spectral templates be good representations of true source spectra. The search may not be as sensitive to a source if its spectral templates do not adequately represent the true source spectrum. This will result in a less sensitive search, not an unreliable FAR; in fact for an inefficient search we might say the FAR is a pessimistic upper limit.
-
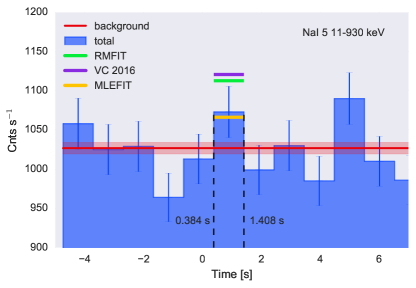
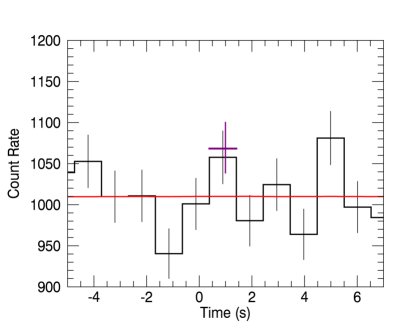
•
The raw count-rate lightcurve included in VC+16 (Figure 7 in appendix C of VC+16) shows a signal-to-noise ratio of , contradicting a statement in JG+16 that the signal-to-noise ratio of the lightcurve depends on an assumed hard spectral shape.
-
•
The lightcurves in VC+16 are shown only as a visual aid. The signal-to-noise ratio of 5.1 in the model-dependent discovery lightcurve does not relate directly to the post-trials significance of calculated in VC+16, as suggested by JG+16. The post-trials significance of reflects an empirical measurement of how likely it is that a transient of the signal size and consistency with a point source indicated by the likelihood and associated FAR (whether background or astrophysical) occurs by chance so close in time to a GW event.
In the following sections we address these issues in more detail. We do this without challenging the premise of JG+16 that there exist more suitable statistical approaches to the spectral analysis of weak transients than that used in rmfit.
2 Analysis of GW150914-GBM
2.1 Approaches to spectral analysis
Both the rmfit spectral fitting package used in VC+16 and the maximum-likelihood estimation (MLEfit) package in JG+16 take a forward folding approach to determining the parameters that best fit the data for any model, given the instrumental response to a source from a particular direction. The minimization routine producing the best fit parameters uses a likelihood-based fitting statistic, CSTAT, but the approaches to modeling the uncertainties in the background differ. rmfit uses a -based polynomial fit to the background in which the background uncertainties across the source time interval are obtained from the model. MLEfit uses the Poisson likelihood-based Cash statistic in the estimation of the background uncertainty in any time bin. JG+16 show in section 2.3 of their paper, using simulations of GRBs over a range of source intensities, that rmfit and MLEfit yield similar results for bright sources. As the simulated source intensity decreases, rmfit analysis of 128 energy channel GBM data overestimates the fluence of the source whereas MLEfit recovers a value closer to the true value.
In VC+16 we use 8-channel data to perform the spectral deconvolution instead of the 128-channel data used in JG+16. The pitfalls of using rmfit to analyze low-count data are known – in the routine calculation by the GBM team of the duration of a GRB, where spectral fits are performed over successive short time intervals, 8-channel data are used in preference to 128-channel data, a practice we follow in VC+16. This mitigates the known effect of low-count statistics in calculating fit parameters and their uncertainties. The energy channel with the fewest source counts – 13 counts in channel 6 of BGO 0 – is above the limit of 10 counts suggested by JG+16 as a lower limit for rmfit and CSTAT.
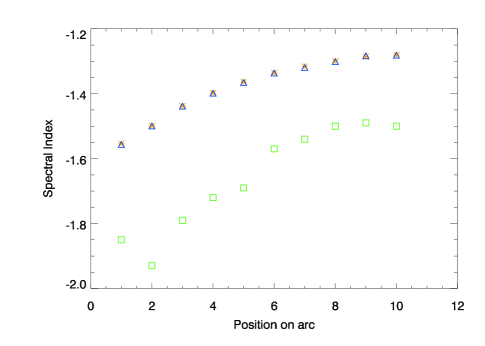
JG+16 acknowledge that 8-channel data are used in VC+16, but their exploration of statistical techniques is done with 128-channel data, which makes the comparison with the analysis in VC+16 difficult. This exploration continues in section 3.1 of JG+16 with spectral fits to the 128-channel data from GW150914-GBM, using rmfit and MLEfit, assuming in turn each of the ten source positions on the southern part of the LIGO arc analyzed in VC+16, and recovering both a power-law index and an amplitude as parameters of the fit. They find that rmfit returns higher amplitudes, harder power-law indices, and smaller parameter uncertainties for all positions on the arc, although the rmfit values are contained within the 68% uncertainty regions of the MLEfit parameters.
2.2 Use of incorrect detector response
Taking a single source position along the LIGO arc, JG+16 calculate how many counts above background would be expected in a single detector, NaI 5, using the central parameter values from the various fits and the detector responses for a source at the assumed location. This should be a simple reversal of the fit, where folding the fit parameters through the detector response yields the observed count rates above background. Instead, Figure 5 of JG+16, reproduced in the left panel of Figure 2, shows that the parameters obtained using rmfit with 128-channel data yield an expected count rate in excess of the observed rate (green data point) whereas the parameters obtained using MLEfit are consistent with the observed count rates (gold). This is consistent with their conclusion that in the low-count regime, rmfit overestimates the amplitude of a weak source, so that convolving the fit with the detector response results in expected count rates above those observed. The authors also take the spectral fit parameters reported in VC+16 and fold them through the detector responses for the entirely different source position analysed in JG+16. The count rates (purple) from this convolution exceed the observed rates, being comparable to and even higher than the green point. The authors conclude that the 8-channel fits in VC+16 suffer the same problems as the 128-channel rmfit analysis in JG+16, and are therefore not reliable.
The fit parameters in VC+16 were obtained by sampling source positions over the entire LIGO arc, with most of the positions contained in a sky region where the angle of the source to NaI 5 was . The convolution of the parameters in Figure 5 of JG+16 uses responses for a source position at to NaI 5. The use of this inconsistent and therefore incorrect detector response results in an overestimation of the expected signal by approximately a factor of three, consistent with the purple data point in the figure.
In the right panel of Figure 2 we show the convolution of the fit parameters obtained using rmfit with 8-channel data for the source position assumed by JG+16, demonstrating that the observed count rates are matched when the fit parameters are convolved with the appropriate response, as expected. The fit parameters for this source position are not listed in VC+16 and have only a small weight in the overall fit reported in VC+16. They contribute only minimally to the uniform sampling over the LIGO arc, with most of the positions on the arc at far larger angles to NaI 5.
We do not overplot our predicted counts for this source position on the left panel of Figure 2 because the convolution produces counts above background. We were unable to reproduce the background fit of JG+16 (red line on the left panel of Figure 2), which appears to be around 1025 counts/sec between 11 and 930 keV. By contrast, the background in VC+16 is around 1010 counts/sec in the energy range 12 to 980 keV. Background fits can differ according to the time intervals or the model used for the fit.
The counts above background predicted from the fit obtained in the rmfit analysis of 128-channel data from JG+16 on the left panel do appear to be much higher than those on the right panel from our rmfit fit for a source at the same position. We attribute our ability to match the observations, while the rmfit analysis of JG+16 overestimates the expected counts, to our mitigation through the use of 8-channel data of the shortcomings of rmfit in the low-count regime.
2.3 Use of excluded source location
We now consider the choice of source position along the LIGO arc used in JG+16 for the comparison of the spectral fits obtained using rmfit and MLEfit. It is the northernmost position on the southern part of the LIGO arc, listed in 10th position in Table 2 of VC+16, where the order is from south to north. The five southernmost points contain over 50% of the total probability in the LIGO localization region, and the five northern points of the southern arc a total of around 20%, with the position selected in JG+16 containing only 2% of the LIGO localization probability. This position on the arc is notable in having the smallest angle to NaI 5 () and the most favorable position on the southern arc for GBM in general. A fluence calculated for a source at this position will be lower after deconvolution of the detector responses than for a source at a less favorable geometry to GBM.
It can be seen in Figure 1 that the source position selected by JG+16 for spectral analysis of GW150914-GBM is completely excluded by the GBM localization ( level). The relative rates measured in the GBM detectors are incompatible with a source at that location, implying that any spectral fits to the data assuming this source position are not reliable.
Figure 2 shows that even an unreliable fit can be used to recover the observed count rates when the fit parameters are convolved with the appropriate detector response, both for the MLEfit analysis and the 8-channel rmfit analysis. The choice of a source position excluded by the GBM localization could be a problem, however, if used to infer other properties of the source.
In section 4.2 of JG+16, the authors present a Bayesian approach to source detection that considers not just the amplitude of the source signal, but also its spectral distinctness from the background data surrounding the time interval of interest. This novel technique would allow the detection of a weaker transient above background if its energy spectrum were sufficiently distinct from the spectrum of the background whereas a transient with a similar energy spectrum to the background would need to be brighter to be distinguished above the background.
Using the data from two GBM detectors (NaI 5 and BGO 0), JG+16 test whether a source exists above background and find no preference for a source. When they inject a simulated source of the amplitude and spectral power-law index reported in VC+16 they find a preference for a source above background. The authors attribute this effect to the similarity between the spectrum of GW150914-GBM in the real data and the spectrum of the background data around it. In the simulation, by contrast, the difference between the source and background data allows the detection of the source. Their conclusion is that the data in the GW150914-GBM time interval form part of the background. Conversely, Figure 9 of JG+16 shows that if a source is injected using responses from a known source position, then as long as the same response is used in the detection process, the simulated transient will have the correct count rate ratios for the two detectors and will be recovered as a source above background. The authors do not show that an injected simulated transient with the same amplitude but with a spectrum similar to their background spectrum is not recovered in their analysis.
We discuss this Bayesian approach here because it is the only aspect of JG+16 that deals with source detection rather than spectral analysis. The technique could provide an alternative approach for signal detection to that detailed in VC+16 with a new dimension that considers not just the size of a signal and its compatibility with a source based on coherent combination of detector data but also the distinctness of the putative signal from the surrounding background data. The detection of GW150914-GBM presented in VC+16 relies on the combination of data from all GBM detectors, not just two detectors. The authors in JG+16 have shown in this introduction to their Bayesian approach the ability to consider data from multiple detectors. A natural next step is to combine the data from all detectors, which they have done in Burgess et al. (2016). In this new paper, they find the transient event GW150914-GBM and calculate a fluence similar to that obtained in VC+2016. Their assessment laid out in JG+2016 that this is a background fluction is unchanged, based on the non-detection of the event by SPI-ACS. The crux of VC+2016 is that a transient is found with a significance, a FAR, and a FAP determined empirically without any conclusion as to the nature of the event itself. The power of the Bayesian technique presented in JG+16 and explained in greater detail in Burgess et al. (2016) would be enhanced by the evaluation of a False Alarm Rate based on running the search on long stretches of data.
2.4 Detectability of GW150914-GBM by SPI-ACS
The investigation of the spectral analysis of GW150914-GBM by JG+16 includes an assessment in section 5 of their paper of the detectability of the GBM transient in the anti-coincidence shield of the SPectrometer onboard INTEGRAL (SPI-ACS) (Savchenko et al., 2016) assuming spectral fit parameters obtained in the rmfit and MLEfit 128-channel analysis presented in Table 1.
Figure 11 of JG+16 shows that while the detection significances expected in the SPI-ACS based on the 128-channel rmfit analysis are very high, the MLEfit analysis suggests fluences compatible with non-detection by SPI-ACS from all positions on the arc. The authors do not draw this natural conclusion, based on their own spectral analysis.
We note that the red crosses in Figure 11 are supposed to represent the fit parameters in Table 1 but do not in fact correspond to those values (Table 1 implies overlapping parameter regions for rmfit and MLEfit). It is not clear from the text which set of numbers is correct.
JG+16 also show in Table 2 the expected fluences in the ACS in the 50 – 4700 keV energy range, using the same list of positions as in Table 1. The fluence for their chosen position (line 2 in both tables) is the second highest but should be among the lowest in the table given the favorable geometry to GBM. This discrepancy is suggested also by the low expected detection significance in in the same table.
We note that predicting signal strengths in the SPI-ACS from spectral information obtained from GBM is an active area of collaboration between the two instrument teams. JG+16 use a simple power-law fit to the data from GBM, that is unlikely to represent the true spectrum of the source, to estimate the expected signal size in SPI-ACS, an instrument with a different response as a function of energy. Ongoing work suggests the true shape of the spectrum, the asymmetry in fit parameter uncertainties, and the location of the source all play an important role in establishing consistency among signals in different instruments.
3 What is the true spectrum of GW150914-GBM and does this affect its detection significance?
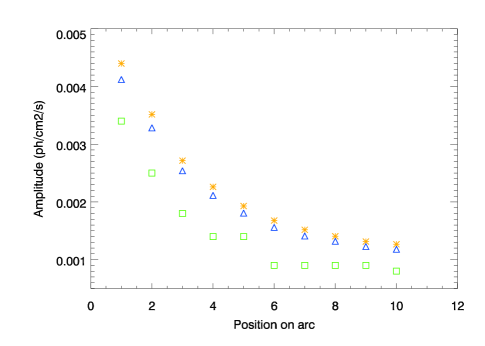
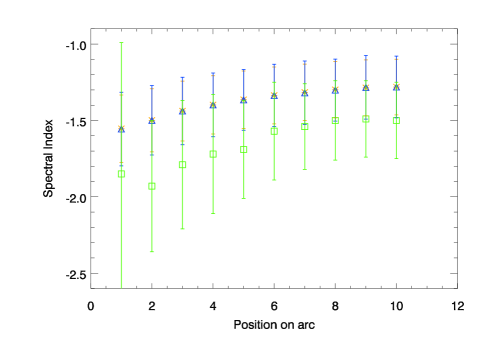
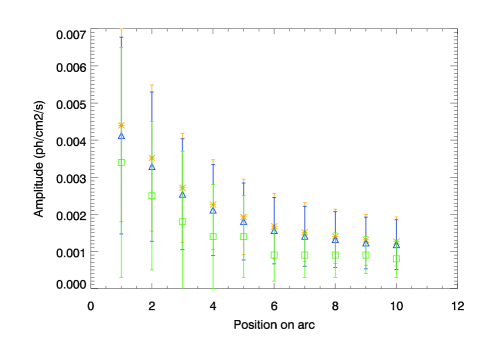
Spectral analysis of data from weak transients seen in high-background detectors is limited by our understanding of detector responses, background variations, and modeling of source spectra. The tools developed for the analysis of bright transients, where background uncertainties do not play a large role, need improvements to deal with low-count statistics. We have modified rmfit to deal with background uncertainties in a manner similar to MLEfit and repeated our analysis of GW150914-GBM with the 8-channel data used in VC+16. We do not recover the softer power-law indices, lower amplitudes, and large uncertainties reported in JG+16. We repeated the analysis using XSPEC (Arnaud, 1996), the standard spectral fitting tool in the high-energy astronomical community222https://heasarc.gsfc.nasa.gov/xanadu/xspec/manual/XspecManual.html. We use XSPEC version 12.9.1 with the PGStat fitting statistic, which accounts for non-Poisson background in Poisson data, overcoming the limitations of rmfit in its treatment of background uncertainties in the low-count regime. For the source position explored in JG+16, we find an amplitude (at 100 keV) of ph/cm2/s compared with using rmfit and with MLEfit in JG+16. The indices returned by rmfit and XSPEC are very similar ( versus ) with MLEfit producing a much softer (but still within errors) index of . In Figure 3 we show the comparison along the LIGO arc of the three packages for both the amplitude and the index of the fit. Although XSPEC produces systematically slightly lower amplitudes (using the same data and background fits) than rmfit , the differences are small, much smaller than the differences between either package and MLEfit (using different background selections). The indices returned by XSPEC and rmfit show no systematic deviation and are much harder than those returned by MLEfit. Noting that our background fit means more counts are attributed to the source than in JG+16, we suggest that the main difference between the analysis of 128-channel data with MLEfit and 8-channel data with rmfit may be systematic – a consequence of different background fits – instead of statistical. It is clear that both the level of the background established by the fit and the statistical uncertainties in the background rates over the source time interval play important roles in the analysis and that calculating the true spectrum and fluence of such a weak transient is difficult.
We now consider how the significance of the detection of GW150914-GBM is affected by the possibility that the spectral analysis reported in VC+16 is flawed and the spectral analysis reported in JG+16 is a better representation of the true spectrum of the transient. As described above, GW150914-GBM was found in a coherent search over the whole sky using the data from all 14 GBM detectors in a 60 s time window centered on GW150914. At each tested sky position and in each time interval (overlapping bins from 0.256 s to 8.192 s) the full instrument response is convolved with three template source spectra in turn and the likelihood of a source being present compared with just background is evaluated. The search reports the likelihood for the time interval and source template that produces the highest likelihood value. We note that the background fits for the search are performed automatically and completely independently of the background fits in any subsequent spectral analysis. No optimization of spectral fit parameter values occurs during the search procedure – just a convolution of the count data with the instrument response using the template spectra – with no guarantee that even one of the three templates is a good fit to the data. Including more templates could make the search more sensitive to a particular transient but at the cost of trials factors when evaluating the FAR. The three templates are considered a good balance of sensitivity to a broad range of sources GBM could detect – soft (galactic), normal (typical of long GRBs and some short GRBs), and hard (some short GRBs) – and avoiding unnecessary trials factors. A transient might produce a low FAR with more than one of the templates but the search reports only the result for the template spectrum yielding the highest likelihood. A different set of template spectra may result in a different preferred spectrum and a different likelihood for a given candidate but a valid result will be obtained for the FAR so long as this new set of spectra are used in the search over enough data to evaluate how the likelihood converts to a FAR.
The bulk of the analysis in JG+16 concerns the spectral fits to the GW150914-GBM data, which play no role in the detection of the transient or the evaluation of its significance.
The concept of the FAR being an “optimistic lower limit” to the FAR because the spectral template is not a good representation of the true spectrum is meaningless in the context of an empirically derived FAR, as described above. The search may not be as sensitive to a source if its spectral templates do not adequately represent the true source spectrum. This will result in a less sensitive search, not an unreliable FAR.
The repeated assertion of JG+16 that the spectrum of GW150914-GBM is “very soft” resembling a galactic source is not borne out by their own fits or by cursory visual inspection of the detector count data. The soft spectrum in the search turns over above 70 keV to a steep power-law index of -3.5 but we see a signal in BGO 0 above 200 keV. If soft transients found in our search preferred a hard template then we should expect the search to reveal galactic transients preferring the hard template, which does not happen. The higher FAR and galactic concentration of the candidates preferring the soft spectrum suggests the search efficiently finds these numerous transients with the soft template.
As stated by JG+16, the discovery lightcurve in VC+16 is indeed model-dependent, and shown only as a visual aid. Figure 7 in Appendix C of VC+16 shows a raw count-rate lightcurve with a signal-to-noise ratio of , demonstrating that the signal-to-noise ratio does not depend strongly on an assumed spectral shape.
The signal-to-noise ratio of 5.1 in the model-dependent discovery lightcurve does not relate directly to the value of as suggested by JG+16. The value of is derived from the calculation of the likelihood that a source is present compared with just background, converted into a FAR and a FAP. It is a post-trials estimate of how likely it is that a transient of the size and consistency with a point source indicated by the likelihood and associated FAR (whether background or astrophysical) occurs by chance so close in time to a GW event.
4 Discussion
Investigations of the GBM data have been carried out by several different groups since VC+16 first announced the unexpected potential counterpart of GW150914. In an analysis by Xiong (2016), the author suggests that the signal above background is higher in the 10 detectors with a poor viewing geometry to the most likely GW position than in the 4 detectors with a good viewing geometry. He ignores the detector responses themselves, considering only the angle of the source to the detector normal. The second brightest NaI detector, NaI 9 has the largest angle to the GW position but better sensitivity to the source than some of the other NaI detectors because of the efficiency of the detector through its back side. Similarly, BGO 1 is classed as a detector with a bad viewing geometry but both BGO detectors, however, have roughly equal exposure to any transient sources with a direction extending underneath the spacecraft. Thus the separation of detectors into good and bad based on this geometric factor without considering the response of the detectors, the mass model of the spacecraft including blocked detectors, and scattered flux into detectors from the spacecraft and the Earth is simplistic. The detection and localization of GW150914-GBM implicitly considers these geometrical factors when a source is found and localized based on the count rates in all the detectors and the full instrumental response.
Another team (Bagoly et al., 2016) has analyzed the GBM data and found potential transient counterparts near the time of GW150914 and also LVT151012, a GW candidate for which our search uncovers no potential counterpart (Racusin et al., 2017). They combine data from multiple detectors to look for evidence of a source but do not do so coherently with respect to either energy channels or detectors. Instead they attribute weights to each detector and energy channel based on the signal to noise in that detector and channel. The weight they attach to each detector and each energy channel does not require a sensible energy spectrum or a detector combination consistent with a single location on the sky. We fear that this approach magnifies statistical fluctuations in the case that no source is present in the data.
In the work presented here we concentrate on the analysis of the GBM data for GW150914 by JG+16. The bulk of the work presented in JG+16 concerns spectral analysis techniques for background-limited data in the low-count regime, a welcome discussion of an important topic for the analysis of weak transients we might expect to find in association with future GW events. The ability to determine the source spectrum affects the calculation of the fluence and the detectability of the transient by instruments such as SPI-ACS.
The comparison of the two statistical approaches in JG+16 that highlights the shortcomings of rmfit in the low-count regime is performed on a data type with 128 energy channels, while the analysis of VC+16 uses 8-channel data. The use of 8-channel data mitigates the known limitations of rmfit when calculating fit parameters and their uncertainties in the low-count regime. JG+16 convolve the spectral fit parameters reported in VC+16 with detector responses for a source at a much smaller angle to the detector than the source angle from which the fits were obtained. This results in an overestimation of the expected count rates in that detector by approximately a factor of 3. We show in the right panel of Figure 2 that convolving the fit parameters in VC+16 with detector responses for a source from the position from which the fits were obtained produces count rates that are consistent with the observations.
JG+16 obtain spectral fit parameters that differ from those presented in VC+16. We implemented a similar treatment of background uncertainties to theirs in rmfit but were unable to reproduce the results of JG+16. On the other hand, we reproduced the spectral analysis results of VC+16 using the XSPEC fitting package and the PGStat fitting statistic, so we speculate that the different fits to the background in the two analyses may be at least partly responsible. If the background fits of JG+16 are correct, then the lower fluences obtained by JG+16 are consistent with the non-detection of GW150914-GBM by the SPI-ACS. Based on the spectral fits to GW150914-GBM reported in VC+16, the non-detection by SPI-ACS is constraining (Savchenko et al., 2016), requiring a turnover in the spectrum and/or a lower amplitude. The spectral analysis of this weak transient is clearly challenging and subject to systematic uncertainties in addition to the statistical issues noted in JG+16.
JG+16 use the results of their spectral analysis to challenge the significance of GW150914-GBM, which relies on the FAR associated with its likelihood value. The FAR is an empirical result emerging from a procedure developed a priori using months of GBM data and is independent of and unaffected by subsequent investigations of the data that probe the nature of the transient. The detection pipeline for the transient is unrelated to rmfit or to spectral analysis in general, and uses an automated background fitting procedure independent of any subsequent spectral analysis. There are no free parameters beyond time and duration; we marginalize over sky position and the analysis is simply a convolution with the response of each of the detectors using the three template spectra, and a calculation of the likelihood a source is present given the observations. GW150914-GBM was uncovered with a preference for the hard spectral template. The spectral fits reported in JG+16 and VC+16 lie somewhere between the hard and normal templates (not the soft template, as stated in JG+16) although neither the normal nor the hard spectrum is a power-law fit. It is very likely that the true spectrum, if astrophysical, is not a power-law either, but the transient is too weak for other spectral shapes to be constrained. Because the FAR is evaluated using the same search over months of data, mis-characterizing the spectrum of any class of transient or background fluctuation using inappropriate templates will be done equivalently in the background and when looking for a GW counterpart. The search does not have to be maximally efficient and the spectral templates do not need to represent accurately the true spectral shape of the source.
5 Conclusions
Nearly a year after the publication of the detection of GW150914-GBM as a potential counterpart to GW150914, we revisit the association between the weak GBM transient and the GW. No further transients were uncovered connected with the other GW and high-confidence GW candidate detected by LIGO during O1, either by GBM (Racusin et al., 2017) or by other instruments taking part in the follow-up campaign. Alternative investigations of the GBM data for GW150914-GBM have been published. In light of these independent analyses, we revisit our original analysis and find no reason to question its validity. Upper limits to the fluence from the non-detection of GW150914-GBM at higher photon energies were obtained by SPI-ACS (Savchenko et al., 2016) and by the microcalorimeter on-board the Astrorivelatore Gamma a Immagini Leggero (AGILE), (Tavani et al., 2016). Ongoing collaborative efforts between the GBM and SPI-ACS teams will determine whether there exists parameter space in which a detection in one instrument can accommodate a non-detection in the other based on the spectrum and arrival direction of the transient. It is clear from the comparison of the spectral analyses in VC+16 and JG+16 that determining the spectrum of such a weak transient in a single instrument is difficult, which complicates the calculation of expected signals in other instruments.
The build-up to the current observing season of LIGO, O2, saw refinements and improvements to the targeted search of the GBM data (Goldstein et al., 2016) and the full deployment of the untargeted search, with candidates online333https://gcn.gsfc.nasa.gov/fermi_gbm_subthresh_archive.html with candidates promptly reported via the Gamma-ray Coordinates Network444https://gcn.gsfc.nasa.gov/admin/fermi_gbm_subthreshold_announce.txt. Improvements to the targeted search include the replacement of the hard template with a template more typical of sGRBs in which the power-law index turns over steeply above the peak energy; an improved background-fitting process; the incorporation of information from the LIGO localization in ranking the candidates uncovered by the search; and the production of lightcurves and sky maps to evaluate quickly any interesting candidates that can then be distributed to fellow LIGO follow-up observers.
In the absence of confirmation from other instruments or new counterpart candidates to other GW events from merging black holes in binary systems, the believability of the association between GW150914-GBM and GW150914 still rests on the FAR and the FAP and the supporting analyses reported in VC+16 that do not exclude the association. The alternative analyses of the GBM data do not confirm or challenge this association. Further insight into the possible connection of GW150914-GBM with the gravitational-wave event GW150914 will likely have to wait for more observations of similar binary black hole mergers.
References
- Abbott et al. (2016a) Abbott, B. P., Abbott, R., Abbott, T. D., et al. 2016a, Physical Review X, 6, 041015
- Abbott et al. (2016b) —. 2016b, ApJ, 826, L13
- Abbott et al. (2016c) —. 2016c, Physical Review Letters, 116, 061102
- Abbott et al. (2016d) —. 2016d, ApJS, 225, 8
- Arnaud (1996) Arnaud, K. A. 1996, in Astronomical Society of the Pacific Conference Series, Vol. 101, Astronomical Data Analysis Software and Systems V, ed. G. H. Jacoby & J. Barnes, 17
- Bagoly et al. (2016) Bagoly, Z., Szécsi, D., Balázs, L. G., et al. 2016, A&A, 593, L10
- Blackburn et al. (2015) Blackburn, L., Briggs, M. S., Camp, J., et al. 2015, ApJS, 217, 8
- Blackburn et al. (2013) —. 2013, ArXiv e-prints, arXiv:1303.2174
- Burgess et al. (2016) Burgess, J. M., Yu, H.-F., Greiner, J., & Mortlock, D. J. 2016, ArXiv e-prints, arXiv:1610.07385
- Connaughton et al. (2015) Connaughton, V., Briggs, M. S., Goldstein, A., et al. 2015, ApJS, 216, 32
- Connaughton et al. (2016) Connaughton, V., Burns, E., Goldstein, A., et al. 2016, ApJ, 826, L6
- Goldstein et al. (2016) Goldstein, A., Burns, E., Hamburg, R., et al. 2016, ArXiv e-prints, arXiv:1612.02395
- Greiner et al. (2016) Greiner, J., Burgess, J. M., Savchenko, V., & Yu, H.-F. 2016, ApJ, 827, L38
- LIGO Scientific Collaboration et al. (2015) LIGO Scientific Collaboration, Aasi, J., Abbott, B. P., et al. 2015, Classical and Quantum Gravity, 32, 074001
- Meegan et al. (2009) Meegan, C., Lichti, G., Bhat, P. N., et al. 2009, ApJ, 702, 791
- Racusin et al. (2017) Racusin, J. L., Burns, E., Goldstein, A., et al. 2017, ApJ, 835, 82
- Savchenko et al. (2016) Savchenko, V., Ferrigno, C., Mereghetti, S., et al. 2016, ApJ, 820, L36
- Siellez et al. (2014) Siellez, K., Boër, M., & Gendre, B. 2014, MNRAS, 437, 649
- Tavani et al. (2016) Tavani, M., Pittori, C., Verrecchia, F., et al. 2016, ArXiv e-prints, arXiv:1604.00955
- The LIGO Scientific Collaboration et al. (2017) The LIGO Scientific Collaboration, the Virgo Collaboration, Abbott, B. P., et al. 2017, ArXiv e-prints, arXiv:1706.01812
- Xiong (2016) Xiong, S. 2016, ArXiv e-prints, arXiv:1605.05447