Phase-synchronous undersampling in nonlinear spectroscopy
Abstract
We introduce the concept of phase-synchronous undersampling in nonlinear spectroscopy. The respective theory is presented and validated experimentally in a phase-modulated quantum beat experiment by sampling high phase modulation frequencies with low laser repetition rates. The advantage of undersampling in terms of signal quality and reduced acquisition time is demonstrated and breakdown conditions are identified. The presented method is particularly beneficial for experimental setups with limited signal/detection rates.
Ultrafast nonlinear spectroscopy in the time domain has emerged as a powerful tool to study photophysical and photochemical processes in real-time with high spectro-temporal resolution Cho (2008); Nuernberger et al. (2015). To meet the demand on interferometric phase stability, necessary in this type of spectroscopy, numerous stabilization methods have been developed in the past years Fuller and Ogilvie (2015). Among these, one particularly efficient concept is the phase modulation (PM) technique, as demonstrated in pump-probe and multidimensional spectroscopy Tekavec et al. (2006); Bruder et al. (2015a, b); Tekavec et al. (2007); Widom et al. (2013); Nardin et al. (2013); Karki et al. (2014); Li et al. (2016). This method combines acousto-optical PM with lock-in detection which drastically reduces the demands on phase stability and greatly improves the overall sensitivity. As an additional advantage, it can be combined with ’action’ signals for detection, e.g. fluorescence Tekavec et al. (2007); Widom et al. (2013); Bruder et al. (2015b), photocurrent Nardin et al. (2013); Karki et al. (2014); Li et al. (2016) and mass-resolved photoion detection Bruder et al. (2015a), which improves selectivity and facilitates studies at low particle densities.
An integral part of the PM technique is the lock-in detection which relays on modulating a signal with a well-defined frequency, followed by demodulation with a lock-in amplifier (LIA). This scheme works most efficient with high modulation frequencies. However, due to the Nyquist theorem, the modulation frequency is generally limited by the sampling rate of the experimental apparatus. In spectroscopy, limiting factors typically are the signal count rate, the speed of detectors or the laser repetition rate. This constrains the combination of lock-in detection with CCD camera based detection schemes (e.g. dispersed fluorescence Augulis and Zigmantas (2011), velocity map imaging detection Eppink and Parker (1997)) and, more severely, limits the technique to high repetition rate laser systems ( kHz Tekavec et al. (2006, 2007)). Yet, many applications still require operation at low sampling rates ( kHz). In particular, in the XUV spectral range, where the PM technique shows great promise in facilitating nonlinear spectroscopy Bruder et al. (2017), laser sources operate mostly at 0.01-1 kHz.
A common strategy to overcome the Nyquist limit is undersampling, as proposed in some lock-in detection schemes, e.g. in lock-in thermography Breitenstein and Langenkamp (2003), electrical impedance spectroscopy Hartov et al. (2000), in combination with random sampling Sonnaillon et al. (2008) and in case of very low signal count rates Fink et al. (2006); Phelps et al. (2013). In this letter, we add to this work by introducing phase-synchronous undersampling (PSU) to the PM technique. We identify optimum undersampling conditions and show explicitly how PSU improves the signal quality in nonlinear spectroscopy. In particular, we demonstrate undersampling by more than two orders of magnitude without loss of performance in signal recovery, hence, providing the opportunity to use the PM technique with sampling rates down to the 10 Hz regime. Our work makes the PM approach thus accessible to a much wider range of experimental setups.
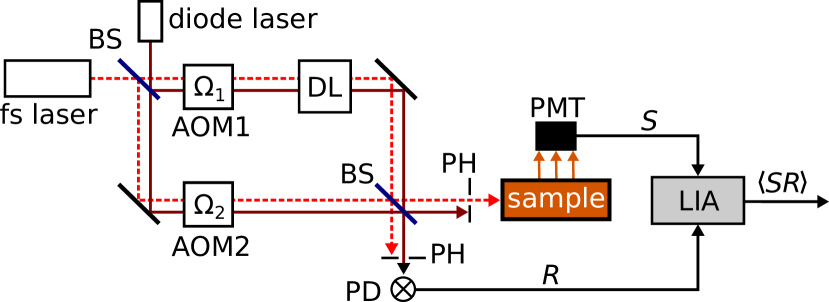
To demonstrate and characterize the PSU concept, we performed quantum beat measurements utilizing the PM technique in pump-probe configuration (Fig. 1). An amplified femtosecond (fs) laser system of variable repetition rate ( kHz) was used, tuned to nm to drive the D1 transition in a low density rubidium vapor. The vapor was contained in a spectroscopy cell of which the fluorescence was detected with a photo multiplier tube (PMT). The PM technique and the experimental setup is described in detail elsewhere Tekavec et al. (2006); Bruder et al. (2015b).
Briefly, a collinear pump-probe pulse sequence is generated in a Mach-Zehnder interferometer. Thereby, a signal modulation () is introduced with two acousto-optical modulators (AOMs) driven phase-locked at the frequency difference . The demodulation of the signal is done with a digital LIA, Stanford Research Systems, model SR 810. To this end, a reference waveform is constructed from a continuous wave (cw) laser (nm) superimposed with the optical path with a slight vertical offset (Fig. 1), as also done in Ref. Nardin et al. (2013). Throughout the data run, the pump-probe delay is incremented in discrete steps and the demodulated signal is recorded as a function of . This yields the temporal evolution of electronic coherences induced in the system and a Fourier transform provides the system’s absorption spectrum.
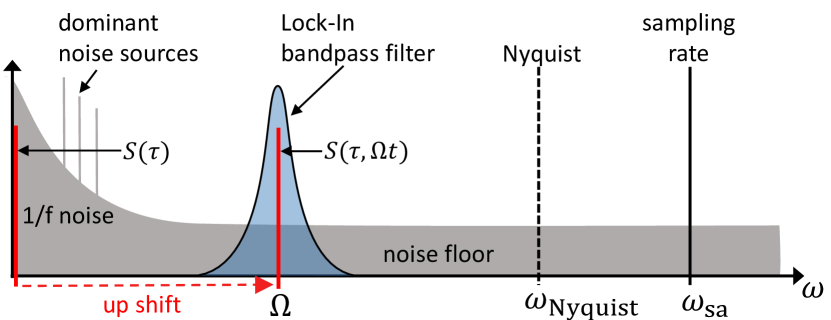
As an important feature, the phase-synchronous detection of and leads to cancellation of phase jitter . Thus, yielding passive phase stabilization while the desired information is deduced from the relative phase shift of and , denoted . As a second signal-to-noise advantage, the imprinted modulation shifts from the low frequency spectrum, which is often dominated by lab noise, to a spectral region with less noise, where filtering is much more efficient (Fig. 2). For this purpose, sufficiently large modulation frequencies ( kHz) are highly desirable. However, if the sampling rate is small, i.e. , the modulation is effectively shifted to its aliased frequency, that is
| (1) |
and the signal-to-noise advantage of using large would vanish. In our PSU scheme, this case is circumvented due to the cw reference waveform used for the demodulation.
For a more detailed discussion of the PSU concept, it is sufficient to consider the excitation of a model two-level system and exemplary examine the demodulation of the in-phase signal component. In this case, the relevant signals and are given by Tekavec et al. (2006)
| (2) | |||||
| (3) |
where and reflect the system properties and denotes the pump-probe dependent phase function of the reference. In the standard lock-in algorithm, and are multiplied and subsequently low-pass filtered (Fig. 3a). The multiplication of the two waveforms yields a signal that consists of a sum- and difference-frequency component:
| (4) |
see also Fig. 3b. While the modulation vanishes in the difference-frequency component, the sum-frequency term exhibits a -modulation. The subsequent RC-type low pass filter can be described by a moving average over a given time interval, denoted Sonnaillon et al. (2008). This removes the sum frequency component and thus the residual demodulated signal is
| (5) |
Note, that contains the desired information, that is and , while correlated phase jitter is removed ().
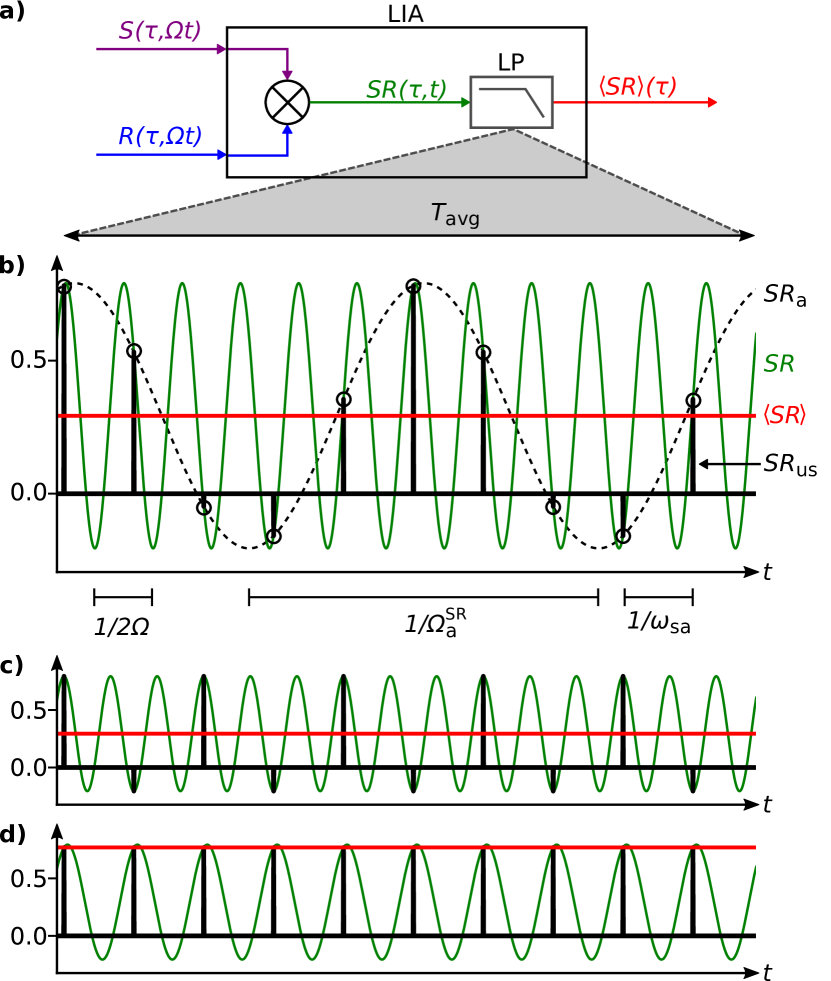
Now, if operating in the undersampling regime, would appear at the respective aliased frequency () and since exhibits a different frequency (), one would intuitively expect that the LIA blocks with high extinction ratio. However, in the lock-in amplification process, undersampling of simply leads to an undersampled product waveform of (Fig. 3b). The resulting aliased waveform exhibits the correct average value of , scaled according to the sampling duty cycle. Hence, as long as the mean value is calculated over a sufficient number of aliased periods, i.e. , the LIA will return a correct output signal . This explains why the PSU approach works in the PM technique.
Note, even though is undersampled, the lock-in demodulation is performed with respect to the fully sampled frequency . Whereas, in case and are both undersampled, the phase-locked loop of the LIA will synthesize a reference waveform oscillating with . Hence, the demodulation will be performed at the aliased frequency, which is of disadvantage in the signal recovery process (cf. Fig.2). Therefore, using a cw reference signal is essential.
From the presented model, one may derive the optimum and breakdown conditions for undersampling. The PSU scheme works best if is maximized and breaks down if . Since is modulated at , its undersampled frequency follows from Eq. 1 under consideration of a factor of 2, which yields two extreme cases:
| (6) | ||||||
| (7) |
. (i) describes the optimum undersampling condition, where reaches its maximum value and the LIA will recover the original signal correctly for minimal averaging times (Fig. 3c). (ii) is the breakdown case. Here, each sampling point of will be at the same phase position, leading to an output signal that strongly depends on the phase offset between the imprinted phase modulation and the sampling points (Fig. 3d).
The discussed model for PSU has been systematically investigated in our experimental setup. To this end, we performed pump-probe scans of 0-10 ps, Fourier transformed the time-domain traces and evaluated their signal-to-noise ratio (SNR), defined as the ratio of the peak amplitude (D1 line) divided by the noise floor. The noise floor was deduced by calculating the mean value of the background signal in the Fourier spectrum and adding three times its standard deviation. Error bars were estimated from the scattering of a single data point exemplary measured for ten consecutive times. While all other parameters were kept fixed in the experiment, the influence of the parameters , and was investigated. In our setup, signal rates were sufficiently high and a fast photo detector was used, therefore is defined by the laser repetition rate which was varied by pulse picking. was varied by changing the lock-in time constant and keeping the filter roll-off at 6 dB.
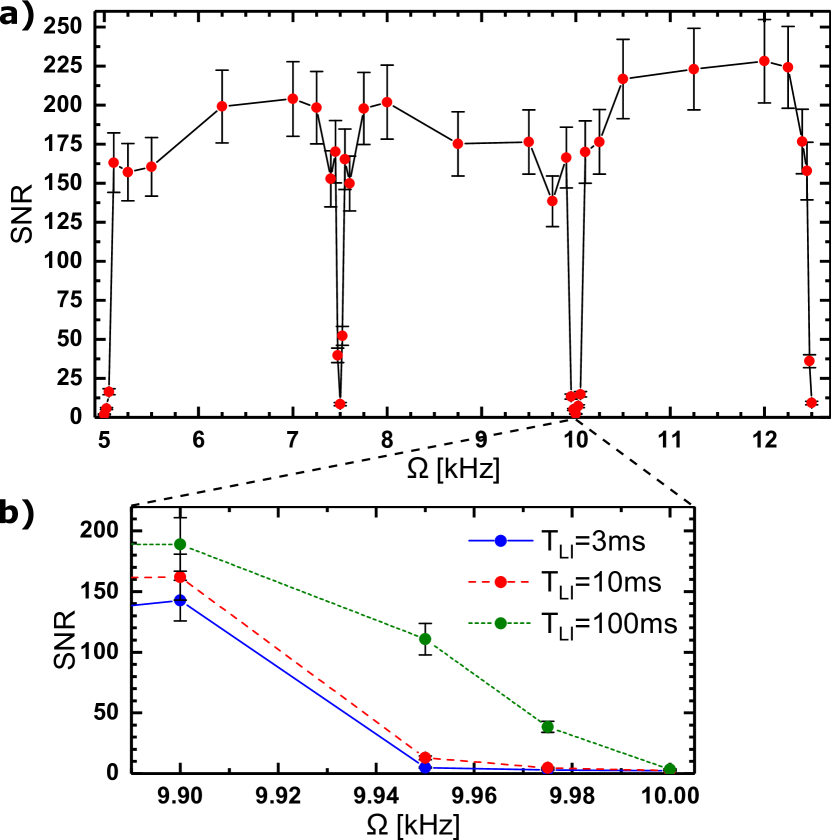
At first, the undersampling cases (i) and (ii) are characterized. Fig. 4a shows a scan of the modulation frequency for a fixed laser repetition rate of kHz and a lock-in time constant of ms. As expected, for condition (ii), the SNR drastically decreases. This gives rise to ’forbidden’ sampling frequencies at multiplies of the Nyquist frequency, in accordance to previous reports Krapez (1998). In between, the SNR forms a plateau centered at condition (i). The fairly large scattering of SNR values in the plateau region stems from fluctuating experimental conditions. These induce significant variations in the signal, due to the relatively short filter time constant used in this measurement series.
Fig. 4b shows the comparison of different filter times for a zoom on a forbidden frequency. With increasing filter time, i.e. increasing averaging time interval , the slope becomes steeper. This is in accordance with the PSU model, as it predicts, that with increasing , smaller aliased frequencies will still lead to a correct demodulated output signal (cf. Fig. 3b-d). Note, that in general, lower sampling rates lead to more narrow SNR plateaus, making it more difficult to find ideal undersampling conditions. This can be diminished to some extend using larger lock-in time constants (Fig. 4b). As such, we were able to work also at Hz, s without significant loss of performance.
In overall, with this measurement series we have confirmed the theory of PSU. For the discussed extreme cases (i) and (ii), the experiment behaves as predicted and the qualitatively correct dependency on the average time interval/lock-in filter time constant has been shown.
In a second study, we focused on the actual signal-to-noise advantage of PSU. To this end, we compared for two sampling rates ( and 5 kHz) a scan of from 50 Hz to 41.25 kHz. The ratio was chosen such, that condition (i) was always met. Furthermore, we used ms, i.e. and at low modulation frequencies ( Hz), the LIA was set to sync mode.
Fig. 5 shows the result. At low modulation frequencies ( Hz) the SNR decreases whereas at high frequencies the data quality remains constant, even for very high undersampling factors (demonstrated up to a factor of 166). Thus, the PSU concept allows choosing very high modulation frequencies without loss of performance. Interestingly, for kHz (blue), the optimum SNR value can be reached within the fully sampled regime, however, this is not the case for the kHz data (red). Hence, in case of low sampling/laser repetition rates, undersampling clearly improves the signal quality.
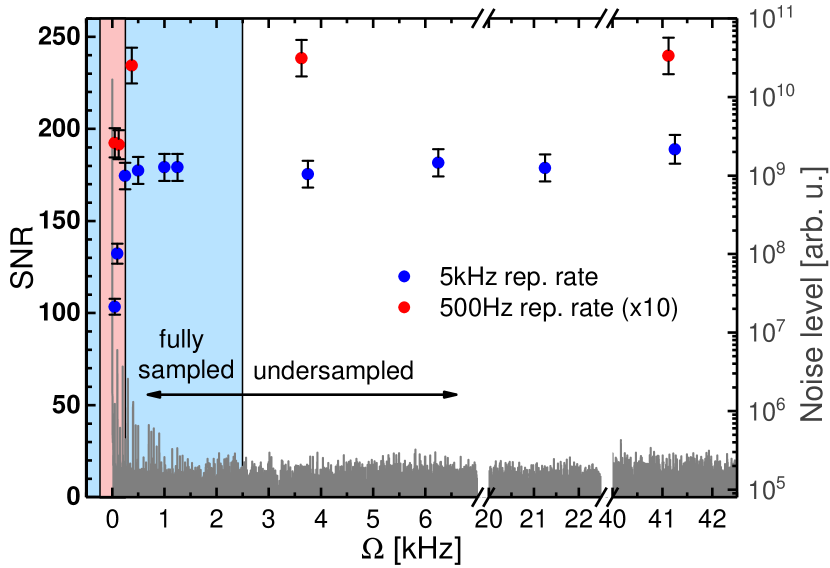
The reduction of the SNR at low frequencies has two reasons. One is due to the forbidden frequency at 0 Hz. As discussed, larger lock-in time constants would attenuate this effect. However, this comes at the price of longer lock-in settling times and hence, increasing acquisition times. For instance, in order to reach in the fully sampled regime the same SNR as obtained in the undersampled case (referring to red data, Fig 5), the acquisition time would increase by roughly an order of magnitude.
The other and more important reason, however, is the increasing lab noise at low frequencies. To visualize this, the lab noise spectrum was deduced from a Fourier analysis of the reference signal at a fixed pump-probe delay (Fig. 5). Note, the noise spectrum is plotted in a log scale while the SNR is given in a linear scale. In nonlinear spectroscopy, low frequency noise sources coming, for instance, from the power line, harmonics thereof, ground loops or mechanical vibrations, can easily dominate the signal at low frequencies. In this regard, shifting the signal to higher frequencies clearly improves the data quality, as confirmed by our measurements.
For high modulation frequencies, we find, that the signal amplitude is damped due to the bandwidth limit of the detection electronics (not shown). This is surprising, since the electronics should only sense the aliased frequency of the signal . We explain this by phase jitter in the signal modulation caused by phase fluctuations in the optical interferometer. This phase/timing jitter relative to the laser shots can lead to high frequency signal components which are damped according to the bandwidth limitation of detection electronics, thus reducing the overall signal.
We point out, that in the applied lock-in detection, the signal quality depends in a non-trivial way on two factors, that is the general signal recovery capability of the lock-in algorithm and the accompanied phase stabilization effect. As such, results from undersampling strategies proposed in other fields Hartov et al. (2000); Breitenstein and Langenkamp (2003) are not directly transferable. Our work thus introduces a new detection concept in phase-modulated nonlinear spectroscopy. In the presented study, the sampling rate was determined by the laser repetition rate, however, the PSU scheme also works if the sampling rate is limited by other factors, e.g. detector speeds or low signal count rates.
In conclusion, phase synchronous detection with a LIA has particular advantages in nonlinear spectroscopy as it greatly improves sensitivity and at the same time introduces passive phase stabilization. In this context, we have introduced the concept of PSU for nonlinear spectroscopy which facilitates efficient lock-in detection at high modulation frequencies (kHz) while using sampling rates down to the 10 Hz regime. We have identified and experimentally verified the optimum and breakdown conditions in this approach and demonstrated that PSU improves the signal quality and increases acquisition speed, especially if the experimental apparatus is limited to low sampling rates ( Hz). Limiting factors are often the laser repetition rate, slow detectors or low signal count rates, hence, our concept makes the PM technique feasible for much more experimental setups. In particular, the application in nonlinear XUV spectroscopy may have great potential Bruder et al. (2017).
Funding. Bundesministerium für Bildung und Forschung (BMBF), project 05K16VFB; Deutsche Forschungsgemeinschaft (DFG), program IRTG 2079
References
- Cho (2008) M. Cho, Chem. Rev. 108, 1331 (2008).
- Nuernberger et al. (2015) P. Nuernberger, S. Ruetzel, and T. Brixner, Angew. Chem. Int. Ed. 54, 11368 (2015).
- Fuller and Ogilvie (2015) F. D. Fuller and J. P. Ogilvie, Annu. Rev. Phys. Chem. 66, 667 (2015).
- Tekavec et al. (2006) P. F. Tekavec, T. R. Dyke, and A. H. Marcus, J. Chem. Phys. 125, 194303 (2006).
- Bruder et al. (2015a) L. Bruder, M. Mudrich, and F. Stienkemeier, Phys. Chem. Chem. Phys. 17, 23877 (2015a).
- Bruder et al. (2015b) L. Bruder, M. Binz, and F. Stienkemeier, Phys. Rev. A 92, 053412 (2015b).
- Tekavec et al. (2007) P. F. Tekavec, G. A. Lott, and A. H. Marcus, J. Chem. Phys. 127, 214307 (2007).
- Widom et al. (2013) J. R. Widom, N. P. Johnson, P. H. v. Hippel, and A. H. Marcus, New J. Phys. 15, 025028 (2013).
- Nardin et al. (2013) G. Nardin, T. M. Autry, K. L. Silverman, and S. T. Cundiff, Opt. Express 21, 28617 (2013).
- Karki et al. (2014) K. J. Karki, J. R. Widom, J. Seibt, I. Moody, M. C. Lonergan, T. Pullerits, and A. H. Marcus, Nat. Commun. 5, 5869 (2014).
- Li et al. (2016) H. Li, A. Gauthier-Houle, P. Gregoire, E. Vella, C. Silva-Acuna, and E. R. Bittner, Chemical Physics Quantum Dynamics and Femtosecond Spectroscopy dedicated to Prof. Vladimir Y. Chernyak on the occasion of his 60th birthday, 481, 281 (2016).
- Augulis and Zigmantas (2011) R. Augulis and D. Zigmantas, Opt. Express 19, 13126 (2011).
- Eppink and Parker (1997) A. T. J. B. Eppink and D. H. Parker, Review of Scientific Instruments 68, 3477 (1997).
- Bruder et al. (2017) L. Bruder, U. Bangert, and F. Stienkemeier, Opt. Express 25, 5302 (2017).
- Breitenstein and Langenkamp (2003) O. Breitenstein and M. Langenkamp, Lock-in thermography: basics and use for functional diagnostics of electronic components, Springer series in advanced microelectronics (Springer, New York, 2003).
- Hartov et al. (2000) A. Hartov, R. A. Mazzarese, F. R. Reiss, T. E. Kerner, K. S. Osterman, D. B. Williams, and K. D. Paulsen, IEEE Trans Biomed Eng 47, 49 (2000).
- Sonnaillon et al. (2008) M. Sonnaillon, R. Urteaga, and F. Bonetto, IEEE Trans. Instrum. Meas. 57, 616 (2008).
- Fink et al. (2006) M. C. Fink, K. V. Adair, M. G. Guenza, and A. H. Marcus, Biophys. J 91, 3482 (2006).
- Phelps et al. (2013) C. Phelps, W. Lee, D. Jose, P. H. v. Hippel, and A. H. Marcus, PNAS 110, 17320 (2013).
- Krapez (1998) J. C. Krapez, in Proc. of the Eurotherm Seminar, Vol. 60 (1998) pp. 7–10.