11email: alessandro.ignesti2@unibo.it 22institutetext: INAF, Istituto di Radioastronomia di Bologna, via Gobetti 101, 40129 Bologna, Italy 33institutetext: Harvard-Smithsonian Center for Astrophysics, 60 Garden Street, Cambridge, MA, 02138, USA 44institutetext: Department of Astronomy, University of Virginia, 530 McCormick Road, Charlottesville, VA 22903, USA 55institutetext: Department of Physics and Astronomy, Minnesota State University, Mankato, MN 56001, USA 66institutetext: Eureka Scientific, Inc., 2452 Delmer Street Suite 100, Oakland, CA 94602-3017, USA
The mystery of the ‘Kite’ radio source in Abell 2626:
insights from new Chandra observations
Abstract
Context. We present the results of a new Chandra study of the galaxy cluster Abell 2626. The radio emission of the cluster shows a complex system of four symmetric arcs without known correlations with the thermal X-ray emission. The mirror symmetry of the radio arcs toward the center and the presence of two optical cores in the central galaxy suggested that they may be created by pairs of precessing radio jets powered by dual AGNs inside the core dominant galaxy. However, previous observations failed to observe the second jetted AGN and the spectral trend due to radiative age along the radio arcs, thus challenging this interpretation.
Aims. The new Chandra observation had several scientific objectives, including the search for the second AGN that would support the jet precession model. We focus here on the detailed study of the local properties of the thermal and non-thermal emission in the proximity of the radio arcs, in order to get more insights into their origin.
Methods. We performed a standard data reduction of the Chandra dataset deriving the radial profiles of temperature, density, pressure and cooling time of the intra-cluster medium. We further analyzed the 2-D distribution of the gas temperature, discovering that the south-western junction of the radio arcs surrounds the cool core of the cluster.
Results. We studied the X-ray surface brightness and spectral profiles across the junction, finding a cold front spatially coincident with the radio arcs. This may suggest a connection between the sloshing of the thermal gas and the nature of the radio filaments, raising new scenarios for their origin. A tantalizing possibility is that the radio arcs trace the projection of a complex surface connecting the sites where electrons are most efficiently reaccelerated by the turbulence that is generated by the gas sloshing. In this case, diffuse emission embedded by the arcs and with extremely steep spectrum should be most visible at very low radio frequencies.
Key Words.:
galaxies: clusters: individual: Abell 2626; galaxies: individual: IC5338, IC5337; galaxies: clusters: intracluster medium; radiation mechanism: thermal; methods: observational1 Introduction
Chandra high-resolution X-ray images of many merging and relaxed clusters revealed that the sloshing of cold sub-clumps of the intra-cluster medium (ICM) may form prominent contact discontinuities, or “cold fronts” (e.g., Markevitch & Vikhlinin 2007). Cold fronts are seen as sharp edges in the cluster X-ray images and temperature maps, and they are identified as temperature discontinuities in pressure balance with the ICM. On the other hand, radio observations revealed that a number of cool-core clusters host a radio mini-halo – a faint, diffuse radio source with a steep spectrum (, where the flux density as a function of frequency is ) and a size comparable to that of the cool-core region (e.g., Feretti et al. 2012; Giacintucci et al. 2017). A number of mechanisms have been proposed for the origin of the relativistic, radio-emitting electrons (e.g., Gitti et al. 2002; Pfrommer & Enßlin 2004, for leptonic and hadronic models, respectively), but the physics of the mechanisms that produces mini-halos is still debated (e.g., Brunetti & Jones 2014).
The galaxy cluster Abell 2626 (hereafter A2626) is a low-redshift (z=0.0553 Struble & Rood 1999), regular, poor cluster, with an estimated mass of 1.3 M⊙ and a virial radius of 1.6 Mpc (Mohr et al. 1996). The most luminous galaxy is the central dominant (cD) galaxy IC5338, which hosts a pair of optical nuclei with a projected separation of 3.5 arcsec, of which only the southern one has a counterpart also in the radio (Owen et al. 1995) and hard X-ray bands (see Wong et al. 2008, Fig. 3). A2626 also hosts the S0 galaxy IC5337, that has been previously classified as a jelly-fish galaxy by Poggianti et al. (2016) for its optical properties. In the X-ray band, A2626 appears as a relaxed cluster with a roundish morphology. It is a cool-core cluster with estimated X-ray luminosity of erg s-1 and mass accretion rate of 4 M⊙ yr-1 (e.g., Bravi et al. 2016). On the other hand, in the radio band A2626 shows a peculiar, extended emission with arc-like, symmetric features forming a striking kite-like global morphology (Gitti et al. 2004; Gitti 2013; Kale & Gitti 2017; Ignesti et al. 2017), whose origin is still unclear. Initially, Gitti et al. (2004) proposed that the cluster hosts a candidate radio mini-halo embedding the northern (N) and southern (S) arcs, whereas Wong et al. (2008) argued that the such elongated radio features may be produced by jet precession triggered by the reciprocal gravitational interactions of the two cores of the cD galaxy. Their scenario was proposed when only the N ans S arcs were known. However, the subsequent discovery of the third (Gitti 2013) and fourth (Kale & Gitti 2017) radio arc to the west (W) and east (E) directions, respectively, and the estimated time scales of the precession period (Ignesti et al. 2017) challenged this model.
In this work we present the analysis of the new Chandra observations of A2626, searching for the evidence of a second AGN that may explain the second pair of radio arcs, and for correlations between the thermal and non-thermal plasma in the radio arc regions. We adopt a cosmology with km , . The cluster luminosity distance is 246.8 Mpc, and the angular scale is 1 arcsec = 1.1 kpc111http://www.astro.ucla.edu/7Ewright/CosmoCalc.html. The confidence level of the reported values is 90 (1.64 ).
2 Observation and Data Reduction
A2626 has been observed with the Chandra space observatory in October 2013 for 110 ks (ObsID: 16136, PI: C. Sarazin). The dataset was reprocessed with CIAO v4.8 using CALDB v2.7.2 and corrected for known time-dependent gain and charge transfer inefficiency problems following techniques similar to those described in the Chandra analysis threads222http://cxc.harvard.edu/ciao/threads/index.html. In order to filter out strong background flares, we also applied screening of the event files, slightly reducing the effective observation time to 109 ks. We used blank-sky background files normalized to the count rate of the source image in the 10-12 keV band for background subtraction. Finally, we identified and removed the point sources using the CIAO task WAVDETECT, with the detection threshold set to the default value of .
3 Results
In this work we focus on the results of our analysis concerning the correlations of the local properties of the ICM with the radio arcs, in order to get more insights into their origin. In particular, after an analysis of the global properties of the cluster, we analyzed the 2-D distribution of the thermal properties of the ICM in the proximity of the radio arcs. In Figs. 1 and 3 we overlay the 1.4 GHz radio emission (from Gitti 2013) imaged at slightly different resolutions, depending on the specific aim of each image.
3.1 Global X-ray properties
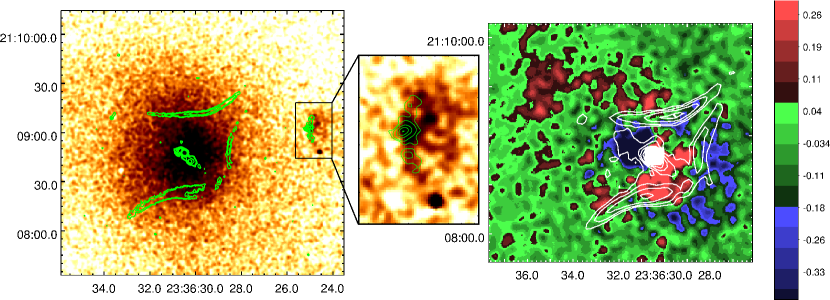
We report in Fig. 1 (left panel) the 0.5-2.0 keV raw image of A2626 smoothed with a gaussian filter. We detected three point sources associated with A2626, the southern core of IC5338 (23h 36m 30.5s, +21d 08m 47.7s), the core of IC5337 (23h 36m 25.0s, +21d 09m 2.9s) and one in the south tail of IC5337 (23h 36m 24.6s, +21d 08m 48.4s) that does not have a radio counterpart. We did not detect any hard (2.0-10.0 keV) X-ray emission associated to northern core of IC5338, in agreement with the results of Wong et al. (2008). By considering the contribution of the thermal emission of the ICM and the instrumental background, we could estimate an upper limit for its X-ray luminosity of erg s-1 (0.5-7.0 keV band). Therefore, we cannot find evidence that the second pair of radio arcs are due to a second AGN, although it could be that the AGN has just turned off.

We extracted the azimuthally-averaged radial temperature profile in circular annuli (Fig. 2), that reveals that the temperature decreases from a maximum value of 3.4 keV to 2.6 keV towards the center, with a discontinuity at 30 kpc. We observed a second temperature drop in the outermost bin at 170 kpc. The possible cause of this drop will be discussed in Section 3.2 .
In order to study the dynamical state of the cluster, we estimated the cooling time radial profile based on the temperature and density radial profiles. The cooling time is the time-scale of the cooling processes acting in the ICM and it can be derived as follows (e.g., Gitti et al. 2012):
| (1) |
where is the adiabatic index, is the mean molecular weigh, is the hydrogen mass fraction of the ICM, and are the electron density of the ICM and the cooling function (e.g., Sutherland & Dopita 1993) at the radius . The radius at which the cooling time is 3 Gyr is typically called cooling radius, , and it delimits the cool core that is the region where the cooling processes are efficient. We estimated 23 kpc, in agreement with Bravi et al. (2016). We then extracted the spectrum of the whole cluster inside to estimate its cooling luminosity and the mass accretion rate. We fitted the spectrum with the wabs(apec+mkcflow) model in Xspec v.12.9, where the mkcflow model takes into account an isobaric multi-phase cooling flow component in addition to the thermal emission of the ICM modeled by apec (Arnaud 1996). We concluded that A2626 is a weak cooling flow cluster, with a mass accretion rate of 2.50.8 M⊙ yr-1 and a cooling luminosity of 4.2 erg s-1 in the 0.5-7 keV energy band. The mean temperature inside is 2.40.1 keV. These results are in agreement with Wong et al. (2008) and Bravi et al. (2016).
In order to search for correlations with the radio arcs, we carried out a morphological analysis by subtracting a 2-D -model (Cavaliere & Fusco-Femiano 1976) of surface brightness (SB) distribution to highlight over-densities or depressions in the ICM distribution. We performed this operation with the software SHERPA of CIAO v4.9. The best-fit values for the core radius, , the index , and the amplitude, , are arcsec, , and counts s-1 arcmin-2. The SB model has been centered on the southern nucleus of IC5338 and the emission of the core of IC5338 and IC5337 has been masked because it was not related to the cluster thermal emission. We also performed a fit with a double -model, usually adopted for cool-core clusters (e.g., Xue & Wu 2000), finding that the addition of a second component does not significantly improve the fit.
In Fig.1 (right panel) we report the residual map with the 1.4 GHz radio contours overlaid (from Fig. 3 of Gitti 2013). This map shows that there is an emission excess, which is related to an over-density of the ICM, that is remarkably delimited by the south-western (SW) junction of the radio arcs. On a larger scale to the north, the map shows another over-density with a spiral-like morphology. We also observe a depression on the east of the core that was already noticed by Shin et al. (2016), who argued that it may be related to AGN activities. We are cautious about claiming the detection of a cavity, because we cannot exclude that it may be an artifact produced by the asymmetrical SB distribution around the core, similar to the sub-density seen outside of the SW junction. However, the spatial connection of the X-ray depression with the central radio emission (Fig. 1, right panel) may support its interpretation as a radio-filled cavity.
3.2 Spectral temperature map
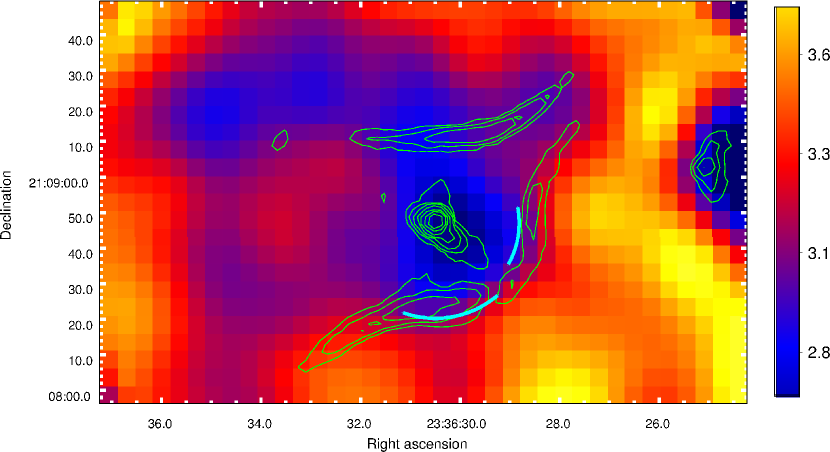
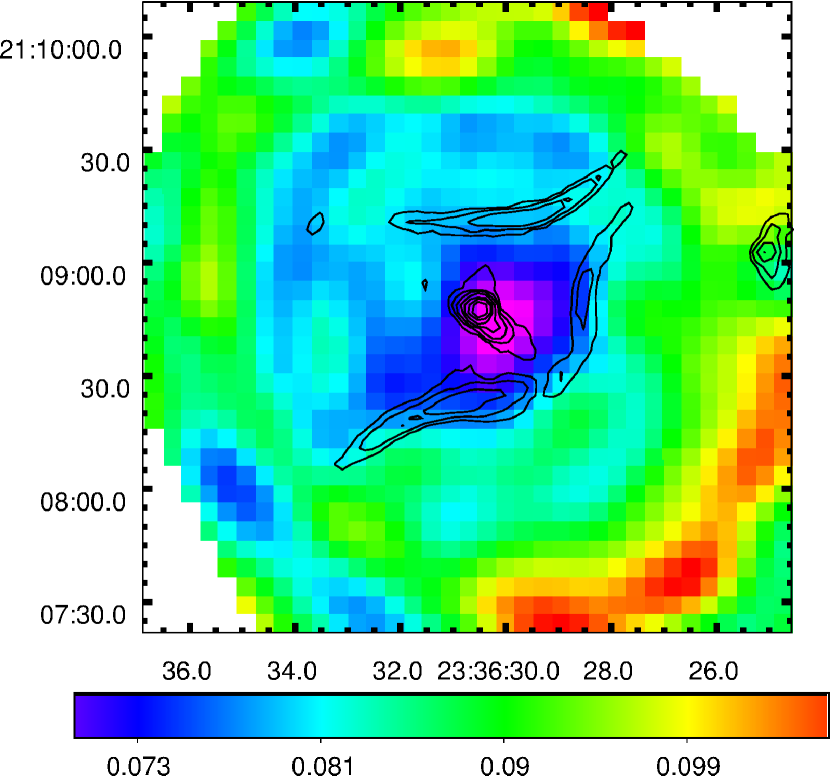
The spectral temperature map shown in Fig. 3 (top) was created by using the techniques described in O’Sullivan et al. (2011). The map pixels are (10 ACIS physical pixels) square. The value in each pixel is the best-fitting temperature obtained from an absorbed apec model fit to a spectrum extracted from a circular region centred on the pixel, with a radius chosen to ensure that it contains at least 1500 net counts. The effective resolution of the map is therefore determined by the size of the extraction regions, whose radii range from in the cluster centre to in the outskirts. Since the spectral extraction regions are larger than the map pixels, individual pixel values are not independent and the maps are, thus, analogous to adaptively smoothed images, with more smoothing in regions of lower surface brightness. In the bottom-right panel of Fig. 3 we report the relative error map. To produce this map we divided the mean error in each pixel, which corresponds to the arithmetic mean between the 1- upper and lower bounds, by the best-fit temperature in that pixel. Uncertainties on the kT measurements range from to .
In Fig. 3 (top panel) we also report the contours of the radio emission at 1.4 GHz to identify possible correlations between the radio arcs and the ICM. This map shows that the ICM exhibits an inner cold region with 2.8 keV and an outer hot region with 3.4 keV. Remarkably, the edge of these regions coincides with the SW junction of the radio arcs. On the opposite direction, the cold ICM is not confined to the inner part of A2626, but it is elongated outside in a spiral-like shape that coincides with the northern spiral feature observed in the SB residual map (Fig. 1, right panel) and resembles the cold spirals often related to the sloshing of the ICM (e.g. Markevitch & Vikhlinin 2007).
The temperature map also shows that IC5337 is leaving a trail of cold plasma (2.3 keV). Our result, in agreement with Wong et al. (2008), may confirm that the jelly-fish galaxy is losing its cold atmosphere due to the interactions with the ICM. The accurate study of IC5337 is the object of a paper in preparation.
Lastly, we note the presence of a cold feature to the south-west edge of the map (not shown in Fig. 3, top panel) located at the same radial distance as the last annulus of the temperature profile (Fig. 2). In order to estimate the contribution of this feature to the mean temperature of the last temperature bin, we divided the last annulus in different sectors, including and excluding this feature, and compared the resulting spectral fits. In particular, in a 270 degree-wide sector excluding the feature we measured a temperature of keV, which is higher than the value that we report in the azimuthally-averaged radial profile ( keV). Therefore, we may conclude that the presence of this feature is likely to be the cause of the temperature drop observed in the outermost bin at 170 kpc.
3.3 Analysis of the south-west junction
The SB residual (Fig. 1, right panel) and the spectral temperature (Fig. 3, top) maps show that the ICM physical properties inside the SW radio arcs are different than outside, so we focused our analysis on the region across the SW junction to understand why.
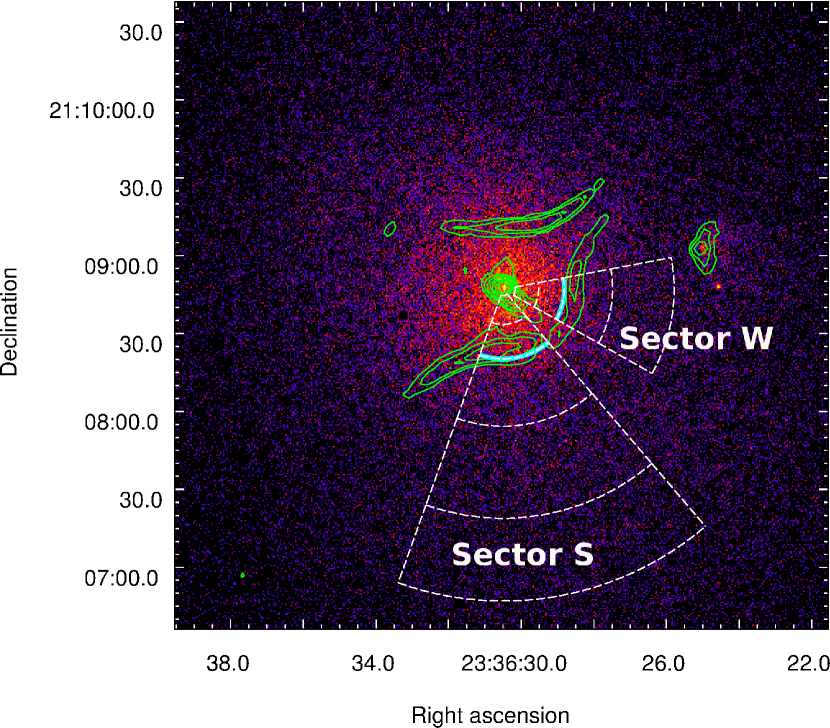
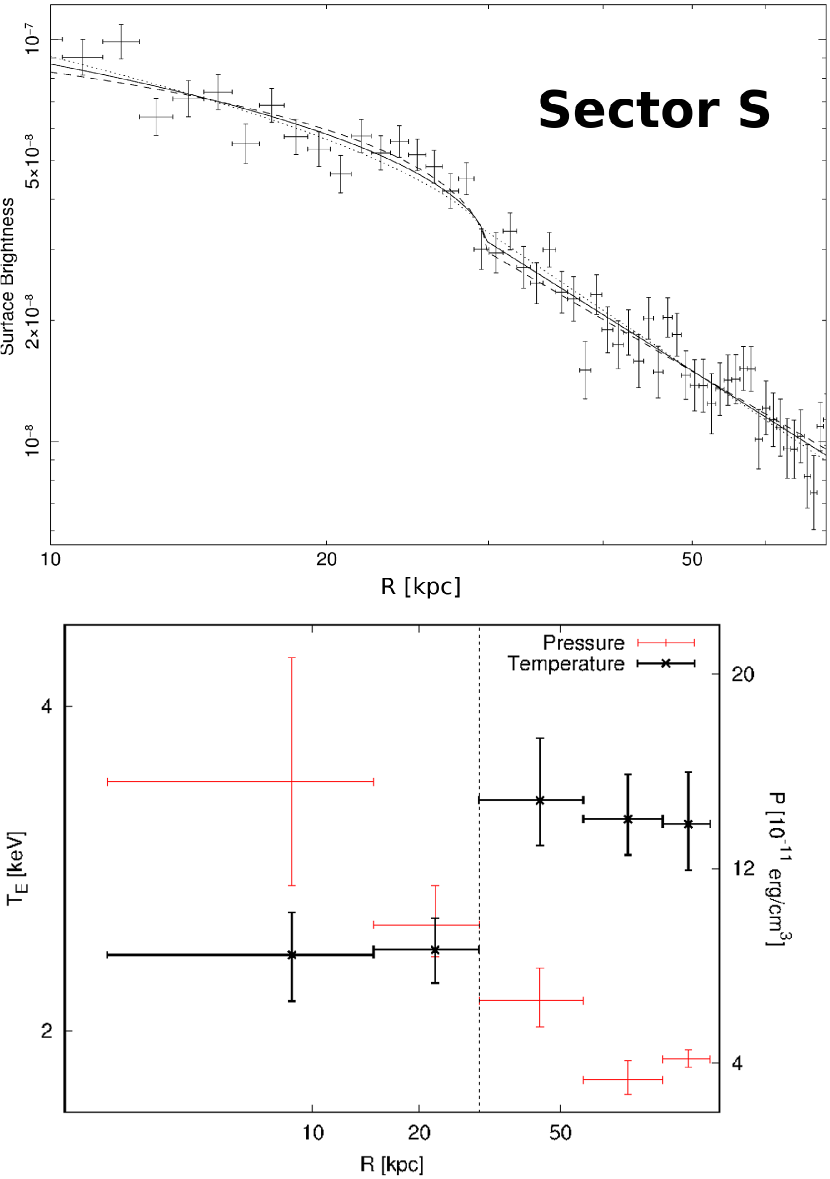
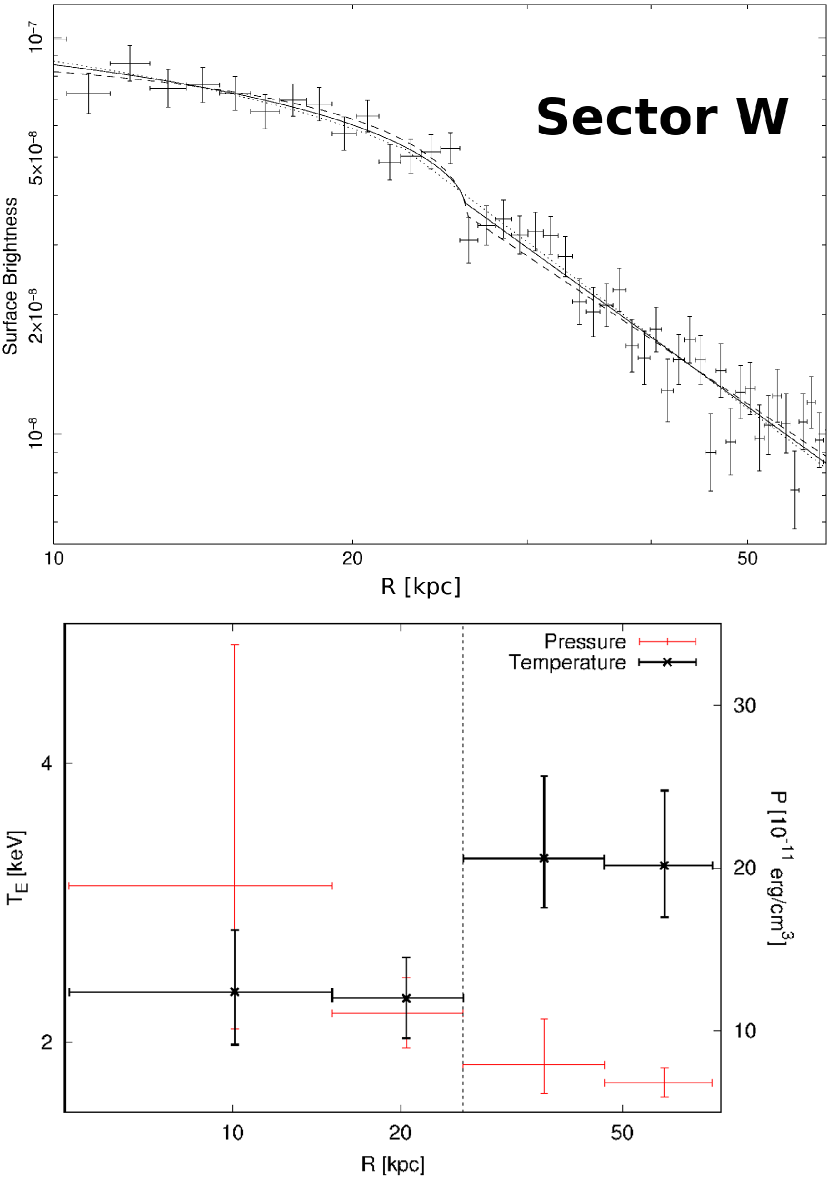
By following the geometry of the cold region observed in Fig. 3, we divided the SW cluster region into several sectors. In these regions we extracted the background-subtracted, exposure-corrected SB radial profiles and we fitted them with a broken power-law model (as described in Nulsen et al. 2005), in order to determine the position of the SB jumps that we observe in the 2-D residual map (Fig. 1, right panel). In two sectors to the south and to the west, which are showed in the bottom-left panel of Fig. 3 labeled as ‘Sector S’ and ‘ Sector W’, we detected a SB jump located at a distance from the core of 29.5 kpc and 26.4 kpc, respectively. They are associated to a ICM density jump of 1.32 (Sector S) and 1.37 (Sector W), both detected above the 3 level. We checked the solidity of our result by varying the extraction sectors (in both angular width and radial binning), always finding a density jump detection above 3.
We then divided the sectors into several annuli, which are reported in Fig. 3 (bottom-left panel), to extract the ICM temperature, density and pressure radial profiles, by fitting the spectra of each annulus with both the projected wabsapec and the de-projected projctwabsapec Xspec models, and paying attention to place the second and the third annuli across the SB jump. We report the temperature and pressure profiles in Fig. 4. The profiles show that the SB jumps coincide with a significant drop in the temperature toward the center, from 3.42 keV to 2.50 keV in the Sector S and from 3.32 keV to 2.31 keV in the Sector W. We observed the temperature drops in both the projected and de-projected profiles with a confidence level above . The pressure is instead continuous, thus indicating rough pressure balance across the front, that is a signature of the presence of a cold front. Therefore, we argue that A2626 shows a weak cold front in the proximity of the radio arcs. We note that a similar feature has recently been observed in the Perseus cluster (Walker et al. 2017).
4 Discussion and future prospects
In this work, we have analyzed a new Chandra observation of A2626 in order to get insights on the origin of the radio arcs. We have searched for evidence of the AGN activity of the northern core of IC5338, which has been invoked as a possible origin of the arcs west and east, and we have been able to provide an upper limit for its X-ray luminosity, erg s-1. Moreover, we have analyzed the 2-D distribution of the thermal properties of the ICM in order to find possible correlations between the thermal and non-thermal plasma. In this section, we summarize our work and we propose a new qualitative scenario that may explain the origin of the radio arcs.
The new Chandra data presented here led to the discovery of a cold front in the proximity of the SW radio arcs. This is the most important result in our paper. Indeed the spatial coincidence between the cold front (at least the part of the front that is visible) and the SW radio arc may suggest a connection between the radio arcs and the dynamics of the thermal gas.
One possibility is that the arcs are ghost relativistic bubbles shaped and gently compressed (i.e., at low compression rate) by the motion of the gas. The observed morphology may thus arise from the action of complex gas motions at the boundary of the sloshing region on a buoyant cloud of relativistic plasma. If on the one hand this might appear a possible explanation for the SW junction, on the other hand the shape of the arc N (and of the arc E seen in Kale & Gitti 2017) appears more tricky and would require a customized geometry. It is worth to mention that indeed radio filaments with very steep spectrum are seen in LOFAR observations of galaxy clusters with complex gas dynamics (e.g. Shimwell et al. 2016; de Gasperin et al. 2017). The large occurrence of these filaments at low radio frequencies naturally results from their steep spectrum, on the other hand the steep spectrum makes them very rare at higher frequencies. A2626 might indeed be one of these rare cases, where the seed relativistic bubbles that are compressed and advected by gas motion may originate from the radio activity of the AGNs in the core in the last Gyr of so.
At the same time, however, we may also speculate that the arcs are the brightest parts of a mini-halo that is generated in the region of the core bounded by the sloshing cold fronts. A connection between mini-halos and cold fronts has been observed by Mazzotta & Giacintucci (2008). Numerical simulations show that the sloshing of the gas in these regions amplify the magnetic field within the cold front and generates turbulence that may reaccelerate relativistic particles producing mini-halos (ZuHone et al. 2011, 2013). In this scenario the acceleration rates and magnetic fields vary within the volume of the cluster core. The strongest acceleration rates are observed in many cases near the cold front surfaces of the simulated clusters. In fact simulated images show that mini-halos become increasingly patchy and filamentary at frequencies higher than an observed synchrotron frequency (Fig 10-12 in ZuHone et al. 2013). The maximum steepening frequency can be obtained by combining the equations for the momentum-diffusion coefficients (Eq. 33-34 in ZuHone et al. 2013) with the equation for the reacceleration time that is requested to generate synchrotron emission at a given frequency in these models (Eq.14 in Brunetti & Lazarian 2016). In the case of A2626 we estimated:
| (2) |
The parameters , , and are the turbulent velocity, the fraction of turbulent energy in the form of compressive modes, the average wavenumber and the wavenumber associated to the mean free path of the particles, respectively (see ZuHone et al. 2013, for futher details). In Eq. 2 we assumed an homogeneous magnetic field . According to Eq. 2, the frequency of maximum synchrotron emission that we obtain by assuming the normalized values of the parameters is of the order of 700 MHz. Therefore, an observation at this frequency probing for the presence of the mini-halo will be a crucial test for the turbulent acceleration scenario.
It may be that in A2626 the sloshing sustains a process of acceleration of electrons that is less efficient than in other mini-halos. Our observations may be picking up only the boundaries of the mini-halo where turbulence is higher and electrons are reaccelerated with an efficiency that is high enough to produce GHz emission. More specifically, according to Eq. 2, a turbulent velocity km s-1 is needed to produce a steepening frequency GHz that is sufficient to explain the spectrum of the arcs observed between 1.4-3.0 GHz, (, Ignesti et al. 2017). However a decrease of a factor 2 in turbulent velocity would give a steepening frequency about 1 order of magnitude smaller. As a consequence of this, the steep spectrum emission in which the arcs are embedded should be brightest at lower radio frequencies. We note that also in this case explaining the observed shape of the arcs requires a specific 3-D geometry of the gas sloshing. The detailed investigation of the 3-D dynamics of the cold front would require tailored numerical simulations, which are beyond the aim of this paper. On the other hand, the presence of very steep spectrum emission between the arcs may be tested by deep LOFAR observations.
5 Summary and Conclusion
In this paper we report on the analysis of new Chandra observations of the core region of the cluster A2626. The most important result of the paper is the discovery of a cold front. Interestingly this cold front is found in the proximity of the SW radio arcs suggesting a connection between the sloshing of the gas and the origin of the mysterious radio arcs in the cluster.
Radio arcs may be produced by the advection and gentle compression of seed ghost radio bubbles by the gas sloshing in the cold front or they may be the brightest regions of a mini-halo generated in the cold front region of the cluster. The latter hypothesis is somehow supported by numerical simulations of turbulent reacceleration in cold fronts. These simulations show filamentary radio structures arising near the surface of the cold fronts in the case that the reacceleration mechanisms are inefficient to generate emission at the observing frequencies. The expectation of this latter scenario is that diffuse inter-arcs emission with very steep spectrum should be brightest at lower frequencies.
In both cases the kite-like morphology of the radio arcs remain a puzzle and further steps require the use of tailored numerical simulations of sloshing cold fronts to address the 3-D geometry.
Acknowledgments
We thank the Referee for providing a constructive report that has improved the presentation of the results. We thank P. Nulsen for providing the software required to produce the SB fit reported in Fig. 3 and M. Markevitch for useful discussion. AI thanks A. Botteon and G. Lanzuisi for useful discussions. MG, GB acknowledge partial support from PRIN-INAF 2014. EOS was supported in part by NASA grants GO5-16123X and GO6-17121X. CLS was supported in part by NASA Chandra grants GO4-15123X, GO5-16131X, and GO5-16146X. KWW was partially supported by Chandra grants GO5-16125X and GO6-17108X, and NASA ADAP grant NNH16CP10C.
References
- Arnaud (1996) Arnaud, K. A. 1996, in Astronomical Society of the Pacific Conference Series, Vol. 101, Astronomical Data Analysis Software and Systems V, ed. G. H. Jacoby & J. Barnes, 17
- Bravi et al. (2016) Bravi, L., Gitti, M., & Brunetti, G. 2016, MNRAS, 455, L41
- Brunetti & Jones (2014) Brunetti, G. & Jones, T. W. 2014, International Journal of Modern Physics D, 23, 30007
- Brunetti & Lazarian (2016) Brunetti, G. & Lazarian, A. 2016, MNRAS, 458, 2584
- Cavaliere & Fusco-Femiano (1976) Cavaliere, A. & Fusco-Femiano, R. 1976, A&A, 49, 137
- de Gasperin et al. (2017) de Gasperin, F., Intema, H. T., Shimwell, T. W., et al. 2017, ArXiv e-prints
- Feretti et al. (2012) Feretti, L., Giovannini, G., Govoni, F., & Murgia, M. 2012, A&A Rev., 20, 54
- Giacintucci et al. (2017) Giacintucci, S., Markevitch, M., Cassano, R., et al. 2017, ArXiv e-prints
- Gitti (2013) Gitti, M. 2013, MNRAS, 436, L84
- Gitti et al. (2012) Gitti, M., Brighenti, F., & McNamara, B. R. 2012, Advances in Astronomy, 2012
- Gitti et al. (2004) Gitti, M., Brunetti, G., Feretti, L., & Setti, G. 2004, A&A, 417, 1
- Gitti et al. (2002) Gitti, M., Brunetti, G., & Setti, G. 2002, A&A, 386, 456
- Ignesti et al. (2017) Ignesti, A., Gitti, M., Brunetti, G., Feretti, L., & Giovannini, G. 2017, A&A, 604, A21
- Kale & Gitti (2017) Kale, R. & Gitti, M. 2017, MNRAS, 466, L19
- Markevitch & Vikhlinin (2007) Markevitch, M. & Vikhlinin, A. 2007, Phys. Rep, 443, 1
- Mazzotta & Giacintucci (2008) Mazzotta, P. & Giacintucci, S. 2008, ApJ, 675, L9
- Mohr et al. (1996) Mohr, J. J., Geller, M. J., & Wegner, G. 1996, AJ, 112, 1816
- Nulsen et al. (2005) Nulsen, P. E. J., Hambrick, D. C., McNamara, B. R., et al. 2005, ApJ, 625, L9
- O’Sullivan et al. (2011) O’Sullivan, E., Giacintucci, S., David, L. P., Vrtilek, J. M., & Raychaudhury, S. 2011, MNRAS, 411, 1833
- Owen et al. (1995) Owen, F. N., Ledlow, M. J., & Keel, W. C. 1995, AJ, 109, 14
- Pfrommer & Enßlin (2004) Pfrommer, C. & Enßlin, T. A. 2004, A&A, 413, 17
- Poggianti et al. (2016) Poggianti, B. M., Fasano, G., Omizzolo, A., et al. 2016, AJ, 151, 78
- Shimwell et al. (2016) Shimwell, T. W., Luckin, J., Brüggen, M., et al. 2016, MNRAS, 459, 277
- Shin et al. (2016) Shin, J., Woo, J.-H., & Mulchaey, J. S. 2016, ApJS, 227, 31
- Struble & Rood (1999) Struble, M. F. & Rood, H. J. 1999, ApJS, 125, 35
- Sutherland & Dopita (1993) Sutherland, R. S. & Dopita, M. A. 1993, ApJS, 88, 253
- Walker et al. (2017) Walker, S. A., Hlavacek-Larrondo, J., Gendron-Marsolais, M., et al. 2017, MNRAS, 468, 2506
- Wong et al. (2008) Wong, K.-W., Sarazin, C. L., Blanton, E. L., & Reiprich, T. H. 2008, ApJ, 682, 155
- Xue & Wu (2000) Xue, Y.-J. & Wu, X.-P. 2000, MNRAS, 318, 715
- ZuHone et al. (2011) ZuHone, J., Markevitch, M., & Brunetti, G. 2011, ArXiv e-prints
- ZuHone et al. (2013) ZuHone, J. A., Markevitch, M., Brunetti, G., & Giacintucci, S. 2013, ApJ, 762, 78