Constraints on Cosmological Parameters from the Angular Power Spectrum of a Combined 2500 deg2 SPT-SZ and Planck Gravitational Lensing Map
Abstract
We report constraints on cosmological parameters from the angular power spectrum of a cosmic microwave background (CMB) gravitational lensing potential map created using temperature data from 2500 deg2 of South Pole Telescope (SPT) data supplemented with data from Planck in the same sky region, with the statistical power in the combined map primarily from the SPT data. We fit the corresponding lensing angular power spectrum to a model including cold dark matter and a cosmological constant (), and to models with single-parameter extensions to . We find constraints that are comparable to and consistent with constraints found using the full-sky Planck CMB lensing data. Specifically, we find from the lensing data alone with relatively weak priors placed on the other parameters. In combination with primary CMB data from Planck, we explore single-parameter extensions to the model. We find or eV both at 95% confidence, all in good agreement with results from Planck that include the lensing potential as measured by Planck over the full sky. We include two independent free parameters that scale the effect of lensing on the CMB: , which scales the lensing power spectrum in both the lens reconstruction power and in the smearing of the acoustic peaks, and , which scales only the amplitude of the CMB lensing reconstruction power spectrum. We find for the lensing map made from combined SPT and Planck temperature data, indicating that the amount of lensing is in excellent agreement with what is expected from the observed CMB angular power spectrum when not including the information from smearing of the acoustic peaks.
1 Introduction
Gravitational lensing of the cosmic microwave background (CMB) has emerged as a useful cosmological tool. CMB lensing, which probes all structure along a given line of sight, provides complementary information to the primary CMB fluctuations which measure structure at . The sensitivity of CMB lensing peaks at intermediate redshifts (), making it complementary to large-scale structure surveys, the sensitivity of which typically peaks at lower redshifts, and with very different sources of possible systematic errors. Lensing of the CMB was first detected a decade ago (Smith et al., 2007); high signal-to-noise detections have now been achieved by many experiments (Das et al., 2011b; van Engelen et al., 2012; Planck Collaboration et al., 2014b; POLARBEAR Collaboration et al., 2014; BICEP2 Collaboration et al., 2016). For a review of CMB lensing, see Challinor & Lewis (2005).
The fluctuations in the CMB lensing potential form a nearly Gaussian projected field on the sky, with statistical properties determined by the geometry and the history of structure formation in the universe. Because the field is nearly Gaussian, essentially all the information is encoded in the angular power spectrum. The most precise CMB lensing power spectrum measurements to date are from the Planck experiment (Planck Collaboration et al., 2016b).
Cosmological parameter fits that include CMB lensing information are broadly consistent with expectations from the primary CMB measurements alone (Planck Collaboration et al., 2016a). There are, however, mild but interesting tensions () between constraints on cosmology from Planck primary CMB measurements and other cosmological probes. Specifically related to lensing, the amplitude of the matter power spectrum on galaxy scales () inferred from Planck primary CMB data is slightly higher than that determined from cosmic shear measurements (Joudaki et al., 2017; Hildebrandt et al., 2017; Troxel et al., 2017). Further, specifically related to lensing of the CMB, the amount of CMB lensing inferred from the measured smearing of the acoustic peaks is higher than the amount of CMB lensing inferred from the direct measurement of the lensing-induced mode-coupling (Planck Collaboration et al., 2016a). The amplitude of lensing is expected to be a powerful probe of neutrino masses (Abazajian et al., 2015), so discordance in measurements of lensing amplitudes is important for understanding the utility of these measurements as probes of particle physics.
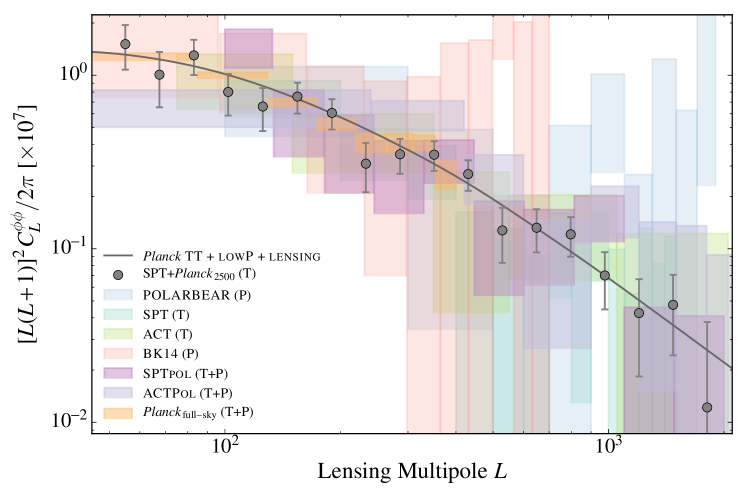
This paper is a companion to Omori et al. 2017, referred to as O17 hereafter. In that work, we obtained a CMB temperature map by combining 150 GHz SPT and 143 GHz Planck data in the 2500 deg2 SPT-SZ survey region, and we used the resulting temperature map to produce a map of the projected gravitational lensing potential. In this paper, we present a cosmological parameter analysis of the CMB lensing power spectrum derived in O17. The power spectrum from O17 is shown in Figure 1, along with other recent measurements, including the full-sky Planck lensing power spectrum.
This work is divided as follows: in §2 we review gravitational lensing of the CMB and reconstruction of the lensing potential; in §3 we describe the CMB temperature data and simulations used for the O17 analysis and for this work; in §4 we describe how the lensing likelihood is constructed, including linear corrections for the unknown true CMB and lensing potential power spectra; in §5 we present the primary result of this paper: constraints on cosmological parameters; we close with a discussion.
Throughout this work, we use the Planck TT + lowP + lensing cosmology111base_plikHM_TT_lowTEB_lensing (Planck Collaboration et al., 2016a) as a fiducial model. This fiducial cosmology is used for generating the simulated data necessary for the lensing reconstruction. All CMB temperature and lensing potential power spectra used in the present analysis have been computed with the CAMB Boltzmann code222http://camb.info - May 2016 version (Lewis et al., 2000).
2 Lensing Reconstruction Framework
In this section, we build the theoretical framework for the lensing likelihood, presenting selected elements from the lensing reconstruction pipeline. A more complete description of the procedure can be found in O17.
2.1 Lensing of CMB Temperature Fluctuations
Gravitational lensing remaps CMB fluctuations in position space (Lewis & Challinor, 2006):
| (1) |
where is the projected gravitational lensing potential and L and U refer to the lensed and unlensed temperature fields respectively. To gain intuition, Equation 1 can be Taylor expanded as
| (2) |
From the second term, it can be seen that the observed lensed temperature has a component that is the gradient of the unlensed field modulated by the lensing deflection . If we transform to harmonic space, Equation 2 would have the second term on the right hand side written as a weighted convolution of the temperature field and the lensing potential, where the harmonic transform for any particular mode for the lensed field could involve a sum over all of the modes of the unlensed field. Lensing thus introduces non-zero off-diagonal elements in the covariance of observed temperature fields in harmonic space (Okamoto & Hu, 2003):
| (3) | |||||
where are the spherical harmonic expansion coefficients of the temperature fields and the coefficients of the projected lensing potential. The weight
characterizes the mode coupling induced by lensing (i.e., the effect of the convolution in Equation 2).
2.2 Lensing Map Reconstruction
The lensing potential can be estimated from observed CMB maps by measuring the lensing-induced mode coupling of Equation 3 between pairs of modes in the observed temperature field (Zaldarriaga & Seljak 1999; Hu & Okamoto 2002). In general, it is best to use pairs in harmonic space that have good signal-to-noise for measuring lensing. For this purpose, it is useful to work with a filtered map: , with the filter for a given CMB power spectrum and an anisotropic (-dependent) noise power spectrum .
A formally optimal estimator (at first order) which maximizes signal to noise in the estimated lensing potential (Hu & Okamoto, 2002) is
| (5) | |||||
We use Equation 5 as our estimator for this analysis. There are other choices (e.g., Namikawa et al. 2013) for how to weight the mode pairs which sacrifice some signal-to-noise but reduce foreground contamination. Lensing reconstruction is done with the quicklens code.333http://github.com/dhanson/quicklens
The relationship between the filtered estimate of the lensing potential resulting from Equation 5 and the true potential can be written as
| (6) |
defining a response function that in general depends on both and . As outlined in O17, this response function has been calibrated using simulations. We estimate the response function by measuring the cross-spectrum of simulated lensing potential outputs with the input lensing potential maps and normalizing by the autospectrum of the inputs.
The true amplitude of mode coupling in the CMB temperature field induced by lensing is sensitive to the true (unknown) temperature power spectrum, as can be seen in Equations 3 and 2.1. What is measured in the data is some amount of mode coupling; to turn this into an estimate of the amplitude of the lensing potential, an assumption is made about the typical amplitudes of the modes being coupled. The response function thus depends on the assumed cosmological parameters. To explore this cosmological dependence, we use an isotropic approximation to the full anisotropic response function and its dependence on cosmology. In the case where both the signal and noise are isotropic (i.e., the CMB signal and noise only depend statistically on and not ), the response function can be written as
| (7) |
where we have indicated extra superscripts on the weight functions for either the true amount of mode coupling () or the assumed amount for our fiducial cosmology (). The filters are calculated for the fiducial cosmology. We use Equation 7 and its dependence on cosmology to determine the cosmology-dependent corrections to the simulation-based response function.
The survey mask, point source mask, and spatially varying noise all violate statistical stationarity in the data, and consequently they introduce mode coupling that can bias the lensing reconstruction. The result is that the lensing reconstruction has a non-zero mean signal—even in the absence of true lensing signal—that depends on the survey geometry, mask, and noise properties. This mean field is calculated using simulations and removed.
After removing the mean field and correcting for the response function, the final estimate of the lensing potential is
| (8) |
2.3 Lensing Autospectrum Estimation
To estimate the angular power spectrum of the CMB lensing map obtained in the previous section, we multiply the estimate by the survey mask (including point source and galaxy cluster masking) and use PolSpice444http://www2.iap.fr/users/hivon/software/PolSpice (Szapudi et al., 2001; Chon et al., 2004) to compute the spectrum of the masked map.
The resulting power spectrum is a biased estimate of the true lensing power spectrum. Known sources of bias include a straightforward noise bias, , that comes from taking an autospectrum of data with noise in it (where “noise” here includes the Gaussian part of the CMB temperature field and any other sky signal), and a bias that arises from ambiguity in exactly which lensing modes are being measured in the power spectrum, (Kesden et al., 2003). The superscript denotes the order of the lensing power spectrum involved: is independent of the true lensing power and only depends on the instrument noise and sky power, while has a linear dependence on the lensing power. As detailed in O17, we calculate these biases using simulations and subtract them from the measured power spectrum:
| (9) |
We use a realization-dependent estimate that takes into account the power in the particular realization but does not depend on the assumed cosmology (Namikawa et al., 2013).
The bias depends linearly on the lensing power and will therefore depend on cosmological parameters. In the flat-sky limit (Das et al., 2011b; Kesden et al., 2003; Planck Collaboration et al., 2014b) and assuming isotropic noise and filtering, the bias is
where the weight is the flat-sky version of Equation 2.1.
There is a dependence on both the true CMB power (just as for ) and the lensing power. To explore this cosmological dependence (below), we will use Equation 2.3 to determine the cosmology-dependent corrections to the that is derived from simulations.
The next-order bias is largely removed by using the lensed theory temperature power spectrum rather than the unlensed spectrum when constructing the lensing estimator (Hanson et al., 2011). There are other biases, such as the bias (Böhm et al., 2016), which are small at the precision of the current work, and will be neglected.
We estimate uncertainties on the lensing power spectrum by averaging over simulations:
| (11) |
This procedure could be used to generate a full covariance matrix, but for this analysis we assume that uncertainties are uncorrelated between bins. This is expected for the relatively large bins that we use and the realization-dependent removal of the bias that strongly reduces the off-diagonal elements of the covariance matrix (Schmittfull et al., 2013).
3 Lensing Data
The binned CMB lensing angular power spectrum (or “lensing bandpowers”) computed in O17, using the methods described in that work and summarized in the previous section, is shown in Figure 1 (along with other recent measurements from the literature), and the bin ranges and bandpower values and uncertainties are listed in Table 1.555https://pole.uchicago.edu/public/data/simard18 We will hereafter refer to this as the “SPT + Planck” lensing measurement.
| 50-60 | 1.51 0.44 |
| 61-74 | 1.01 0.35 |
| 75-91 | 1.30 0.30 |
| 92-112 | 0.80 0.22 |
| 113-138 | 0.66 0.18 |
| 139-170 | 0.75 0.15 |
| 171-209 | 0.61 0.12 |
| 210-256 | 0.309 0.098 |
| 257-315 | 0.350 0.080 |
| 316-386 | 0.348 0.068 |
| 387-474 | 0.269 0.054 |
| 475-582 | 0.128 0.045 |
| 583-715 | 0.132 0.037 |
| 716-877 | 0.121 0.031 |
| 878-1077 | 0.070 0.025 |
| 1078-1322 | 0.043 0.024 |
| 1323-1622 | 0.048 0.023 |
| 1623-1991 | 0.012 0.026 |
The higher angular resolution of SPT greatly increases the lensing signal-to-noise per pixel over Planck from the larger number of available small-scale modes which can be used for measuring the lensing-induced mode coupling. Combining the Planck and SPT temperature maps strongly reduces the uncertainties in particular on small scales (higher ) as compared to using only the SPT data. This happens because the lensing map only uses modes in the temperature map extending to , to minimize possible foreground contamination. The high lensing modes require probing correlations in the temperature angular modes that are widely separated in harmonic space. By using the Planck data to recover the low- modes, there is an increased number of large-separation mode pairs.
As shown in O17, the SPT + Planck measurements over the 2500 deg2 SPT-SZ survey area are more precise than the Planck-only full-sky constraints for . From the relative sky coverage, the Planck-only uncertainties using only the SPT region would be more than three times larger than the Planck-only full-sky constraints. The combined SPT + Planck measurements are thus nearly statistically independent, adding substantial new information.
Small-scale lensing measurements are most susceptible to foreground contamination, as shown in van Engelen et al. (2014). In that work, it was found that foreground contamination increased dramatically beyond for CMB map filtering choices similar to those adopted in O17. For the cosmological parameter estimation in this work, we therefore use the SPT + Planck lensing measurements only below .
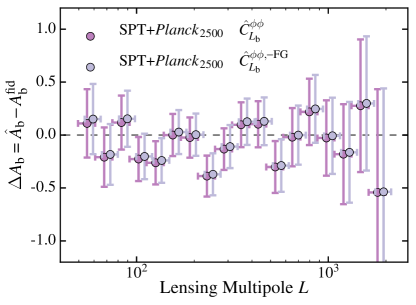
A comparison of the O17 bandpowers with the prediction from the best-fit Planck cosmology is shown in Figure 2. The ratio is shown with and without a correction for foreground contamination, based on van Engelen et al. (2014). The estimated contamination is small, but not completely negligible. The O17 bandpowers are consistent with expectations from Planck, with O17 finding a relative amplitude of for the best-fit Planck TT + lowP + lensing cosmology.
In the likelihood analysis described in the following section, the theory model includes this mean foreground contamination, as well as a term in the covariance to account for uncertainty in the foreground level.
4 Lensing Likelihood
In this section, we describe how we obtain the lensing likelihood function for the SPT + Planck lensing data as a function of cosmological parameters, :
| (12) | |||||
We make the approximation that the reconstructed lensing bandpowers are Gaussian-distributed and uncorrelated between bins, but that there is correlation between bins coming from the uncertainty in the foreground subtraction. We assume that the uncertainty in the residual foreground as reported in van Engelen et al. (2014) is completely correlated between bins, leading to off-diagonal terms in the covariance matrix. The bandpowers correspond to the binned theory lensing power spectrum at a given cosmology , with the foreground template added.
4.1 Linear Corrections
The choice of cosmological model affects the computation of the estimated lensing bandpowers through the calculation of the response function and through the calculation of the bias term. These effects need to be included in the likelihood analysis.
The response function and correction for the fiducial cosmology are obtained using simulations and calculated using two-dimensional, anisotropic weighting. To calculate the cosmological corrections to these terms, we use isotropic approximations to both the response function and the bias (see Equations 7 and 2.3). Within the range of allowed parameters, the cosmological corrections are relatively small, and we expect the error on these corrections from using the isotropic approximation to be negligible.
At a given point in parameter space, we apply the cosmology-dependent response function and corrections to the theory spectrum (Planck Collaboration et al., 2016b):
| (13) |
To obtain these corrections, we use a linear approximation, Taylor-expanding around the response function or bias calculated for the fiducial cosmology. For a temperature or lensing power spectrum that differs by from the fiducial spectrum, we obtain:
| (14) |
where , and
| (15) |
where . The matrices were calculated using binned versions of the temperature and lensing power spectra. In principle there is also a dependence on the temperature power spectrum in the correction, but that term was found to be negligible.
5 Constraints on Cosmological Parameters
Sourced mainly by potential wells at intermediate redshifts, gravitational lensing of the CMB can constrain late-time cosmological parameters affecting the growth of structure and the expansion of the universe, such as neutrino masses (Smith et al., 2006; Abazajian et al., 2015), and as a geometrical effect it can constrain curvature (Sherwin et al., 2011). Because of the combined sensitivity to the geometry and the growth of structure, lensing can break degeneracies between cosmological parameters constrained by CMB alone, including the angular diameter distance degeneracy (Stompor & Efstathiou, 1999).
Recent detections of CMB lensing have proven its significance as a cosmological probe, on its own or in combination with CMB temperature and polarization measurements (Planck Collaboration et al., 2016b, 2014b; van Engelen et al., 2012; Das et al., 2011b). In the following section, we show the most significant improvements on cosmological parameters constraints provided by the SPT + Planck lensing measurements over 2500 deg2 as compared to the full-sky Planck primary CMB measurements on their own.
To determine the posterior probability distributions of the cosmological parameters from SPT + Planck lensing data in combination with CMB data, we use Markov Chain Monte Carlo (MCMC) methods (Christensen et al., 2001) through the publicly available CosmoMC666http://cosmologist.info/cosmomc/ - July 2016 version package (Lewis & Bridle, 2002).
Assuming a spatially flat universe, the properties of a cold dark matter () model can be represented by the following six parameters, which are the base set of parameters to be varied in the chains: the baryon density , the cold dark matter density , the optical depth at reionization , the angular scale of the sound horizon at the surface of last scattering , the amplitude and power-law spectral index of primordial scalar perturbations, both taken at a pivot scale of as chosen in the cosmological parameters analysis of Planck Collaboration et al. (2014a). We will often use parameters derived from these six, including the total matter density .
For constraints based only on lensing, the same priors as in Sherwin et al. (2016) have been applied. When computing constraints combining CMB lensing measurements with primary CMB measurements, the Planck TT and lowP likelihoods have been used, the latter relying on low CMB temperature and polarization data.
5.1 Model
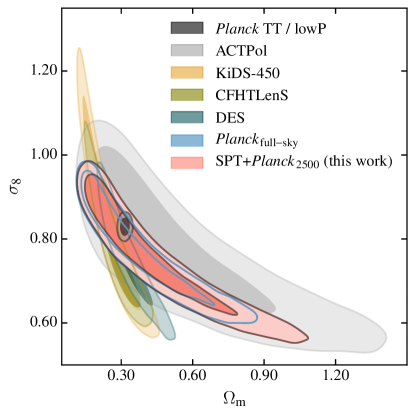
An alternative way to parameterize the amplitude of the matter power spectrum is , the rms mass fluctuation today in 8 Mpc spheres assuming linear theory. This parameter is convenient for comparisons with results from galaxy surveys.
In Figure 3, constraints from lensing experiments, both CMB lensing (Sherwin et al., 2016; Planck Collaboration et al., 2016b) and cosmic shear (Joudaki et al., 2017; Hildebrandt et al., 2017; Troxel et al., 2017), are shown in the plane, compared with expectations from the primary CMB fluctuations as measured by Planck. There have been hints of mild tension between Planck CMB power spectrum constraints and probes of low-redshift structure. The CMB lensing constraints are all highly consistent with each other, and it can be seen that the constraints from this paper (the SPT+Planck CMB lensing data) overlap with both the low-redshift probes and the primary CMB estimates, although the primary CMB data are substantially more precise. In making the CMB-lensing-only constraints, as was done in Planck Collaboration et al. (2016b) and Sherwin et al. (2016), the corrections to the response function were held at the best-fit cosmology corresponding to the Planck TT and lowP likelihoods777base_plikHM_TT_lowTEB (Planck Collaboration et al., 2016a). The close agreement between SPT + Planck and Planck is not simply from the combined SPT + Planck dataset including data from Planck. The SPT + Planck data is based on only 2500 deg2 , and is mainly driven by the SPT data.
Joint constraints on and obtained by combining the CMB lensing data with the primary CMB measurements from Planck are shown in Figure 4. In general, the CMB lensing data (either the full-sky Planck or 2500 deg2 SPT + Planck) prefer lower values of , as could be expected from Figure 3. A commonly used parameter for lensing constraints is . For SPT + Planck we find , in excellent agreement with both the value found using the Planck full-sky lensing reconstruction, (Planck Collaboration et al., 2016b), and the estimate by ACTPol of (Sherwin et al., 2016).
CMB lensing data are most sensitive to overall shifts in the amplitude of matter fluctuations. This amplitude can be expressed as the rms deflection angle . For SPT + Planck, we use the samples from the MCMC chains for to determine that this rms deflection angle is arcmin (68%), in good agreement with the extremely precise measurement of the full-sky Planck survey of .
5.2 Lensing amplitude compared to expectations
Gravitational lensing of the CMB leads to a small amount of smearing of the acoustic oscillations in the primary fluctuations, an effect that has been well-measured (Das et al., 2011a; Keisler et al., 2011). The primary CMB fluctuations as observed by Planck show weak evidence for a slightly elevated amount of lensing-like smearing of the acoustic peaks, although the lensing power directly measured by Planck shows no such excess (Planck Collaboration et al., 2016b). Using the same effect in SPT temperature (Story et al., 2013) and polarization (Henning et al., 2017) power spectra, there was no evidence for such an excess of peak smoothing, with a modest () preference for less lensing than expected.
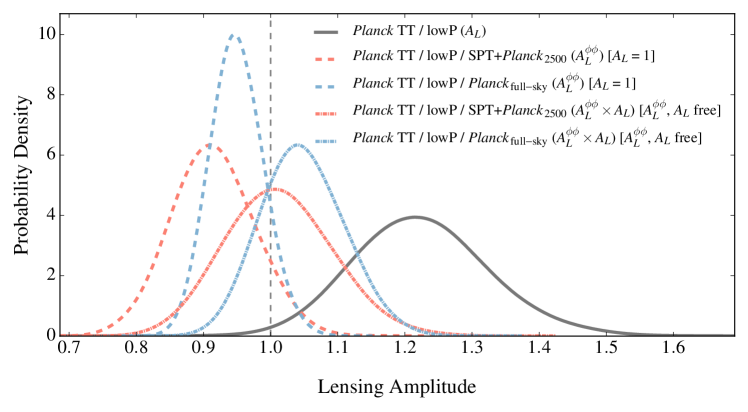
The expected amount of lensing depends on the somewhat uncertain cosmological parameters. To explore this, we marginalize over cosmological parameters and use new parameters to artificially scale the amount of lensing: scales the lensing power spectrum in both the lens reconstruction power and in the smearing of the acoustic peaks, and scales only the amplitude of the CMB lensing reconstruction power spectrum. This parameterization ensures that the parameters that control the predicted degree of lensing (such as and ) are determined without considering the measured amount of peak smearing or mode coupling, and that these measurements are reflected entirely in and .
As these parameters are defined, the prediction for the reconstructed lensing power spectrum gets multiplied by both and . Therefore, the combination represents the amplitude for the lensing power relative to the prediction when the cosmological parameter fits are not sensitive to the observed amount of peak smearing.
With fixed to unity the known preference in the Planck primary data for will instead drive a preference for models with higher intrinsic lensing amplitudes, leading to a preference for lower values of when compared with lensing reconstruction measurements that are otherwise consistent with . When is free, the peak-smoothing preference for increases the predicted lensing reconstruction power and therefore causes a lower for a given model compared with the lensing power spectrum measurement. The combination thus gives the amplitude of the lensing power spectrum compared to Planck-allowed predictions when the peak smoothing effect is not reflected in the Planck constraints.
Posterior distributions for , , and from chains using combinations of Planck primary CMB data, the Planck lensing power spectrum, and the lensing power spectrum in this work are shown in Figure 5. For models with =1 the measured SPT + Planck lensing power spectrum is somewhat low, with . The CMB lensing reconstruction power spectrum measurements show no evidence for an anomalous amount of lensing relative to the amount predicted from the best-fit parameters determined in the primary CMB data when the peak smearing effect has been marginalized over. Using SPT + Planck data, we find relative to the predicted level of lensing for marginalized over ; using the full-sky Planck full-sky lensing reconstruction, the result is only slightly higher, . The peak smearing in the Planck primary CMB power spectra, meanwhile, indicates mild evidence for enhanced lensing, with =.
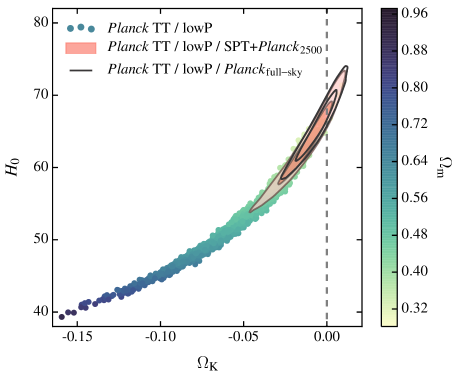
5.3 Spatial curvature
Inflationary models predict that the universe should be close to spatially flat, and the combination of observations of the primary CMB, supernovae Ia, baryon acoustic oscillations, and local Hubble constant measurements show that spatial curvature is not large (e.g., Komatsu et al., 2011). Constraints from the primary CMB have a geometrical degeneracy that allows spatial curvature to be increased while the Hubble constant is adjusted to keep the angular diameter distance to last scattering fixed; as a result, CMB measurements have historically relied on Hubble constant priors or external measurements to constrain curvature. As a probe of the local universe, lensing partially lifts this degeneracy (Sherwin et al., 2011). Figure 6 demonstrates this degeneracy-breaking by adding 2500 deg2 SPT + Planck or Planck full-sky lensing reconstruction information to the Planck primary CMB measurements. The constraint on spatial curvature from adding SPT + Planck lensing information to Planck primary CMB is at 95% confidence.
5.4 Massive neutrinos
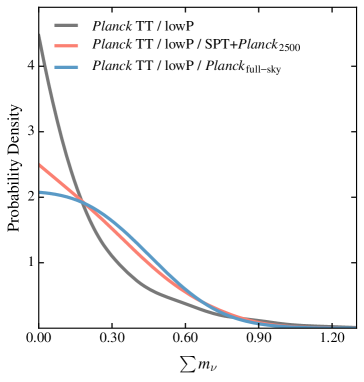
CMB lensing, as a measurement of the amplitude of clustering at intermediate redshifts, is a potentially powerful probe of neutrino masses (Smith et al., 2006; Abazajian et al., 2015). Neutrino oscillation experiments have precisely measured the differences in the squares of the masses between the neutrino eigenstates, but the absolute masses have not been measured. Laboratory limits constrain the mass of the electron neutrino, but the strongest constraints on absolute neutrino masses currently come from cosmology. Having a substantial amount of the energy density in the form of massive neutrinos leads to a suppression of structure on small scales in the matter power spectrum. The Planck primary CMB measurements limit the sum of the masses to be eV at 95% confidence (Planck Collaboration et al., 2016a). This constraint is strongly driven by the measurement of lensing through the smearing of peaks in the CMB power spectra.
As was seen in Planck Collaboration et al. (2016a), Figure 7 shows that adding information from the lensing reconstruction power spectrum reduces the posterior value at zero, but the lensing reconstruction data also rule out large values of , with the combined result being a similar 95% upper limit. Using SPT + Planck, the upper limit on neutrino masses is eV at 95% confidence, compared to eV for adding Planck full-sky lensing reconstruction data.
6 Discussion
The SPT + Planck data are not quite as constraining as the Planck-only lensing constraints; while the signal-to-noise per pixel of the O17 lensing map is substantially higher, the combined map covers only 2500 deg2. As discussed in O17, the statistical precision of the combined lensing map is dominated by the SPT data. This measurement is therefore a nearly independent check on the Planck lensing measurement.
The SPT + Planck lensing measurements and resulting cosmological constraints are in close agreement with the full-sky lensing results of the Planck experiment. For example, the SPT + Planck lensing measurements are in excellent agreement with a spatially flat universe, as predicted by inflationary models, with at 95% confidence, while a constraint on local structure from SPT + Planck is . Using Planck lensing instead yields and . These new measurements are nearly statistically independent of the Planck-only results, so the agreement between the datasets is informative.
This trend is also true for slight tensions that exist in Planck between the amount of lensing inferred from peak smearing and the direct reconstructions from the higher-order statistics. Measurements of the lensing amplitude from SPT + Planck are in excellent agreement with the lensing amplitude inferred from the Planck higher-order statistics, and in slight tension with that inferred from CMB peak smearing. When marginalizing over the peak smearing effect, the SPT + Planck data are in close agreement with the expected amount of gravitational lensing otherwise predicted by the observed CMB fluctuations.
The amount of lensing seen in SPT + Planck is also broadly consistent with both the amplitude inferred from low-redshift galaxy lensing studies and the amplitude of structure inferred from the Planck primary CMB measurements, as was also the case with Planck-only lensing constraints. More precise CMB lensing measurements will be required to further investigate possible tensions between low-redshift and high-redshift determinations of the amplitude of structure.
7 Acknowledgments
G. S. wishes to thank Elisa G. M. Ferreira, Joachim Harnois-Déraps and Alexander van Engelen for useful discussions and Jack Holder for digitization of the foreground model. We acknowledge the use of Alexander van Engelen’s implementation of the analytical bias in the flat-sky approximation. The South Pole Telescope program is supported by the National Science Foundation through grant PLR-1248097. Partial support is also provided by the NSF Physics Frontier Center grant PHY-0114422 to the Kavli Institute of Cosmological Physics at the University of Chicago, the Kavli Foundation, and the Gordon and Betty Moore Foundation through Grant GBMF#947 to the University of Chicago. This work has made use of computations performed on Guillimin, managed by Calcul Quebec and Compute Canada (funded by CFI, MESI, and FRQNT), and the Blue Waters sustained-petascale computing project (supported by NSF awards OCI-0725070 and ACI-1238993 and the state of Illinois). The McGill authors acknowledge funding from the Natural Sciences and Engineering Research Council of Canada, Canadian Institute for Advanced Research, and Canada Research Chairs program. G. S. acknowledges support from the Fonds de recherche du Québec - Nature et technologies. BB has been supported by the Fermi Research Alliance, LLC under Contract No. DE-AC02-07CH11359 with the U.S. Department of Energy, Office of Science, Office of High Energy Physics. CR acknowledges support from Australian Research Council s Discovery Projects scheme (DP150103208).
References
- Abazajian et al. (2015) Abazajian, K. N., et al. 2015, Astroparticle Physics, 63, 66
- BICEP2 Collaboration et al. (2016) BICEP2 Collaboration, et al. 2016, ApJ, 833, 228
- Böhm et al. (2016) Böhm, V., Schmittfull, M., & Sherwin, B. D. 2016, Phys. Rev. D, 94, 043519
- Challinor & Lewis (2005) Challinor, A., & Lewis, A. 2005, Phys. Rev. D, 71, 103010
- Chon et al. (2004) Chon, G., Challinor, A., Prunet, S., Hivon, E., & Szapudi, I. 2004, M.N.R.A.S., 350, 914
- Christensen et al. (2001) Christensen, N., Meyer, R., Knox, L., & Luey, B. 2001, Classical and Quantum Gravity, 18, 2677
- Das et al. (2011a) Das, S., et al. 2011a, ApJ, 729, 62
- Das et al. (2011b) ——. 2011b, Physical Review Letters, 107, 021301
- Hanson et al. (2011) Hanson, D., Challinor, A., Efstathiou, G., & Bielewicz, P. 2011, Phys. Rev. D, 83, 043005
- Henning et al. (2017) Henning, J. W., et al. 2017, ArXiv e-prints, 1707.09353
- Hildebrandt et al. (2017) Hildebrandt, H., et al. 2017, M.N.R.A.S., 465, 1454
- Hu & Okamoto (2002) Hu, W., & Okamoto, T. 2002, ApJ, 574, 566
- Joudaki et al. (2017) Joudaki, S., et al. 2017, M.N.R.A.S., 465, 2033
- Keisler et al. (2011) Keisler, R., et al. 2011, ApJ, 743, 28
- Kesden et al. (2003) Kesden, M., Cooray, A., & Kamionkowski, M. 2003, Phys. Rev. D, 67, 123507
- Komatsu et al. (2011) Komatsu, E., et al. 2011, ApJ Supp., 192, 18
- Lewis & Bridle (2002) Lewis, A., & Bridle, S. 2002, Phys. Rev. D, 66, 103511
- Lewis & Challinor (2006) Lewis, A., & Challinor, A. 2006, Phys. Rep., 429, 1
- Lewis et al. (2000) Lewis, A., Challinor, A., & Lasenby, A. 2000, ApJ, 538, 473
- Namikawa et al. (2013) Namikawa, T., Hanson, D., & Takahashi, R. 2013, M.N.R.A.S., 431, 609
- Okamoto & Hu (2003) Okamoto, T., & Hu, W. 2003, Phys. Rev. D, 67, 083002
- Omori et al. (2017) Omori, Y., et al. 2017, ApJ, 849, 124
- Planck Collaboration et al. (2014a) Planck Collaboration, et al. 2014a, A&A, 571, A16
- Planck Collaboration et al. (2014b) ——. 2014b, A&A, 571, A17
- Planck Collaboration et al. (2016a) ——. 2016a, A&A, 594, A13
- Planck Collaboration et al. (2016b) ——. 2016b, A&A, 594, A15
- POLARBEAR Collaboration et al. (2014) POLARBEAR Collaboration, et al. 2014, Physical Review Letters, 021301
- Schmittfull et al. (2013) Schmittfull, M. M., Challinor, A., Hanson, D., & Lewis, A. 2013, Phys. Rev. D, 88, 063012
- Sherwin et al. (2011) Sherwin, B. D., et al. 2011, ArXiv e-prints, 1105.0419
- Sherwin et al. (2016) ——. 2016, ArXiv e-prints, 1611.09753
- Smith et al. (2006) Smith, K. M., Hu, W., & Kaplinghat, M. 2006, Phys. Rev. D, 74, 123002
- Smith et al. (2007) Smith, K. M., Zahn, O., & Doré, O. 2007, Phys. Rev. D, 76, 043510
- Stompor & Efstathiou (1999) Stompor, R., & Efstathiou, G. 1999, M.N.R.A.S., 302, 735
- Story et al. (2015) Story, K. T., et al. 2015, ApJ, 810, 50
- Story et al. (2013) ——. 2013, ApJ, 779, 86
- Szapudi et al. (2001) Szapudi, I., Prunet, S., Pogosyan, D., Szalay, A. S., & Bond, J. R. 2001, ApJL, 548, L115
- Troxel et al. (2017) Troxel, M. A., et al. 2017, ArXiv e-prints, 1708.01538
- van Engelen et al. (2014) van Engelen, A., Bhattacharya, S., Sehgal, N., Holder, G. P., Zahn, O., & Nagai, D. 2014, ApJ, 786, 13
- van Engelen et al. (2012) van Engelen, A., et al. 2012, ApJ, 756, 142
- Zaldarriaga & Seljak (1999) Zaldarriaga, M., & Seljak, U. 1999, Phys. Rev. D, 59, 123507