Phosphorus-bearing molecules in the Galactic Center
Abstract
Phosphorus (P) is one of the essential elements for life due to its central role in biochemical processes. Recent searches have shown that P-bearing molecules (in particular PN and PO) are present in star-forming regions, although their formation routes remain poorly understood. In this Letter, we report observations of PN and PO towards seven molecular clouds located in the Galactic Center, which are characterized by different types of chemistry. PN is detected in five out of seven sources, whose chemistry is thought to be shock-dominated. The two sources with PN non-detections correspond to clouds exposed to intense UV/X-rays/cosmic-ray radiation. PO is detected only towards the cloud G+0.6930.03, with a PO/PN abundance ratio of 1.5. We conclude that P-bearing molecules likely form in shocked gas as a result of dust grain sputtering, while are destroyed by intense UV/X-ray/cosmic ray radiation.
keywords:
– Galaxy: Centre – ISM: molecules – ISM: abundances – ISM: clouds1 Introduction
Phosphorus (P) is essential for life because it plays a central role in the formation of macromolecules such as phospholipids (the structural components of cellular membranes) and the deoxyribonucleic acid (DNA, Maciá et al., 1997). It is synthesized in massive stars (Koo et al., 2013), and it has relatively low cosmic abundance relative to hydrogen (2.810-7; Grevesse & Sauval 1998). It is believed to be heavily depleted in cold and dense molecular clouds (Turner et al., 1990; Wakelam & Herbst, 2008). Until recently, only a few simple P-bearing species (PN, PO, CP, HCP, C2P, PH3) had been identified towards the envelopes of evolved stars (Tenenbaum et al., 2007; De Beck et al., 2013; Agúndez et al., 2014). Among the detected P-bearing molecules, PN and PO are the only ones that have been reported in star-forming regions. For decades PN remained as the only P-bearing species observed in these regions (Turner & Bally, 1987; Ziurys, 1987; Yamaguchi et al., 2011; Fontani et al., 2016), while PO has been discovered just recently in the surroundings of both high- and low-mass protostars (with PO/PN abundance ratios of 13; Rivilla et al., 2016; Lefloch et al., 2016).
Three routes have been proposed for the formation of PN and PO in star-forming regions: (i) shock-induced desorption of P-bearing species (e.g. PH3) from dust grains and subsequent gas-phase formation (Aota & Aikawa, 2012; Lefloch et al., 2016); (ii) high-temperature gas-phase chemistry after the thermal desorption of PH3 from ices (Charnley & Millar 1994); and (iii) gas-phase formation of PN and PO during the cold collapse phase and subsequent thermal desorption (at temperatures 35 K) by protostellar heating (Rivilla et al., 2016). Due to the limited number of observations available, and the limited range of physical conditions of the observed regions with detected P-bearing molecules, the formation routes for PN and PO are strongly debated.
In this Letter, we present observations of PN and PO towards seven regions spread across the Central Molecular Zone (CMZ) in the Galactic Center (GC). These sources are excellent laboratories to test the chemistry of P-bearing molecules since they show different physical properties (high kinetic temperatures, low dust temperatures and moderate densities) and chemistries dominated by either UV photons, cosmic-rays (CR), X-rays or shock waves.
2 The sample
The CMZ (Morris & Serabyn, 1996) of the Galactic Center harbors the most chemically rich regions in the Galaxy (Martín-Pintado et al., 2001). The physical conditions in the CMZ are very different from those found in the Galactic disk with high gas temperatures (60-100 K), low dust temperatures (20 K) and low H2 gas densities (104 cm-3; Rodríguez-Fernández et al., 2000; Güesten & Philipp, 2004; Ginsburg et al., 2016). Since dust is too cold for the evaporation of ices, it has been proposed that the observed chemical richness is due to grain sputtering in widespread, low-velocity shocks (Martín-Pintado et al. 1997). In addition, depending on their location, the clouds in the CMZ may be exposed to intense UV radiation (photon-dominated regions or PDRs), X-rays and/or cosmic rays (CR), which strongly affect the chemistry of these clouds (Martín et al., 2008). Our selected sample includes two different types of sources (see Table 1):
(i) Shock-dominated regions: G+0.6930.03, S+0.24+0.01, M0.020.07 and the molecular rich envelopes of SgrB2 N and M. The first two sources do not show evidence of on-going star formation, while the last three are associated with massive proto-clusters (de Vicente et al., 2000; Belloche et al., 2013; Sánchez-Monge et al., 2017). In all these regions, SiO is largely enhanced due to shocks (Martín et al., 2008).
(ii) Radiation-dominated regions: SgrA∗ [offset (30,30)] and M+0.020.02. The first is located at the inner edge of the circumnuclear disk (CND), 1.5 pc away from the black hole. Its molecular gas is strongly affected by the UV/X-ray radiation (Amo-Baladrón et al. 2011; Harada et al. 2014). The CR ionization rate in this region is enhanced by several orders of magnitude (Goto et al., 2008), causing a similar effect on the chemistry as that produced by UV photons (Harada et al., 2015). M+0.020.02 is a very compact cloud whose chemistry is thought to be affected by UV radiation and enhanced CR ionization rate (Martín et al., 2008), and also by X-rays (Ponti et al. 2010).
3 Observations
The observations were conducted in multiple sessions between 2003 and 2009. The observed positions for all sources are listed in Table 1. In the 20032005 sessions, the SIS C and D receivers covered the 2 mm window (128176 GHz), whilst between 2009 and 2011 the broad-band EMIR receivers (Carter et al. 2012) were used at 3mm (80116 GHz). The spectral resolution were in the range 6.8 -9.3 km s-1which was high enough to resolve the lines profiles of 20 km s-1. The molecular transitions studied in this work are shown in Table 2. Since it is well known that the molecular emission towards these sources is extended over the beam (Requena-Torres et al. 2006; Martín et al. 2008), in our analysis we have used the line intensities measured in units of antenna temperature, T, as we did in Martín et al. (2008) and Requena-Torres et al. (2008). To complete the sample, we also used the publicly available 3 mm spectral survey obtained towards SgrB2 N and M by Belloche et al. (2013).
| Source | RA (J2000) | DEC (J2000) | type(a) | Vel. | FWHM (km s-1) | N (1012 cm-2) | [PO/PN] | Tex(K) | ||||||
| (h m s) | (∘ ′ ′′) | (km s-1) | PN | 29SiO | N(PN) | N(PO) | N(29SiO) | N(C34S)(b) | PN | 29SiO | ||||
| G+0.6930.03 | 17 47 21.86 | 28 22 43.00 | Shock | 69 | 24.0 | 24.2 | 5.60.3 | 83 | 15.50.7 | 507 | 1.50.4 | 6.3 | 6.80.4(c) | |
| S+0.24+0.01 | 17 46 09.86 | 28 43 42.39 | Shock | 34 | 12.0 | 21.8 | 4.80.5 | < 13 | 11.70.2 | 352 | < 2.7 | 4.2 | 6.30.8(c) | |
| M0.020.07 | 17 45 50.64 | 28 59 08.81 | Shock | 47 | 19.0 | 27.0 | 4.70.8 | < 15 | 33.90.7 | 875 | < 3.1 | 5.0(d) | 4.70.5(c) | |
| SgrB2 N | 17 47 20.39 | 28 22 19.25 | Shock | 64 | 6.7 | 6.6 | 61 | < 19 | 67.60.8 | 9814 | < 1.8 | 5.0(d) | 5.0(d) | |
| 82 | 9.0 | 9.0 | 111 | < 19 | 51.30.6 | 268 | < 3.2 | 5.0(d) | 5.0(d) | |||||
| SgrB2 M | 17 47 20.41 | 28 23 07.25 | Shock | 60 | 6.7 | 6.5 | 9.30.7 | < 63 | 6310 | 12922 | < 6.8 | 5.0(d) | 5.0(d) | |
| 66 | 11.4 | 10.1 | 18.20.9 | < 63 | 17822 | 5813 | < 3.5 | 5.0(d) | 5.0(d) | |||||
| M+0.020.02 | 17 45 42.71 | 28 55 50.98 | Rad. | 93 | - | 32 | < 0.7 | < 11 | 4.90.8 | 256 | - | 5.0(d) | 6.00.9(c) | |
| -5.0 | - | 32 | < 0.7 | < 11 | 3.80.4 | 3415 | - | 5.0(d) | 6.0(d) | |||||
| SgrA∗(-30′′,-30′′) | 17 45 37.74 | 29 00 58.18 | Rad. | 20 | - | - | < 0.7 | < 18 | < 2.1 | 5415 | - | 5.0(d) | 5.0(d) | |
| Rad. | -70 | - | - | < 0.7 | < 18 | < 2.1 | - (e) | - | 5.0(d) | 5.0(d) | ||||
(a) Shock: Clouds with shock-dominated chemistry; Rad.: Clouds with radiation-dominated chemistry. (b) Values extracted from Martín et al. (2008) (see their Table 4) for all sources except for SgrB2 N and M (see text). (c) The MADCUBA-AUTOFIT was performed using simultaneously the 29SiO (21), (32) and (43) transitions. (d) Value fixed. e Not derived in Martín et al. (2008).
| Molecule | Transition | Frequency (GHz) | Eup (K) | Aul (s-1) |
|---|---|---|---|---|
| PN | 21 | 93.97977 | 6.8 | 2.910-5 |
| PN | 32 | 140.96769 | 13.5 | 1.110-4 |
| PO | F=32, l=e (a) | 108.99845 | 8.4 | 2.110-5 |
| PO | F=21, l=e (a) | 109.04540 | 8.4 | 1.910-5 |
| PO | F=32, l=f (a) | 109.20620 | 8.4 | 2.110-5 |
| PO | F=21, l=f (a) | 109.28119 | 8.4 | 1.910-5 |
| 29SiO | 21 | 85.75920 | 6.2 | 2.810-5 |
| 29SiO | 32 | 128.63671 | 12.3 | 1.010-4 |
| 29SiO | 43 | 171.51229 | 20.6 | 2.510-4 |
| C34S | 21 | 96.41295 | 6.3 | 1.610-5 |
| C34S | 32 | 144.61710 | 11.8 | 5.810-5 |
| C34S | 54 | 241.01609 | 27.0 | 2.810-4 |
J=5/23/2, =1/2 quadruplet.
4 Analysis and Results
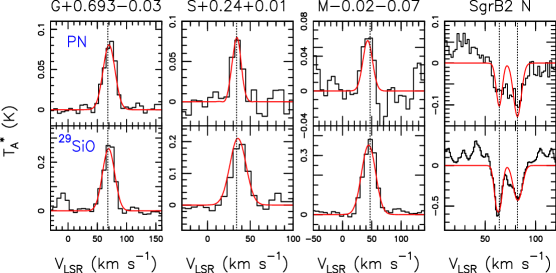
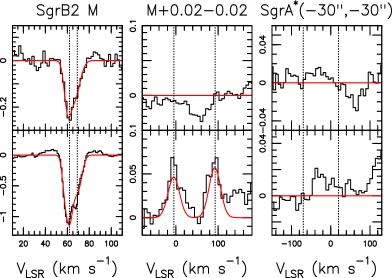
PN (21) was detected towards all the shock-dominated clouds in our sample (see Figure 1 and Table 1). In the case of SgrB2 N and M, PN (21) was detected in absorption against the bright continuum emission of the hot molecular cores and compact HII regions, indicating its presence within the low-density envelope of SgrB2. PN was not detected towards the radiation-dominated sources: SgrA∗ (30,30) and M+0.020.02. In both sources we have searched at the two velocity components found by Martín et al. (2008) in other molecular tracers (see Table 1). PN (32) was not detected towards any source.
To derive the column densities of the molecular species across our sample, we have used MADCUBA111Madrid Data Cube Analysis (MADCUBA) is a software developed in the Center of Astrobiology (Madrid) to visualize and analyze single spectra and datacubes (Rivilla et al., 2017a, b)., which produces synthetic spectra assuming Local Thermodynamic Equilibrium (LTE) conditions. First, we fixed manually the FWHM and the velocity of the lines to values that reproduce well the observed lines (see Table 1). Then, we used the MADCUBAAUTOFIT tool, which compares the synthetic LTE spectra with the observed spectra and provides the best non-linear least-squared fit using the Levenberg-Marquardt algorithm. We run AUTOFIT to fit simultaneously the PN (21) detections and the (32) non-detections. The algorithm converged for G+0.6930.03 and S+0.24+0.01, and found low temperatures of 6.3 K and 4.2 K, respectively. We note that these excitation temperatures should be considered as upper limits since higher values of Tex would excite the PN(32) transition, which was not detected.
For M0.02-0.07 the AUTOFIT algorithm did not converge, and thus was fixed to 5 K. The derived values for the PN column densities derived with AUTOFIT are shown in Table 1. The low Tex found are similar to those observed for other species in these clouds (515 K; Requena-Torres et al., 2008; Martín et al., 2008), and to those recently found for PN in several massive cores in the Galactic disk (Mininni et al., subm.). The most likely explanation for the found, much lower than the kinetic temperatures, is that PN is subthermally excited due to the relatively low H2 densities (104 cm-3; Güsten & Philipp 2004) compared with the critical densities of PN (>105 cm-3, Toboła et al. 2007).
The PN absorption lines towards SgrB2 N and M were fitted assuming that the PN gas is located in a foreground layer with Tex=5 K, and considering that the SgrB2 N and M hot cores are background blackbody emitters with sizes of 2 and gas temperatures of 150 K (Belloche et al., 2013; Sánchez-Monge et al., 2017). The PN absorption shows two different velocity components (Figure 1) that have been fitted simultaneously.
PN was not detected towards the radiation-dominated regions, SgrA∗ (30′′,30′′) and M+0.02-0.02, and then we derived the 3 upper limits for the column density.
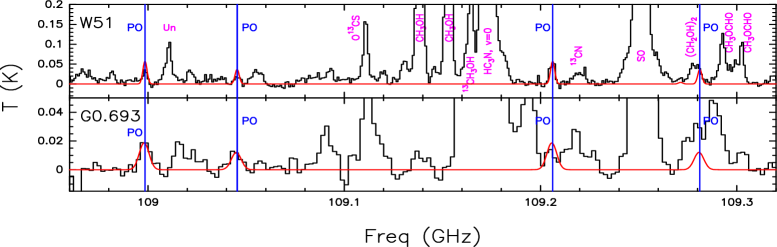
We have also searched for the PO quadruplet at 109 GHz (Table 2). PO has only been detected towards G+0.6930.03, known to be rich in O-bearing molecules (Requena-Torres et al., 2006, 2008). Figure 2 shows the PO detection compared to that reported by Rivilla et al. (2016) towards the hot core W51 e1/e2. The PO lines were fitted assuming Tex=6.3 K, that inferred from PN. The derived [PO/PN] ratio is 1.5, similar to that measured in star-forming regions (Rivilla et al., 2016; Lefloch et al., 2016). For the other sources (with PO non-detections), we computed the upper limits of the PO column density considering the same Tex assumed for PN. In all cases, the [PO/PN] ratio is < 7 (Table 1).
To test whether the chemistry of P-bearing molecules is indeed correlated with the presence of shocks, we have also analyzed the emission of the shock tracer SiO. Since the main isotopologue is optically thick across the GC, we have used the optically thinner isotopologue 29SiO. By simultaneously fitting the (21), (32) and (43) transitions of this molecule, we have found in the range 4.76.8 K for G+0.6930.03, S+0.24+0.01, M0.020.07 and M+0.020.02. In contrast, this species is not detected in none of the velocity components of SgrA∗ (30′′,30′′) and we have thus computed the upper limits. For SgrB2 N and M, the 29SiO (21) emission is seen in absorption (Figure 1) and, as for PN, we have considered two velocity components and a fixed =5 K to compute the column densities (Table 1).

In Figure 3, we plot the column density ratios PN/C34S versus those obtained for 29SiO/C34S. The optically-thin C34S isotopologue is used here because it is a good proxy of the H2 column density, as shown by Requena-Torres et al. (2006) in a survey of GC clouds. CS is also a good reference to compute relative molecular ratios because its chemistry is nearly independent of the physical properties of the sources: i) unlike other species (such as CH3OH or HNCO) it is barely enhanced in shocked-gas (Requena-Torres et al. 2006); and ii) it is photoresistant, so it is expected to survive in PDRs (Requena-Torres et al. 2006; Martín et al. 2008).
For G+0.6930.03, S+0.24+0.01, M0.020.07, SgrA∗ (30′′,30′′) and M+0.020.02, we have used the C34S column densities obtained from C34S (32) and C34S (54) by Martín et al. (2008). For SgrB2 N and M, Martín et al. (2008) did not consider the two velocity components used in our analysis , and therefore, we have re-done the analysis. For SgrB2 N we have used C34S (21). For SgrB2 M, the C34S (21) line presents strong emission blended with the absorption feature and therefore, we used the C34S (32) transition instead. We used the from Martín et al. (2008), to be consistent with the other sources. For completeness, in the case of sources with no detection of PN or 29SiO, we have plotted in Figure 3 the values of the upper limits.
Figure 3 reveals that there is a positive trend between PN and 29SiO abundances. Although our upper limits toward the PDR-like sources do not allow us to confirm a correlation between PN and 29SiO, these two species seem to show a similar behaviour: the PN detections correspond to the 29SiO-richer sources, while PN is not present toward those sources with weaker 29SiO. This strongly suggests that PN is enhanced by shocks. This conclusion is in good agreement with the results found by Mininni et al. (subm.) in some massive dense cores of the Galactic disk, and with the shock modeling results from Lefloch et al. (2016), which proposed that PN is formed in gas phase after the shock-induced desorption of PH3. Since PN is not detected in any GC radiation-dominated cloud, this molecule is likely dissociated by the intense UV/X-ray/CR radiation, similarly to HNCO and CH3OH (Martín et al. 2008). For completeness, in Figure 3 we also add the PN/C34S and 29SiO/C34S column density ratios measured towards the shocked region L1157-B1 (Bachiller & Pérez Gutiérrez, 1997; Lefloch et al., 2016; Podio et al., 2017), the Orion Bar (a prototypical PDR; Cuadrado et al. 2015, and Cuadrado, priv. comm.), and L1544 (a pre-stellar core without any sign of star formation activity; Ward-Thompson et al., 1999). In the latter two cases the 29SiO column density was calculated from SiO assuming 28Si/29Si=19.6 (Wilson, 1999). For L1544 the molecular column densities were calculated using =5 K. The column density ratios derived for these regions nicely follow the trend observed for the Galactic Center clouds: PN is well correlated with 29SiO in the L1157-B1 shock while it remains undetected in the PDR. Since PN is not detected in the L1544 pre-stellar core either , this implies that P, like Si, is heavily depleted in molecular dark clouds, in agreement with the shock modelling results from Lefloch et al. (2016), and with observations in molecular dark clouds (Turner et al. 1990).
5 Conclusions
We searched for P-bearing molecules PN and PO towards seven clouds located in the Galactic Center, known to present different types of chemistry. PN is detected towards five of the seven sources, and PO is detected only towards one of the sources, G+0.6930.03, which is thought to be the richest source of O-bearing molecules in the Galactic Center. The derived PO/PN abundance ratio is 1.5, similar to values previously found in star-forming regions. The regions where P-bearing species have been detected are clouds thought to be affected by shock waves, and rich in the well-known shock tracer 29SiO. The two sources where no P-bearing molecules were detected are regions exposed to intense radiation, and exhibit lower abundances of 29SiO. We thus conclude that P-bearing species are formed in the gas phase after the shock-induced sputtering of the grain mantles, and that they are efficiently destroyed by the high cosmic-rays/X-rays/UV-photon radiation expected in some regions of the Galactic Center.
Acknowledgements
We thank S. Cuadrado and J. Goicoechea for sharing their data on the Orion bar. V.M.R. is funded by the H2020 programme under the MSC grant agreement No 664931. I.J.-S. and D.Q. acknowledge the financial support received from the STFC through an ER Fellowship and Grant (ST/L004801 and ST/M004139). J.M.-P. acknowledges support by the MINECO grants ESP2013-47809-C03-01 and ESP2015-65597-C4-1. S. Zeng acknowledges support through a Principal’s studentship funded by QMUL. DR acknowledge support of the Collaborative Research Council 956, subproject A5, funded by the DFG.
References
- Agúndez et al. (2014) Agúndez M., Cernicharo J., Decin L., Encrenaz P., Teyssier D., 2014, The Astrophysical Journal Letters, 790, L27
- Amo-Baladrón et al. (2011) Amo-Baladrón M. A., Martín-Pintado J., Martín S., 2011, A&A, 526, A54
- Aota & Aikawa (2012) Aota T., Aikawa Y., 2012, The Astrophysical Journal, 761, 74
- Bachiller & Pérez Gutiérrez (1997) Bachiller R., Pérez Gutiérrez M., 1997, The Astrophysical Journal Letters, 487, L93
- Belloche et al. (2013) Belloche A., Müller H. S. P., Menten K. M., Schilke P., Comito C., 2013, Astronomy & Astrophysics, 559, A47
- Carter et al. (2012) Carter M., et al., 2012, A&A, 538, A89
- Charnley & Millar (1994) Charnley S. B., Millar T. J., 1994, MNRAS, 270, 570
- Cuadrado et al. (2015) Cuadrado S., Goicoechea J. R., Pilleri P., Cernicharo J., Fuente A., Joblin C., 2015, Astronomy & Astrophysics, 575, A82
- De Beck et al. (2013) De Beck E., Kamiński T., Patel N. A., Young K. H., Gottlieb C. A., Menten K. M., Decin L., 2013, Astronomy and Astrophysics, 558, A132
- Fontani et al. (2016) Fontani F., Rivilla V. M., Caselli P., Vasyunin A., Palau A., 2016, The Astrophysical Journal Letters, 822, L30
- Ginsburg et al. (2016) Ginsburg A., et al., 2016, Astronomy and Astrophysics, 586, A50
- Goto et al. (2008) Goto M., et al., 2008, The Astrophysical Journal, 688, 306
- Grevesse & Sauval (1998) Grevesse N., Sauval A. J., 1998, Space Science Reviews, 85, 161
- Güesten & Philipp (2004) Güesten R., Philipp S., 2004, arXiv:astro-ph/0402019, 91, 253
- Güsten & Philipp (2004) Güsten R., Philipp S. D., 2004, in Pfalzner S., Kramer C., Staubmeier C., Heithausen A., eds, Vol. 91, The Dense Interstellar Medium in Galaxies. p. 253 (arXiv:astro-ph/0402019), doi:10.1007/978-3-642-18902-9_46
- Harada et al. (2014) Harada N., Riquelme D., Viti S., Menten K., Requena-Torres M., Güsten R., Hochgürtel S., 2014, in Sjouwerman L. O., Lang C. C., Ott J., eds, IAU Symposium Vol. 303, The Galactic Center: Feeding and Feedback in a Normal Galactic Nucleus. pp 78–82 (arXiv:1312.1905), doi:10.1017/S1743921314000209
- Harada et al. (2015) Harada N., et al., 2015, Astronomy & Astrophysics, 584, A102
- Jiménez-Serra et al. (2016) Jiménez-Serra I., et al., 2016, The Astrophysical Journal Letters, 830, L6
- Koo et al. (2013) Koo B.-C., Lee Y.-H., Moon D.-S., Yoon S.-C., Raymond J. C., 2013, Science, 342, 1346
- Lefloch et al. (2016) Lefloch B., et al., 2016, Monthly Notices of the Royal Astronomical Society, 462, 3937
- Maciá et al. (1997) Maciá E., Hernández M. V., Oró J., 1997, Origins of Life and Evolution of the Biosphere, 27, 459
- Martín-Pintado et al. (1997) Martín-Pintado J., de Vicente P., Fuente A., Planesas P., 1997, ApJ, 482, L45
- Martín-Pintado et al. (2001) Martín-Pintado J., Rizzo J. R., de Vicente P., Rodríguez-Fernández N. J., Fuente A., 2001, The Astrophysical Journal Letters, 548, L65
- Martín et al. (2008) Martín S., Requena-Torres M. A., Martín-Pintado J., Mauersberger R., 2008, The Astrophysical Journal, 678, 245
- Morris & Serabyn (1996) Morris M., Serabyn E., 1996, Annual Review of Astronomy and Astrophysics, 34, 645
- Podio et al. (2017) Podio L., et al., 2017, Monthly Notices of the Royal Astronomical Society: Letters, 470, L16
- Ponti et al. (2010) Ponti G., Terrier R., Goldwurm A., Belanger G., Trap G., 2010, ApJ, 714, 732
- Requena-Torres et al. (2006) Requena-Torres M. A., Martín-Pintado J., Rodríguez-Franco A., Martín S., Rodríguez-Fernández N. J., de Vicente P., 2006, Astronomy and Astrophysics, 455, 971
- Requena-Torres et al. (2008) Requena-Torres M. A., Martín-Pintado J., S. M., Morris M. R., 2008, The Astrophysical Journal, 672, 352
- Rivilla et al. (2016) Rivilla V. M., Fontani F., Beltrán M. T., Vasyunin A., Caselli P., Martín-Pintado J., Cesaroni R., 2016, The Astrophysical Journal, 826, 161
- Rivilla et al. (2017a) Rivilla V. M., Beltrán M. T., Cesaroni R., Fontani F., Codella C., Zhang Q., 2017a, Astronomy & Astrophysics, 598, A59
- Rivilla et al. (2017b) Rivilla V. M., Beltrán M. T., Martín-Pintado J., Fontani F., Caselli P., Cesaroni R., 2017b, Astronomy & Astrophysics, 599, A26
- Rodríguez-Fernández et al. (2000) Rodríguez-Fernández N. J., Martín-Pintado J., de Vicente P., Fuente A., Huettemeister S., Wilson T. L., Kunze D., 2000, arXiv:astro-ph/0002478
- Sánchez-Monge et al. (2017) Sánchez-Monge A., et al., 2017, arXiv:1704.01805 [astro-ph]
- Tenenbaum et al. (2007) Tenenbaum E. D., Woolf N. J., Ziurys L. M., 2007, The Astrophysical Journal Letters, 666, L29
- Toboła et al. (2007) Toboła R., Kłos J., Lique F., Chałasiński G., Alexander M. H., 2007, A&A, 468, 1123
- Turner & Bally (1987) Turner B. E., Bally J., 1987, The Astrophysical Journal Letters, 321, L75
- Turner et al. (1990) Turner B. E., Tsuji T., Bally J., Guelin M., Cernicharo J., 1990, The Astrophysical Journal, 365, 569
- Wakelam & Herbst (2008) Wakelam V., Herbst E., 2008, The Astrophysical Journal, 680, 371
- Ward-Thompson et al. (1999) Ward-Thompson D., Motte F., Andre P., 1999, Monthly Notices of the Royal Astronomical Society, 305, 143
- Wilson (1999) Wilson T. L., 1999, Reports on Progress in Physics, 62, 143
- Yamaguchi et al. (2011) Yamaguchi T., et al., 2011, Publications of the Astronomical Society of Japan, 63, L37
- Ziurys (1987) Ziurys L. M., 1987, The Astrophysical Journal Letters, 321, L81
- de Vicente et al. (2000) de Vicente P., Martin-Píntado J., Neri R., Colom P., 2000, arXiv:astro-ph/0009195