Major Merging History in CANDELS. I. Evolution of the Incidence of Massive Galaxy-Galaxy Pairs from to
Abstract
The rate of major galaxy-galaxy merging is theoretically predicted to steadily increase with redshift during the peak epoch of massive galaxy development (). We use close-pair statistics to objectively study the incidence of massive galaxies (stellar ) hosting major companions (; i.e., 4:1) at six epochs spanning . We select companions from a nearly complete, mass-limited () sample of 23,696 galaxies in the five CANDELS fields and the SDSS. Using kpc projected separation and close redshift proximity criteria, we find that the major companion fraction based on stellar mass-ratio (MR) selection increases from 6% () to 16% (), then turns over at and decreases to 7% (). Instead, if we use a major F160W flux ratio (FR) selection, we find that increases steadily until owing to increasing contamination from minor (MR4:1) companions at . We show that these evolutionary trends are statistically robust to changes in companion proximity. We find disagreements between published results are resolved when selection criteria are closely matched. If we compute merger rates using constant fraction-to-rate conversion factors ( and ), we find that MR rates disagree with theoretical predictions at . Instead, if we use an evolving from Snyder et al., our MR-based rates agree with theory at . Our analysis underscores the need for detailed calibration of and as a function of redshift, mass and companion selection criteria to better constrain the empirical major merger history.
keywords:
Galaxies: evolution – Galaxies: statistics – Galaxies: high-redshift1 Introduction
In an hierarchical universe, collisions between similar-mass galaxies (major mergers) are expected to occur, and many theoretical studies predict such merging plays an important role in the formation and evolution of massive galaxies. A key measurement for quantifying the role of major merging in galaxy development is the merger rate and its evolution during cosmic history. A host of studies have measured major merger rates at redshifts , primarily based either on close-pair statistics (e.g., Patton et al., 1997; Lin et al., 2004; Kartaltepe et al., 2007; Bundy et al., 2009), clustering statistics (e.g., Bell et al., 2006b; Robaina et al., 2010), and morphological disturbances and asymmetries (e.g., Lotz et al., 2008; Conselice et al., 2009). These studies have all found higher incidences of major merging at earlier look-back times and a strong to moderate decrease to the present epoch, in broad agreement with many theoretical predictions (e.g., Gottlöber et al., 2001; Bower et al., 2006; Hopkins et al., 2010a). Despite these successes, large scatter (factor of 10) exists between even the most stringent individual constraints, owing to systematic uncertainties in different methodologies and merger timescales. These issues are compounded for empirical estimates at the epoch of peak galaxy development (; ‘cosmic high-noon’). Some early empirical estimates based on both methodologies found increasing major merger incidence at (e.g., Bluck et al., 2009), but recent studies find a possible flattening or turnover in merger rates between (e.g., Ryan et al., 2008; Man et al., 2016; Mundy et al., 2017). These new empirical trends are in strong disagreement with recent theoretical models predicting that merger rates continue to rise from to and beyond (Hopkins et al., 2010a; Lotz et al., 2011; Rodriguez-Gomez et al., 2015a). These discrepancies and the large variance between past measurements highlight the need for improved major merger constraints, especially during the critical high-noon epoch.
A host of selection-effect issues has plagued many previous attempts to constrain major merger statistics at high redshift, from low-number statistics and significant sample variance due to small-volume pencil-beam surveys, and rest-frame UV selections of both disturbed morphologies and close pairs. While the identification of close pairs is less prone to some systematics, the lack of statistically useful samples of spectroscopic redshifts or even moderately small-uncertainty photometric redshifts at until very recently have limited the usefulness of this method. Moreover, the wildly varying close-companion selection criteria among previous studies is a plausible explanation for tensions between empirical merger rates and theoretical predictions (Lotz et al., 2011). In this study, we will address many of these shortcomings and systematically explore the impact of major close-companion selection criteria by analyzing major companion fractions in a sample of 10,000 massive host galaxies (stellar mass ) from the five Hubble Space Telescope (HST) legacy fields in CANDELS (Grogin et al., 2011; Koekemoer et al., 2011) and the SDSS survey. This comprehensive sample provides statistically useful major companion counts, down to a mass limit of , from rest-frame optical images over a large volume out to .
The hierarchical major merging of similar mass halos via gravitational accretion is the underlying physical driver of galaxy-galaxy major merging. Cosmological simulations predict that the major halo-halo merger rate rises steeply with redshift as (e.g., Fakhouri & Ma, 2008; Genel et al., 2009; Fakhouri et al., 2010), which is in agreement with simple analytical predictions based on Extended Press-Schechter (EPS) theory of (Neistein & Dekel, 2008; Dekel et al., 2013). Cosmologically-motivated simulations of galaxy formation and evolution predict major galaxy-galaxy merger rates that follow over a wide redshift range (e.g., ; Rodriguez-Gomez et al., 2015a). While there is some debate on the increasing merger rate evolution among theoretical studies due to model-dependencies (for review, see Hopkins et al., 2010a), some works claim flattening of merger rates with increasing redshift (e.g., Henriques et al., 2015), most agree with an increasing incidence (within a factor-of-two uncertainty). Not only are merger rates expected to be higher at early cosmic times, but major galaxy merging is predicted to play a crucial role in nearly all aspects of the formation and evolution of massive galaxies including buildup of spheroidal bulges and massive elliptical galaxies (Springel, 2000; Khochfar & Burkert, 2003, 2005; Naab et al., 2006; Cox et al., 2008), triggering and enhancement of star formation (SF) including nuclear starbursts (Sanders et al., 1988; Di Matteo et al., 2007, 2008; Martig & Bournaud, 2008), and the fueling of active galactic nuclei (AGN) (Hopkins et al., 2006; Younger et al., 2009; Narayanan et al., 2010; Hopkins et al., 2010a) and subsequent SF quenching (e.g., Di Matteo et al., 2005; Hopkins et al., 2008).
Many empirical studies support the predictions that major merging may explain the documented build-up of massive and quenched (non-star-forming and red) galaxy number densities and their stellar content growth at (e.g., Bell et al., 2006a; McIntosh et al., 2008; van der Wel et al., 2009), enhancement of SF activity (e.g., Jogee et al., 2009; Patton et al., 2011), and elevation of AGN activity (Treister et al., 2012; Weston et al., 2017; Hewlett et al., 2017). Despite this agreement, some studies find a weak major merging-SF connection and suggest mergers may not be the dominant contributor to in-situ galactic SF (Robaina et al., 2009; Swinbank et al., 2010; Targett et al., 2011). Moreover, other studies find a lack of a merger-AGN connection (Grogin et al., 2005; Kocevski et al., 2012; Villforth et al., 2014, 2017). These conflicting observations lend support to theories that predict violent disk instabilities (VDI) due to the rapid hierarchical accretion of cold gas may be responsible for key processes like bulge formation and AGN triggering (Bournaud et al., 2011; Dekel & Burkert, 2014). Indeed, a recent CANDELS study by Brennan et al. (2015) found the observed evolution of massive quenched spheroids at is better matched to SAM predictions that include both mergers and disk-instability prescriptions. Therefore, the role of major merging in galaxy evolution remains a critical open question. Hence, measuring the frequency and rate at which major mergers occur at different cosmic times using large, uniformly selected close-pair samples is a key step towards answering the role played by them in massive galaxy development.
Theoretical simulations predict that galaxies involved in major close pairs will interact gravitationally and coalesce over time into one larger galaxy, and thereby make them effective probes of ongoing or future merging. Many studies in the past have employed the close-pair method to estimate the frequency of major merging as a function of cosmic time. This typically involves searching for galaxies that host a nearby companion meeting a number of key criteria: (i) 2-dimensional projected distance, (ii) close redshift-space proximity, and satisfies a nearly-equal mass ratio between the host (1) and companion (2) galaxies. For each criterion, a wide range of choices is used in the literature. For projected separation , a search annulus is often employed with minimum and maximum radii. Common choices vary between kpc (e.g., Patton & Atfield, 2008; de Ravel et al., 2009) and kpc (e.g., Bluck et al., 2009; Man et al., 2016). Depending on available redshift information, the choice of physical proximity criterion ranges from stringent spectroscopic velocity differences (commonly km s-1; e.g., Lin et al., 2008) to a variety of photometric redshift error overlaps (e.g., Bundy et al., 2009; Man et al., 2012) To study similar-mass galaxy-galaxy mergers, previous studies have adopted stellar-mass-ratio selections ranging from (or 2:1, e.g., De Propris et al., 2007) to (5:1, e.g., Lofthouse et al., 2017), with 4:1 being by far the most common mass ratio criterion. In the absence of stellar-mass estimates, flux ratio is often used as a proxy for (e.g., Bridge et al., 2007). The wide range of adopted close-companion selection criteria lead to a large scatter in two decades of published pair-derived merger rates with redshift evolution spanning at , and sometimes even indicating a flat or turnover in merger rates at (Williams et al., 2011; Man et al., 2012; Man et al., 2016; Mundy et al., 2017). This large scatter in pair-derived merger rate constraints highlights the strong need for tighter constraints at cosmic high-noon, and motivates a careful analysis of selection effects.
Numerical simulations of the gravitation interactions between merging galaxies can produce disturbed morphological features due to strong tidal forces (e.g., Barnes & Hernquist, 1996; Bournaud & Duc, 2006; Peirani et al., 2010). As such, morphological selections have also been used to empirically identify mergers. These selections are broadly divided into visual classifications (e.g., Darg et al., 2010; Kartaltepe et al., 2015), analysis of imagemodel residuals (e.g., McIntosh et al., 2008; Tal et al., 2009), and automated measures of quantitative morphology such as Gini-M20 (Lotz et al., 2004) and CAS (Conselice, 2003). Although morphology-based studies broadly find merger rates to be rising strongly with redshift as (e.g., López-Sanjuan et al., 2009; Wen & Zheng, 2016), sometimes finding as high as of their sample as mergers (Conselice et al., 2008b), there are significant study-to-study discrepancies where some studies find no merger rate evolution (e.g., Cassata et al., 2005; Lotz et al., 2008). Morphology-based selections depend on identifying relatively fainter disturbances than the galaxy, which makes this method prone to systematics. The cosmological surface-brightness of galaxies falls off as , which can lead to a biased identification of faint merger-specific features as a function of redshift. In addition, most of these morphology-based merger rates are based on small-volume, pencil-beam surveys probing the rest-frame UV part of the spectrum, especially at . This can lead to over-estimation of merger rates due to contamination from non-merging, high star-forming systems with significant substructure that can be confused as two merging galaxies. Recent theoretical developments suggest that VDI can also cause disturbances in the host galaxy morphology and mimic merger-like features (see Dekel et al., 2009; Cacciato et al., 2012; Ceverino et al., 2015), which in principle may complicate the measurement of morphology-based merger rates. Thus, to robustly identify plausible merging systems out to high redshifts () without having to rely on imaging-related systematics strongly, we resort to the close-pair method in this study. We acknowledge that the close-pair method has its limitations at high redshift where galaxies have large photometric redshift uncertainties, which may lead to incorrect merger statistics. In this study, we initially exclude the galaxies with unreliable redshifts from our analysis, but later add back a certain fraction of them by employing a statistical correction.
In this paper, we analyze galaxy-galaxy close pairs in a large sample of 5698 massive galaxies () from the state-of-the-art Cosmic Assembly Near-Infrared Deep Extragalactic Legacy Survey (CANDELS- Grogin et al., 2011; Koekemoer et al., 2011) of five highly-studied extragalactic fields at six epochs spanning (with a width ). To simultaneously anchor our findings to , we take advantage of 4098 massive galaxies from the Sloan Digital Sky Survey (SDSS) (York et al., 2000), Data release 4 (DR4; Adelman-McCarthy et al., 2006) at , which is matched in resolution to CANDELS and probes an average of Mpc3 per redshift bin. With the available data, we also perform rigorous analyses to understand the impact of different close-companion selection criteria on the derived results.
We structure this paper as follows: In § 2, we provide a brief description of the CANDELS and SDSS data products (redshifts and stellar masses) and describe the selection of massive galaxies hosting major companions based on the stellar mass complete massive galaxy sample. In § 3, we describe the calculation of major companion fraction and its redshift evolution including necessary statistical corrections. In § 4, we discuss the impact of close-companion selection choices on the derived major companion fractions. In § 5, we calculate the major merger rates based on the major companion fractions. We synthesize detailed comparisons of the companion fractions and merger rates to other empirical studies and theoretical model predictions, and also discuss plausible reasons and implications of disagreement between the observed and theoretical merger rates. We present our conclusions in § 6. Throughout this paper, we adopt a cosmology of = (), = and = 0.7, and use the AB magnitude system (Oke & Gunn, 1983).
2 Data and Galaxy Sample
In this study, we analyze close galaxy-galaxy pairs selected from a large sample of massive galaxies from the Cosmic Assembly Near-infrared Deep Extragalactic Legacy Survey (CANDELS; Grogin et al., 2011; Koekemoer et al., 2011), spanning redshifts , and subdivided into five epochs probing a volume of Mpc3 each. We anchor our findings to using a sample from the SDSS that is matched in volume and resolution to the CANDELS sample. To reliably track the major merging history since using close-pair method, we start with a mass-limited sample of galaxies that will allow a complete selection of massive galaxies with major companions meeting our chosen stellar mass ratio: (1, 2 represent host and companion galaxies, respectively). In this section, we describe the relevant details of the data necessary to achieve this sample selection.
2.1 CANDELS : 5 LEGACY FIELDS
2.1.1 Photometric Source Catalogs
The five CANDELS HST legacy fields – UDS, GOODS-S, GOODS-N, COSMOS, and EGS – have a wealth of multi-wavelength data and cover a total area of (). The CANDELS survey observations and image processing are described in Grogin et al. (2011) and Koekemoer et al. (2011), respectively. We use the photometric source catalogs from Galametz et al. (2013, UDS), Guo et al. (2013, GOODS-S), Barro et al., in prep (GOODS-N), Nayyeri et al. (2017, COSMOS), and Stefanon et al. (2017, EGS). Each catalog was generated with a consistent source detection algorithm using SExtractor applied to the F160W (-band) 2-orbit depth CANDELS mosaic image produced for each field. These authors used profile template fitting (TFIT, Laidler et al., 2007) to provide uniform photometry and spectral energy distributions (SEDs) for each galaxy at wavelengths spanning to , supplemented by ground-based data (for description, see Guo et al., 2013) and spitzer/IRAC photometry ( to ) from the S-CANDELS survey (Ashby et al., 2015) . Each photometric object was assigned a flag (PhotFlag) to identify plausible issues using a robust automated routine described in Galametz et al. (2013). We use PhotFlag = 0 to remove objects with contaminated photometry due to nearby stars, image artifacts or proximity to the F160W coverage edges. This cut removes of raw photometric sources depending on the field. We also use the stellarity index from SExtractor (Class_star ) to eliminate bright star-like sources. We estimate that this additional cut removes active compact galaxies that makeup of our total desired mass-limited sample. We note that including these galaxies has no significant impact on our conclusions. We tabulate the total raw and good photometric source counts for the five CANDELS fields in Table 1.
2.1.2 Redshifts & Stellar Masses
We use the CANDELS team photometric redshift and stellar mass catalogs available for each field. For the CANDELS UDS and GOODS-S fields, the redshifts are published in Dahlen et al. (2013), and the masses are found in Santini et al. (2015). For the remaining fields, we use the catalogs: GOODS-N (Barro et al., in prep), COSMOS (Nayyeri et al., 2017), and EGS (Stefanon et al., 2017). As discussed extensively in Dahlen et al. (2013), photometric redshift probability distribution functions were computed for each galaxy by fitting the SED data. This exercise was repeated by six participants (#ID 4, 6, 9, 11, 12, and 13 in Dahlen et al., 2013) who performed SED fitting using different codes (EAZY, HyperZ) and template sets (BC03, PEGASE, EAZY). Additional detailed discussion on individual code functionality and their respective fitting priors can be found in Dahlen et al. (2013). A team photometric redshift () was computed for each source equal to the median of the six peak redshifts. When compared to a known spectroscopic sample, these photometric redshifts have an outlier removed RMS scatter (see Dahlen et al., 2013 for definition). Additionally, spectroscopic redshifts () are also available for small subsets of galaxies in each field. The best available redshift is cataloged as either the team or the good quality measurements when available, which are defined by the flag q_zspec = 1 (Dahlen et al., 2013). Note that the compilation of redshifts included in our analysis sample does not include grism redshifts. We limit our selection of massive galaxies to , and we employ a redshift bin size to probe evolution between 5 and 11 Gyr ago using five roughly equal co-moving volumes ranging between . We exclude redshifts since this volume is times smaller ().
The stellar masses () were estimated for each source by fitting the multi-band photometric data to SED templates with different stellar population model assumptions111Each model is defined by a set of stellar population templates, Initial Mass Function (IMF), Star Formation History (SFH), metallicity and extinction law assumptions; see Mobasher et al. (2015) fixed to the object’s . The team stellar mass (see Santini et al., 2015; Mobasher et al., 2015) for each source is chosen as the median of the estimates based on the same assumptions of IMF (Chabrier, 2003) and stellar population templates (Bruzual & Charlot, 2003). Using the median mass estimate, we select a mass-limited () sample of 14,513 potential companion galaxies in a redshift range (for breakdown, see Table 1). As described in the next section, this provides a sample with high completeness.
2.1.3 Sample Completeness
We demonstrate the completeness of massive CANDELS galaxies with redshifts by adopting the method introduced in Pozzetti et al. (2010) (also see Nayyeri et al., 2017). Briefly, Pozzetti et al. computes a stellar-mass limit as a function of redshift, above which nearly all the galaxies are observable and complete. They do so by estimating the limiting stellar-mass () distributions for the 20% faintest sample population222By considering the 20% faintest galaxy sample of the apparent magnitude distribution at each redshift bin, only those galaxies with representative mass-to-light ratios close to the are used towards estimating the (see Pozzetti et al., 2010, for additional details)., where of a galaxy is the mass it would have if the apparent magnitude () is equal to the limiting -band magnitude (). We estimate the by following Nayyeri et al. relation between the observed galaxy and its as (see Nayyeri et al., 2017) and use the published -band limiting magnitudes (Grogin et al., 2011; Koekemoer et al., 2011; Galametz et al., 2013; Nayyeri et al., 2017; Stefanon et al., 2017).
In Figure 1, we show the normalized cumulative distributions of for the 20% faintest CANDELS galaxy samples333We compute the distributions independently for the five CANDELS fields and present the mean of them at each redshift slice. We find that the behavior of individual field distributions is not significantly different from each other and with the mean distribution. in narrow () redshift slices at . At all redshift bins up to , we find that all the galaxies in our mass-limited sample have , which implies completeness. At redshifts and , we find that the desired sample selection is complete and complete, respectively. Additionally, we test the impact of surface brightness on the measured stellar-mass completeness by analyzing the effective -band surface brightness (SBH) distributions of our desired mass-limited galaxy sample at five redshift bins between . We use a -band surface brightness limit SB based on the model-galaxy recovery simulations by Man et al. (2016) and find that and of our desired galaxies have SB at redshifts and , respectively. This implies that even the population that constitutes lowest 10% of the SBH distribution (low surface brightness galaxies; hereby LSB galaxies) in our desired sample can be robustly detected up to . As the LSB galaxies only make up a small fraction (less than 10%) of our desired mass-limited sample, we expect that a smaller completeness among these LSB galaxies will not have an significant impact on the close-pair statistics presented in this study. These tests permit us to robustly search for major companions associated with galaxies unaffected by significant incompleteness. We include the breakdown of massive galaxies per CANDELS field in Table 1.

2.2 SDSS
2.2.1 Redshifts & Stellar Masses
To anchor evolutionary trends to , we employ redshifts and stellar masses from Sample III of the SDSS Group Catalog described in Yang et al. (2007). Briefly, this catalog contains galaxies spanning a redshift range from the square degree sky coverage of the SDSS Data Release 4 (DR4, Adelman-McCarthy et al., 2006). Yang et al. computed color-based estimates using the Bell et al. (2003) SED fitting based mass-to-light ratio calibrations and K-corrections from the NYU-VAGC (Blanton et al., 2005). For consistency, these masses were corrected by dex to convert from a ‘diet’ Salpeter IMF to a Chabrier (2003) IMF basis as in CANDELS. Besides the IMF, Bell et al. assumed similar exponentially declining star formation histories as the CANDELS team participants, but used PÉGASE stellar population models (Fioc & Rocca-Volmerange, 1997) in contrast to Bruzual & Charlot (2003), respectively (for details, see Mobasher et al., 2015). However, de Jong & Bell (2007) explored the impact of these model assumptions and found that both PÉGASE and Bruzual & Charlot (2003) yield similar results in terms of Bell et al. color and mass-to-light ratio calibrations. In addition for a sample of galaxies with SDSS+GALEX photometry, Moustakas et al. (2013) found good agreement between SED fitting-derived stellar masses and independent SDSS photometry-based estimates. Hence, we conclude that the CANDELS and SDSS stellar mass estimates are not systematically different.
We select Sample III galaxies within a redshift range and sky area sq.deg ( & ) to match the CANDELS sample in volume and resolution. Using these cuts, we find 9183 galaxies with . We present the SDSS selection information in Table 1. We are aware of more recent datasets than the SDSS-DR4; e.g.,the SDSS-DR7 (Abazajian et al., 2009) has an improvement in photometric calibration from 2% (DR4) to 1% (DR7). However, owing to the contribution from random and model dependent systematic uncertainties for Bell et al. estimates, we argue that these small photometric improvements have no significant impact on our results. Hence, we use the SDSS-DR4 because it is readily available and it meets our volume and resolution requirements.
| Name | Phot Sources | Redshift Range | |||
|---|---|---|---|---|---|
| (1) | (2) | (3) | (4) | (5) | |
| UDS | 35932 (33998) | 3019 (260) | 1223 (141) | ||
| GOODS-S | 34930 (34115) | 2491 (892) | 942 (403) | ||
| GOODS-N | 35445 (34693) | 2946 (494) | 1133 (209) | ||
| COSMOS | 38671 (36753) | 3232 (11) | 1307 (9) | ||
| EGS | 41457 (37602) | 2825 (199) | 1093 (72) | ||
| CANDELS (Total) | 186,435 (177,161) | 14,513 (1856) | 5698 (834) | ||
| SDSS-DR4 (1790 sq. deg) | 141,564 | 9183 (8524) | 4098 (3859) |
2.2.2 Sample Completeness
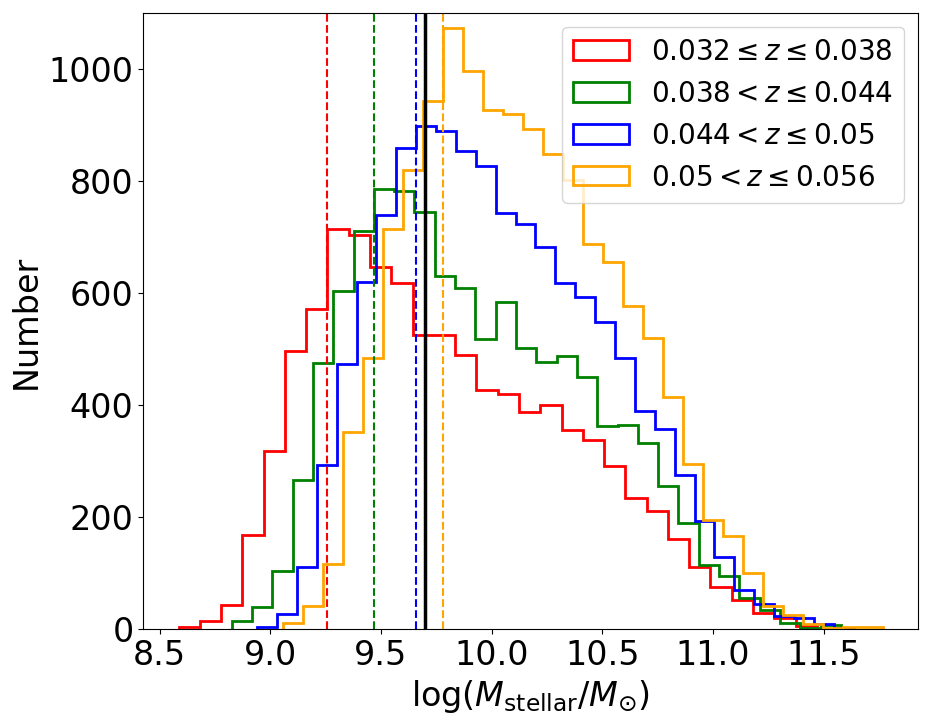
The Yang et al. (2007) sample is magnitude-limited ( mag) due to the SDSS spectroscopic target selection; this provides a % completeness (Strauss et al., 2002). Yang et al. included additional redshifts from supplementary surveys to improve the incompleteness due to spectroscopic fiber collisions (Blanton et al., 2003). As such, our sample selection has 92.8% completeness (Table 1). Nevertheless, several merger studies demonstrate that the SDSS spectroscopic incompleteness grows with decreasing galaxy-galaxy separation (McIntosh et al., 2008; Weston et al., 2017). We account for this issue and provide detailed corrections in § 3.2. In addition, we demonstrate the stellar mass completeness of galaxies by employing the method by Cebrián & Trujillo (2014). In Figure 2, we show the stellar mass distributions for narrow redshift intervals () at . We find that the mag limit produces a turnover in counts at different masses as a function of redshift. At , the mass at which the distributions turn over (become incomplete) is well below our limit of . This indicates that our mass-limited sample is highly complete for selecting possible major companions in a complete sample of massive galaxies with and (see Table 1).
2.3 Selection of Massive Galaxies Hosting Major Companions
2.3.1 Projected Separation
With our well-defined mass-limited samples for CANDELS and SDSS in hand, we start by identifying the massive () galaxies hosting a major projected companion satisfying and a projected physical separation of . The choice of kpc is common in close-pair studies (Patton & Atfield, 2008; Lotz et al., 2011; de Ravel et al., 2011) which is supported by the numerical simulation results showing that major bound companions with this separation will merge within Gyr. Additionally, source blending from smaller separations () can cause incompleteness at for SDSS and at for CANDELS. Thus, we adopt a lower limit of kpc ( the resolution), which also corresponds to the typical sizes of galaxies at . In summary, we find and unique (i.e., duplicate resolved) massive galaxies hosting major projected companions in SDSS () and CANDELS (total of all five fields at ), respectively. We tabulate the breakdown of by redshift per each CANDELS field in Table 2.
2.3.2 Plausible Physical Proximity (SDSS)
We note that projected proximity does not guarantee true physical proximity as foreground and background galaxies can be projected interlopers. A common and effective method to define physical proximity is to isolate systems with a small velocity separation, which indicate that the host and companion galaxies are plausibly gravitationally bound. For the SDSS sample, we employ the common criteria (e.g., Kartaltepe et al., 2007; Patton & Atfield, 2008; Lin et al., 2008), where and are the velocities of the host and companion galaxies, respectively. Merger simulations find that systems that satisfy typically merge within Gyr (e.g., Conselice, 2006). Other studies show that close-pair systems with are not likely to be gravitationally bound (e.g., Patton et al., 2000; De Propris et al., 2007). However, owing to spectroscopic redshift incompleteness (see § 2.2.2), we are only able to apply this velocity selection to a subset of galaxies from § 2.3.1 which have spectroscopic redshifts. In doing so, we find massive galaxies hosting a major projected companion (in § 2.3.1) meeting criteria in the SDSS () sample. We describe the statistical correction for missing major companions due to spectroscopic incompleteness in § 3.2.
2.3.3 Plausible Physical Proximity (CANDELS)
Most galaxies in the CANDELS catalogs do not have a spectroscopic redshift. Hence, we use a proximity method based on photometric redshifts and their uncertainties () to select plausible, physically close companions (e.g., Bundy et al., 2009; Man et al., 2011, 2016). As described in § 2.1.2, each galaxy’s value is the median of the peak values () of multiple photometric distributions computed by the CANDELS team. However, the data was not thoroughly analyzed to derive errors for all of the CANDELS fields. Thus, we compute values from a single participant dataset that produces values that are consistent with the published team values. This is necessary to achieve errors that are consistent with the and stellar masses (calculated with ) that we use in this study. We find that the S. Wuyts444Method 13 as specified in Dahlen et al., 2013. photometric redshifts produced the best match to (see Appendix I) after testing all participant data. The Wuyts distributions for each CANDELS galaxy were computed using the photometric redshift code EAZY (Brammer et al., 2008) and PÉGASE (Fioc & Rocca-Volmerange, 1997) stellar synthesis template models. We optimize555We shift the distributions and raise them to a power such that when compared to the test set of spectroscopic redshifts (), the 68% confidence interval of the should include 68% of the time. A detailed description is given in Kodra et al., in preparation. the for each galaxy and use this distribution to compute the uncertainty () defined as the 68% confidence interval of the photometric redshift (see Kodra et al., in preparation for details).
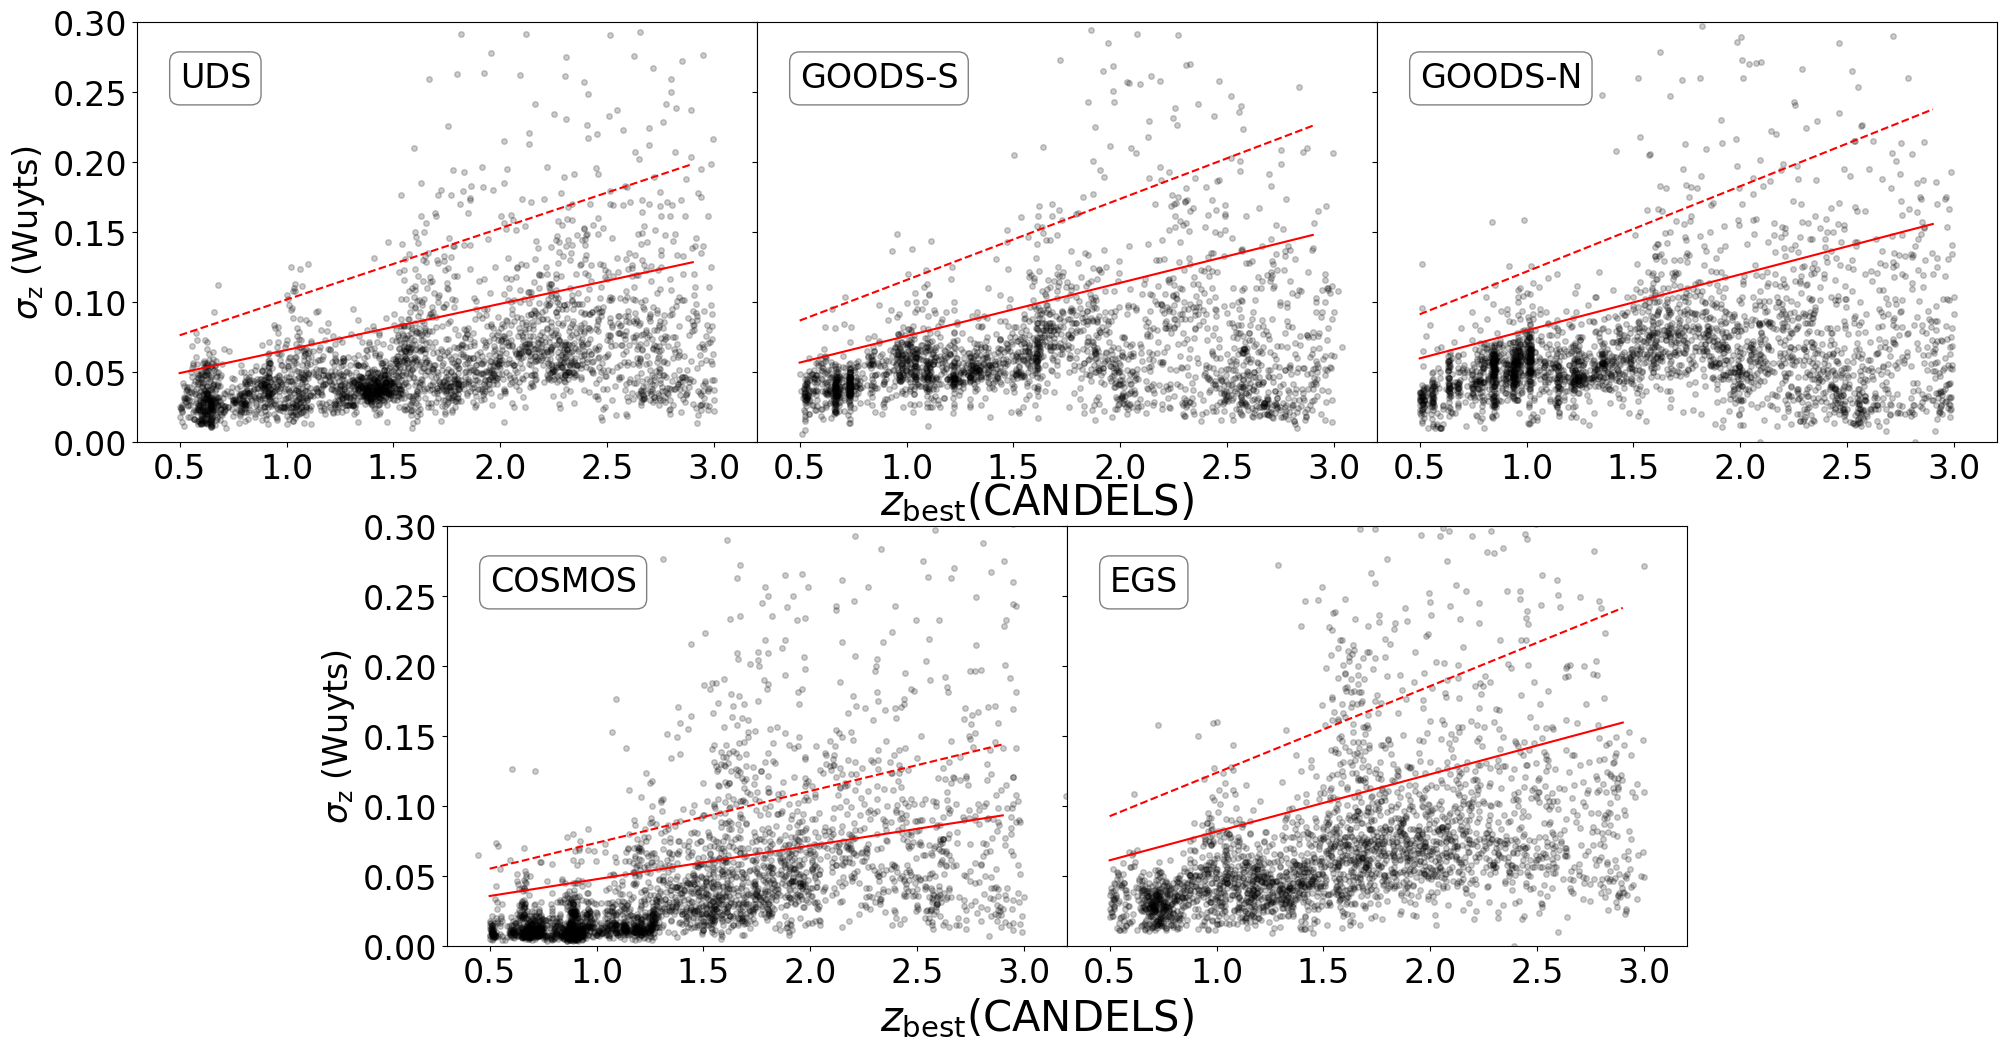
In Figure 3, we show the photometric redshift uncertainties () as a function of for each galaxy in our sample (). We find that the distributions in the CANDELS fields are qualitatively similar to each other. We find the distributions have small scatter up to with their medians typically ranging between , and much larger scatter at with the medians ranging between . This large scatter is because the observed filters no longer span the 4000Å break, which leads to larger uncertainties during template SED-fitting (for additional details, see Kodra et al., in preparation). For each CANDELS field, we show the 80% and 95% outlier limits of the redshift normalized error [] distribution and present their values in Table 3. While the 95% clipping limit rejects extreme outliers typically with , the 80% limit does a reasonable job representing the upper envelope of the distribution at all redshifts. Therefore, to exclude galaxies with large errors, we elect to exclude those above the 80% clipping limit. Hereafter, we define the large-error as unreliable.
For each galaxy in our CANDELS sample, we adopt the Bundy et al. (2009) (hereafter, B09) redshift proximity criteria given by :
| (1) |
where is the redshift difference of the host and companion galaxies, and and are their photometric redshift errors, respectively. It is important to note that projected pairs containing widely separated galaxies in redshift space that have large errors can satisfy Equation 1. Hence, we apply the redshift proximity criteria only to those galaxies with reliable photometric redshifts. In summary, we select massive galaxies hosting major companions satisfying kpc, , and Equation 1. We present the breakdown of in each redshift bin per CANDELS field in Table 2.
In § 3.1, we describe a statistical correction to add back a subset of galaxies excluded because of an unreliable that could be statistically satisfying the redshift proximity criteria. Additionally, owing to the possibility that some companion galaxies may satisfy the close redshift proximity criterion by random chance, we discuss the statistical correction for random chance pairing in § 3.3.3. We acknowledge the mismatch between the redshift proximity methods that we employ for the SDSS and CANDELS. In § 4, we test the impact of this mismatch and find that it does not significantly impact our results and conclusions.
3 Frequency of Major Merging
To track the history of major merging, we start by analyzing the fraction of massive () galaxies hosting a major companion selected in § 2.3. The major companion fraction666While the companion fraction is related to the pair fraction, it is important to be clear that it is not the same (see § 5.1). is
| (2) |
where at each redshift bin, is the number of massive galaxies hosting a major companion after statistically correcting the counts (see §§ 3.1 and 3.2), and is the number of massive galaxies. The companion fraction is commonly used in the literature, and is the same as used by Man et al. (2016). We use the samples described in § 2.3 to derive separately for the five redshift bins in CANDELS () and for the SDSS anchor. We then discuss the application of a correction to account for galaxies satisfying the companion selection criteria by random chance. Finally, we characterize the companion fraction and use an analytical function to quantify the redshift evolution of during .
3.1 Deriving for CANDELS
For redshifts , we compute corrected for incompleteness owing to unreliable photometric redshifts as
| (3) |
where is the number of massive galaxies with reliable values that host a major companion (§ 2.3.3), is the number of galaxies hosting major projected companions that are excluded because of unreliable values (§ 2.3.1), and is the correction factor used to statistically add back a subset of excluded galaxies that are expected to satisfy the redshift proximity criteria we employ. We estimate as
| (4) |
To study from the overall sample and also its field-to-field variations, we calculate for five bins separately for each CANDELS field and for the total sample using counts tabulated in Table 2. For example, in the bin, CANDELS contains 671 massive galaxies with reliable values hosting a major projected companion. This results in and a corrected count of ; i.e., we add back 29% of the previously excluded galaxies at these redshifts. We tabulate and values in Table 2. We also note no significant difference in the computed values whether we use an 80% or 95% clipping limit (§ 2.3) to remove unreliable photometric redshifts.
3.2 Deriving for SDSS
To achieve an accurate low-redshift anchor for the fraction of massive galaxies hosting a major companion meeting our velocity separation criterion, we calculate corrected for the SDSS spectroscopic incompleteness that varies with projected separation using bins as follows:
| (5) |
For each of nine bins between kpc, we compute a correction factor necessary to add back a statistical subset of the galaxies in the bin that lack spectroscopic redshifts but that we expect to satisfy the criterion. Following the same logic as in Equation 4, we estimate this correction at each bin based on the counts of spectroscopic galaxies hosting a major projected companion and the fraction that satisfy . Owing to our well-defined sample volume (), the total sample of spectroscopic hosts with plausible physical companions (§ 2.3.2) is limited to over the nine separation bins. To reduce random errors from small number statistics, we use a larger redshift range () and SDSS footprint (), to calculate the correction factor at each bin:
| (6) |
In Figure 4, we plot and the factors in Equation 5 as a function of using this larger sample (emphasized with a prime). For example, in the separation bin, we find 119 massive galaxies hosting a major projected companion, of which 35 have small velocity separations and 44 lack spectroscopic redshifts. This results in a 47% correction () at this separation. We find the probability for a small-separation pair ( kpc) to satisfy (despite lacking the redshift information) is 85% () and this rapidly decreases to % () at kpc, and remains statistically constant between kpc. This correction is important since the spectroscopic incompleteness ranges from 0.6 ( kpc) to 0.2 ( kpc) over the separations we probe, which is in agreement with trends published in Figure 2 from Weston et al. (2017).
| Name | Redshift | (%) | (%) | ||||||
|---|---|---|---|---|---|---|---|---|---|
| (1) | (2) | (3) | (4) | (5) | (6) | (7) | (8) | (9) | (10) |
| 256 | 132 (16) | 44 | 0.38 | 50 | |||||
| 304 | 130 (23) | 34 | 0.32 | 41 | |||||
| UDS | 290 | 130 (30) | 25 | 0.25 | 33 | ||||
| 216 | 80 (31) | 14 | 0.29 | 23 | |||||
| 157 | 82 (42) | 3 | 0.07 | 6 | |||||
| 216 | 107 (21) | 32 | 0.37 | 40 | |||||
| 252 | 116 (14) | 34 | 0.33 | 39 | |||||
| GOODS-S | 213 | 87 (22) | 15 | 0.23 | 20 | ||||
| 138 | 56 (14) | 3 | 0.07 | 4 | |||||
| 123 | 57 (15) | 5 | 0.12 | 7 | |||||
| 333 | 195 (33) | 56 | 0.35 | 67 | |||||
| 278 | 140 (27) | 40 | 0.35 | 50 | |||||
| GOODS-N | 209 | 99 (20) | 15 | 0.19 | 19 | ||||
| 191 | 83 (17) | 6 | 0.09 | 8 | |||||
| 122 | 61 (16) | 5 | 0.11 | 7 | |||||
| 448 | 244 (38) | 40 | 0.19 | 47 | |||||
| 270 | 128 (37) | 1 | 0.01 | 1 | |||||
| COSMOS | 350 | 157 (75) | 15 | 0.18 | 29 | ||||
| 153 | 86 (54) | 0 | 0.0 | 0 | |||||
| 86 | 36 (22) | 6 | 0.43 | 15 | |||||
| 224 | 120 (19) | 21 | 0.21 | 25 | |||||
| 304 | 137 (19) | 36 | 0.31 | 42 | |||||
| EGS | 331 | 171 (50) | 39 | 0.32 | 55 | ||||
| 167 | 94 (18) | 23 | 0.3 | 28 | |||||
| 67 | 35 (13) | 2 | 0.09 | 3 | |||||
| 1477 | 798 (127) | 193 | 0.29 | 230 | 0.15 | ||||
| 1408 | 651 (120) | 145 | 0.27 | 173 | 0.17 | ||||
| All fields | 1393 | 644 (197) | 109 | 0.24 | 155 | 0.18 | |||
| 865 | 399 (134) | 46 | 0.17 | 63 | 0.25 | ||||
| 555 | 271 (108) | 21 | 0.13 | 38 | 0.22 |
| Name | 80% limit | 95% limit |
|---|---|---|
| (1) | (2) | (3) |
| UDS | 0.033 | 0.051 |
| GOODS-S | 0.038 | 0.058 |
| GOODS-N | 0.04 | 0.061 |
| COSMOS | 0.024 | 0.037 |
| EGS | 0.041 | 0.062 |

3.3 Redshift Evolution of Major Merging Frequency
We use the corrected counts of massive galaxies hosting a major companion to compute the companion fraction (; see Equation 2) in the SDSS and CANDELS. We compare field-to-field variations of in CANDELS, quantify the redshift evolution of the from to , and measure the impact of random chance pairing on the observed major companion fraction evolutionary trends.
3.3.1 Field-to-Field Variations
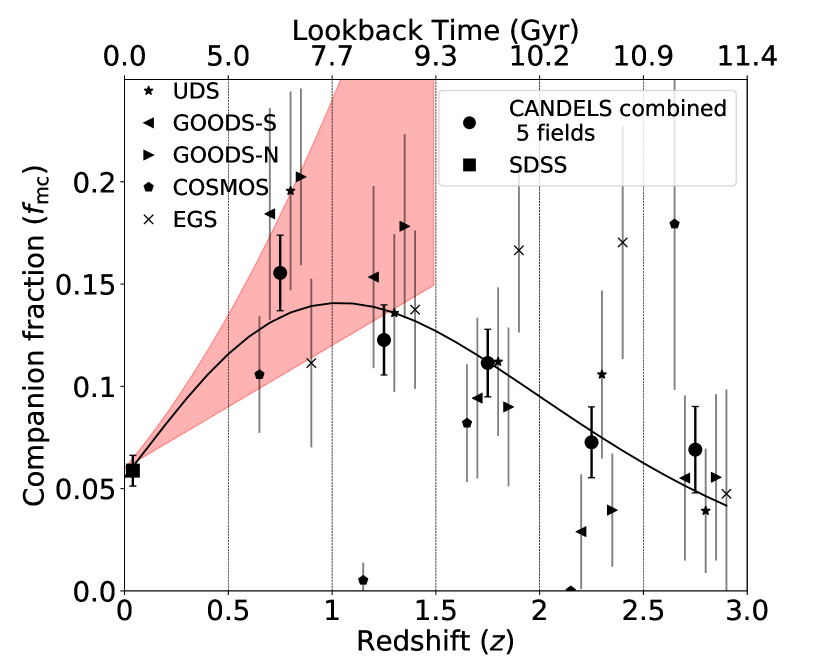
In Figure 5(a), we plot for the combined CANDELS fields and compare this with the individual fractions from each field at each redshift; these are also tabulated in Table 2. Despite noticeable variations between the fractions derived from each CANDELS field owing to small-number statistics, we find fair agreement between multiple fields at each redshift. We note that the combined CANDELS sample and three individual fields (UDS, GOODS-S, and GOODS-N) show consistent trends with the highest merger fractions at , which then steadily decrease with increasing redshift. The EGS and COSMOS companion fractions exhibit different behavior with redshift, the former peaks at while the latter has no trend with redshift owing to a lack of galaxies hosting major companions in two different redshift bins. We compute the cosmic-variance () on the combined CANDELS values using the prescription by Moster et al. (2011). For galaxies at populating the five CANDELS fields each with an area of arcmin2 such that their cumulative area matches that of the total CANDELS coverage ( arcmin2), we find that the number counts of galaxies hosting major companions have ranging from () to ()777We take into account that is smaller for multiple, widely separated fields when compared to the of a single contiguous field. For additional details, see Moster et al. (2011). While most of the individual CANDELS-field fractions are consistent with the within their large uncertainties (owing to small sample size), few values (e.g., at for the COSMOS and EGS fields; see Figure 5a) are significantly above the possible cosmic-variance limits.
3.3.2 Analytical Fit to the Major Companion Fraction Evolution
To characterize the redshift evolution of the companion fraction during , we anchor the combined CANDELS measurements to the SDSS-derived data point at . As shown in Figure 5(a), the low-redshift fraction is lower than the maximum value at , which then decreases to at . This suggests a turnover in the incidence of merging sometime around , in agreement with some previous studies (Conselice et al., 2003; Conselice et al., 2008a). Previous close-pair-based studies at find fractions (Patton et al., 2000; Patton & Atfield, 2008; Domingue et al., 2009), but they used criteria that are different from our fiducial selection. Similarly, many empirical, close-pair-based studies in the literature broadly agree that rises at but with a range of evolutionary forms owing to varying companion selection criteria (for discussion, see Lotz et al., 2011). After normalizing for these variations, we note that our SDSS-based is in good agreement with previous close-pair-based estimates, and our rising trend (see shaded region, Figure 5a) between is in broad agreement with other empirical trends. In § 5, we will present detailed comparisons to other studies by re-computing based on different companion selection choices that match closely with others.
All studies that measured redshift evolution of merger frequency at , irrespective of the methodology, have used the power-law analytical form to represent the best-fit of . This functional form cannot be used to represent the observed rising and then decreasing for redshift ranges . Therefore, following Conselice et al. (2008a) and initially motivated by Carlberg (1990), we use a modified power-law exponential function given by
| (7) |
As demonstrated in Figure 5(a), this analytic function provides a good fit to the observed evolution. The best-fit curve to the fractions derived from the SDSS and CANDELS measurements from our fiducial companion selection criteria has parameters , , and . We note that we will apply this fitting function for different companion selection choices throughout our comparative analysis described in §§ 4 and 5.
3.3.3 Correction for Random Chance Pairing
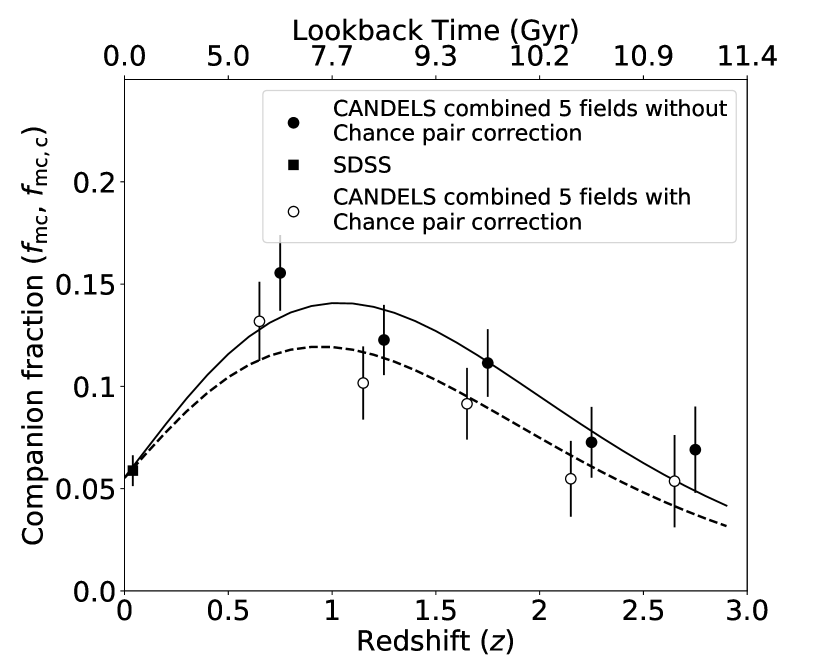
Finally, we note that a subset of massive galaxies hosting a major companion () can satisfy the companion selection criteria by random chance. To account for this contamination, we apply a statistical correction and recompute the counts for the combined CANDELS sample per redshift bin as in each redshift bin. To compute , we generate 100 simulated Monte-Carlo (MC) randomized datasets888We generate these datasets by randomizing the positions of each galaxy in the mass-limited sample and repeating the selection process in § 2.3. We define in each redshift bin as the ratio of massive galaxy number counts hosting major companions which satisfy our projected separation and photometric redshift proximity criteria in the MC datasets (i.e., by random chance) to the measured (§§ 3.2 and 3.1). For example, in redshift bin , we find that 17% of galaxies statistically satisfy the companion selection criteria by random chance. We tabulate values at each redshift for CANDELS in Table 2. We repeat this process for the SDSS () and find a very small correction of (). This demonstrates the very low probability for two SDSS galaxies to satisfy both the close projected separation and stringent spectroscopic redshift proximity () criteria.
In Figure 5(b), we compare the random chance corrected fractions at each redshift bin from CANDELS, to the uncorrected values copied from the left panel. Owing to the insignificant 1% correction at , we anchor both the corrected and uncorrected fits to the same SDSS data point. We find that follows the same evolutionary trend as , in which the best-fit curve rises to a maximum fraction at and then steadily decreases to . At all redshifts, is within the statistical errors of . The qualitatively similar redshift evolutionary trends of and is due to the nearly redshift independent amount of statistical correction for random pairing () at . This is because of the nearly invariant angular scale in this redshift range, which results in similar random chance pairing probabilities. We note that some previous close-pair-based studies have applied this random chance correction (Kartaltepe et al., 2007; Bundy et al., 2009), while others have not (e.g., Man et al., 2012).
4 Impact of Close-Companion Selection Criteria on Empirical Major Companion Fractions
So far, we have discussed the derivation and redshift evolution of the major companion fraction based on our fiducial selection criteria described in § 2.3. As illustrated in Table 5, previous studies have employed a variety of criteria to select companions. In this section, we study the impact of different companion selections on derived from our sample. We systematically vary each criterion (projected separation, redshift proximity, and stellar mass ratio versus flux ratio) individually, while holding the other criteria fixed to their fiducial values. Then, we compare each recomputed to the fiducial result from Figure 5. In § 3.3.3, we show that applying a statistical correction for random chance pairing will produce companion fractions that are lower at each redshift interval between . Therefore, we focus the following comparative analysis on uncorrected fractions and note that our qualitative conclusions are robust to whether or not we apply this correction.
4.1 Projected Separation
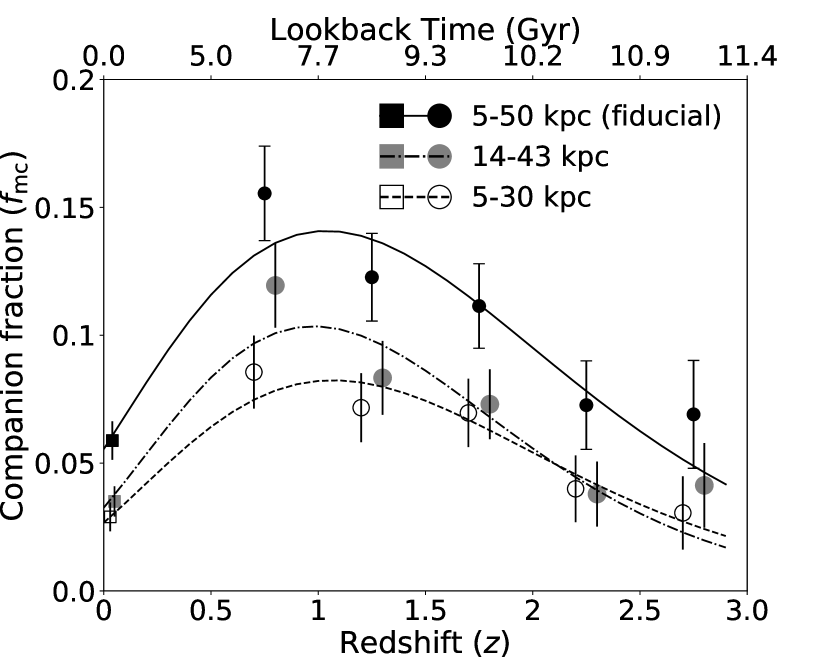
To quantify the impact that changing only the criterion for companion projected separation will have on , we compare fractions based on the fiducial selection to those derived from two common criteria: (e.g., Lin et al., 2008; Man et al., 2016) and (e.g., Patton & Atfield, 2008; Man et al., 2012). For each case, we hold all other companion selection criteria fixed such that we are strictly comparing fractions of major (stellar mass-selected) companions in close redshift proximity that are found within projected annular areas of and the fiducial selection window (), respectively.
In Figure 6, we plot the fiducial and non-fiducial data and their best-fit curves. The key result from this figure is the observed redshift evolution of major companion fractions shown in Figure 5 are qualitatively robust to changes in the projected separation criterion. For each case, we find the fractions increase from low redshift to , then turn over and decrease fairly steadily to . Quantitatively, the non-fiducial fractions are well fit by the same functional form as the fiducial results (see Table 4). Owing to the size of the best-fit confidence intervals, the redshifts of the peak fractions are statistically equivalent. Larger samples of massive galaxy-galaxy pairs at redshifts are needed to place stringent constraints on the peak or turnover redshift.
Besides the overall trends with redshift, we find that both smaller projected separation criteria select smaller values than the fiducial selection does, as we expect. Despite being a factor of two smaller in projected area, the conservative criterion coincidentally produces fractions that are statistically matched to those from the larger selection criterion at most redshift intervals. Only the bin has unequal companion fractions between the two non-fiducial criteria. The coincidental finding of similar fractions using different projected separation criteria is consistent with an increased probability of physical companions at smaller projected separations (Bell et al., 2006b; Robaina et al., 2010).
| Major companion definition | Redshift Proximity | ||||
|---|---|---|---|---|---|
| (1) | (2) | (3) | (4) | (5) | (6) |
| MR | kpc | B09 | |||
| MR | kpc | B09 | |||
| MR | kpc | B09 | |||
| MR | kpc | modM12 | |||
| MR | kpc | hybB09 | |||
| FR | kpc | B09 |
4.2 Redshift Proximity
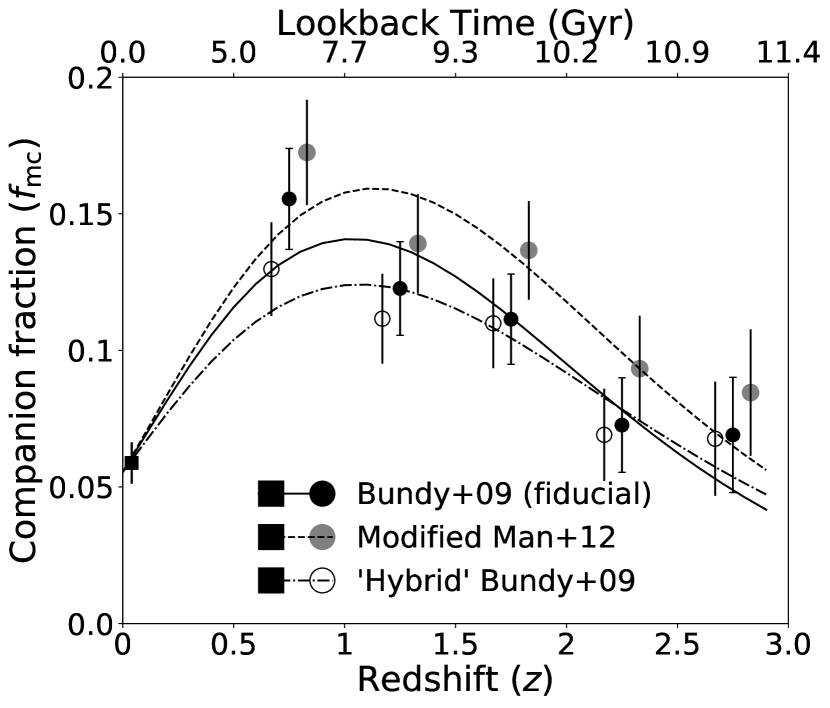
Following a similar methodology as in § 4.1, we quantify the impact that changing only the criterion for redshift proximity will have on . As described in § 2.3.2, we apply selections based on photometric redshifts and their uncertainties only to CANDELS data, and we anchor our evolutionary findings to stringent velocity-separation-based companion fractions at from the SDSS. As such, we first compare CANDELS fractions () based on our fiducial B09 selection given in Equation 1 to fractions based on two other related methods. Then we demonstrate that the low-redshift fraction from the SDSS changes very little () if we select major companions using simulated photometric redshift errors that are similar in quality to the CANDELS values, rather than use our fiducial selection criterion ( km s-1).
In Figure 7, we plot data and best-fit curves for our fiducial selection and two additional methods. In each non-fiducial case, we hold the projected separation and mass ratio selection criteria fixed to our fiducial choices. The first method is a simple overlapping of the host and companion galaxy photometric redshift errors
| (8) |
This criterion is modified from Man et al. (2012) who used redshift overlap at the level. As with fiducial selection, we apply this criterion only to those galaxies with reliable photometric redshifts (see § 2.3.2). Second, we incorporate available spectroscopic redshifts for the host and/or companion galaxies from CANDELS into a ’hybrid’ of our fiducial B09 redshift proximity selection as follows:
-
a)
if both galaxies have data, then the pair must satisfy ;
-
b)
or if only one galaxy has data, then must be within limit of the other galaxy;
-
c)
otherwise use B09 criterion.
As with changing the project separation for selecting close companions, the key takeaway from Figure 7 is the redshift evolution trends for are robust to slight modifications in the redshift proximity criterion. Both non-fiducial companion fractions peak in the lowest-redshift CANDELS bin, the decline at and their redshift evolution anchored to the SDSS fraction are well fit by the same functional form with statistically equivalent best-fit parameters (see Table 4). Besides the similar evolutionary trends, we notice that the modified Man et al. criterion results in values that are systematically higher than the fiducial fractions between . This is expected since simple photometric redshift error overlap (Equation 1) is less stringent than a quadrature overlap; e.g., two galaxies with must have photometric redshifts within compared to 0.085 (fiducial). On the other hand, the hybrid B09 method yields % smaller major companion fractions than fiducial at owing to the availability of data for a fair fraction of CANDELS galaxies and the stringent criterion for this subset, but nearly identical fractions at for which the spectroscopic-redshift coverage becomes quite sparse.
We close our redshift proximity analysis by quantifying changes in the measurement from the SDSS data if we employ either the B09 or modified Man et al. photometric redshift error overlap criteria. We opt to generate simulated and for the SDSS sample such that these values mimic the quality of the CANDELS photometric data. First, we construct the combined distribution from all five CANDELS fields (see Fig. 3), apply a outlier clipping, and fit a normalized probability density function (PDF) to this distribution such that the area under the curve sums up to unity. Note that this PDF is the probability for each value and is different from discussed in § 2. For each galaxy, we set its SDSS redshift to and we assign it a value drawn randomly from the PDF distribution. Then, we repeat our close companion selections and find (B09) and 0.061 (modified Man et al.). The relative change in each fraction is roughly 3% compared to our fiducial selection of close velocity separation.
One can argue that actual data from the SDSS photometry will produce larger redshift errors and higher companion fractions. Yet, the motivation of this exercise is to quantify the difference between tight spectroscopic velocity separation versus photometric redshift proximity selection matched to the data, not to make our companion fraction more uncertain. We note that if we repeat this analysis by resampling each SDSS galaxy redshift from a PDF defined by its simulated , we find smaller major companion fractions since this effectively makes the redshift proximity worse (larger) and we demonstrated that companions have high probability of small velocity separations for the SDSS. Either way, all the SDSS anchors are significantly lower than the companion fractions at , which means the turnover trend in is a robust result.
4.3 Stellar Mass vs Flux Ratios
Our fiducial choice for selecting major companions is the stellar mass ratio criterion: . Some previous studies, in which galaxies lack stellar mass estimates, have used observed-band flux ratios of as a proxy for selecting major companions (e.g., Bell et al., 2006b; Bluck et al., 2009). Bundy et al. (2004) and B09 speculated that flux-ratio selection could preferentially lead to inflated companion counts especially at owing to increasing star formation activity. Two recent studies found conflicting trends in estimates between and (Man et al., 2012; Man et al., 2016). Here we quantify the impact that changing the major companion selection from 4:1 stellar mass ratio (MR) to 4:1 flux ratio (FR) has on companion fractions for massive galaxies in CANDELS and the SDSS while holding all other selection criteria fixed to fiducial values.
In Figure 8, we compare the fiducial MR-based to fractions based on -band (CANDELS) and -band (SDSS) 4:1 flux ratios. We find the FR-based major companion fractions follow starkly different evolutionary trends compared to MR-based fractions at . At , the FR and MR fractions both increase with redshift and agree within their 95% confidence limits. However, FR produces increasingly larger fractions from to that diverge away from the fiducial trends and grow times greater than MR-based fractions at these redshifts. We attempt to fit the FR-based with the same function form (Eq. 7) that we employ for MR fraction redshift evolution, but the best-fit parameter values (see Table 4) for the steadily increasing fractions between are statistically consistent with a simple power law since the FR fractions do not peak nor turn over at . Therefore, we refit the FR fraction evolution with a power law and find for .
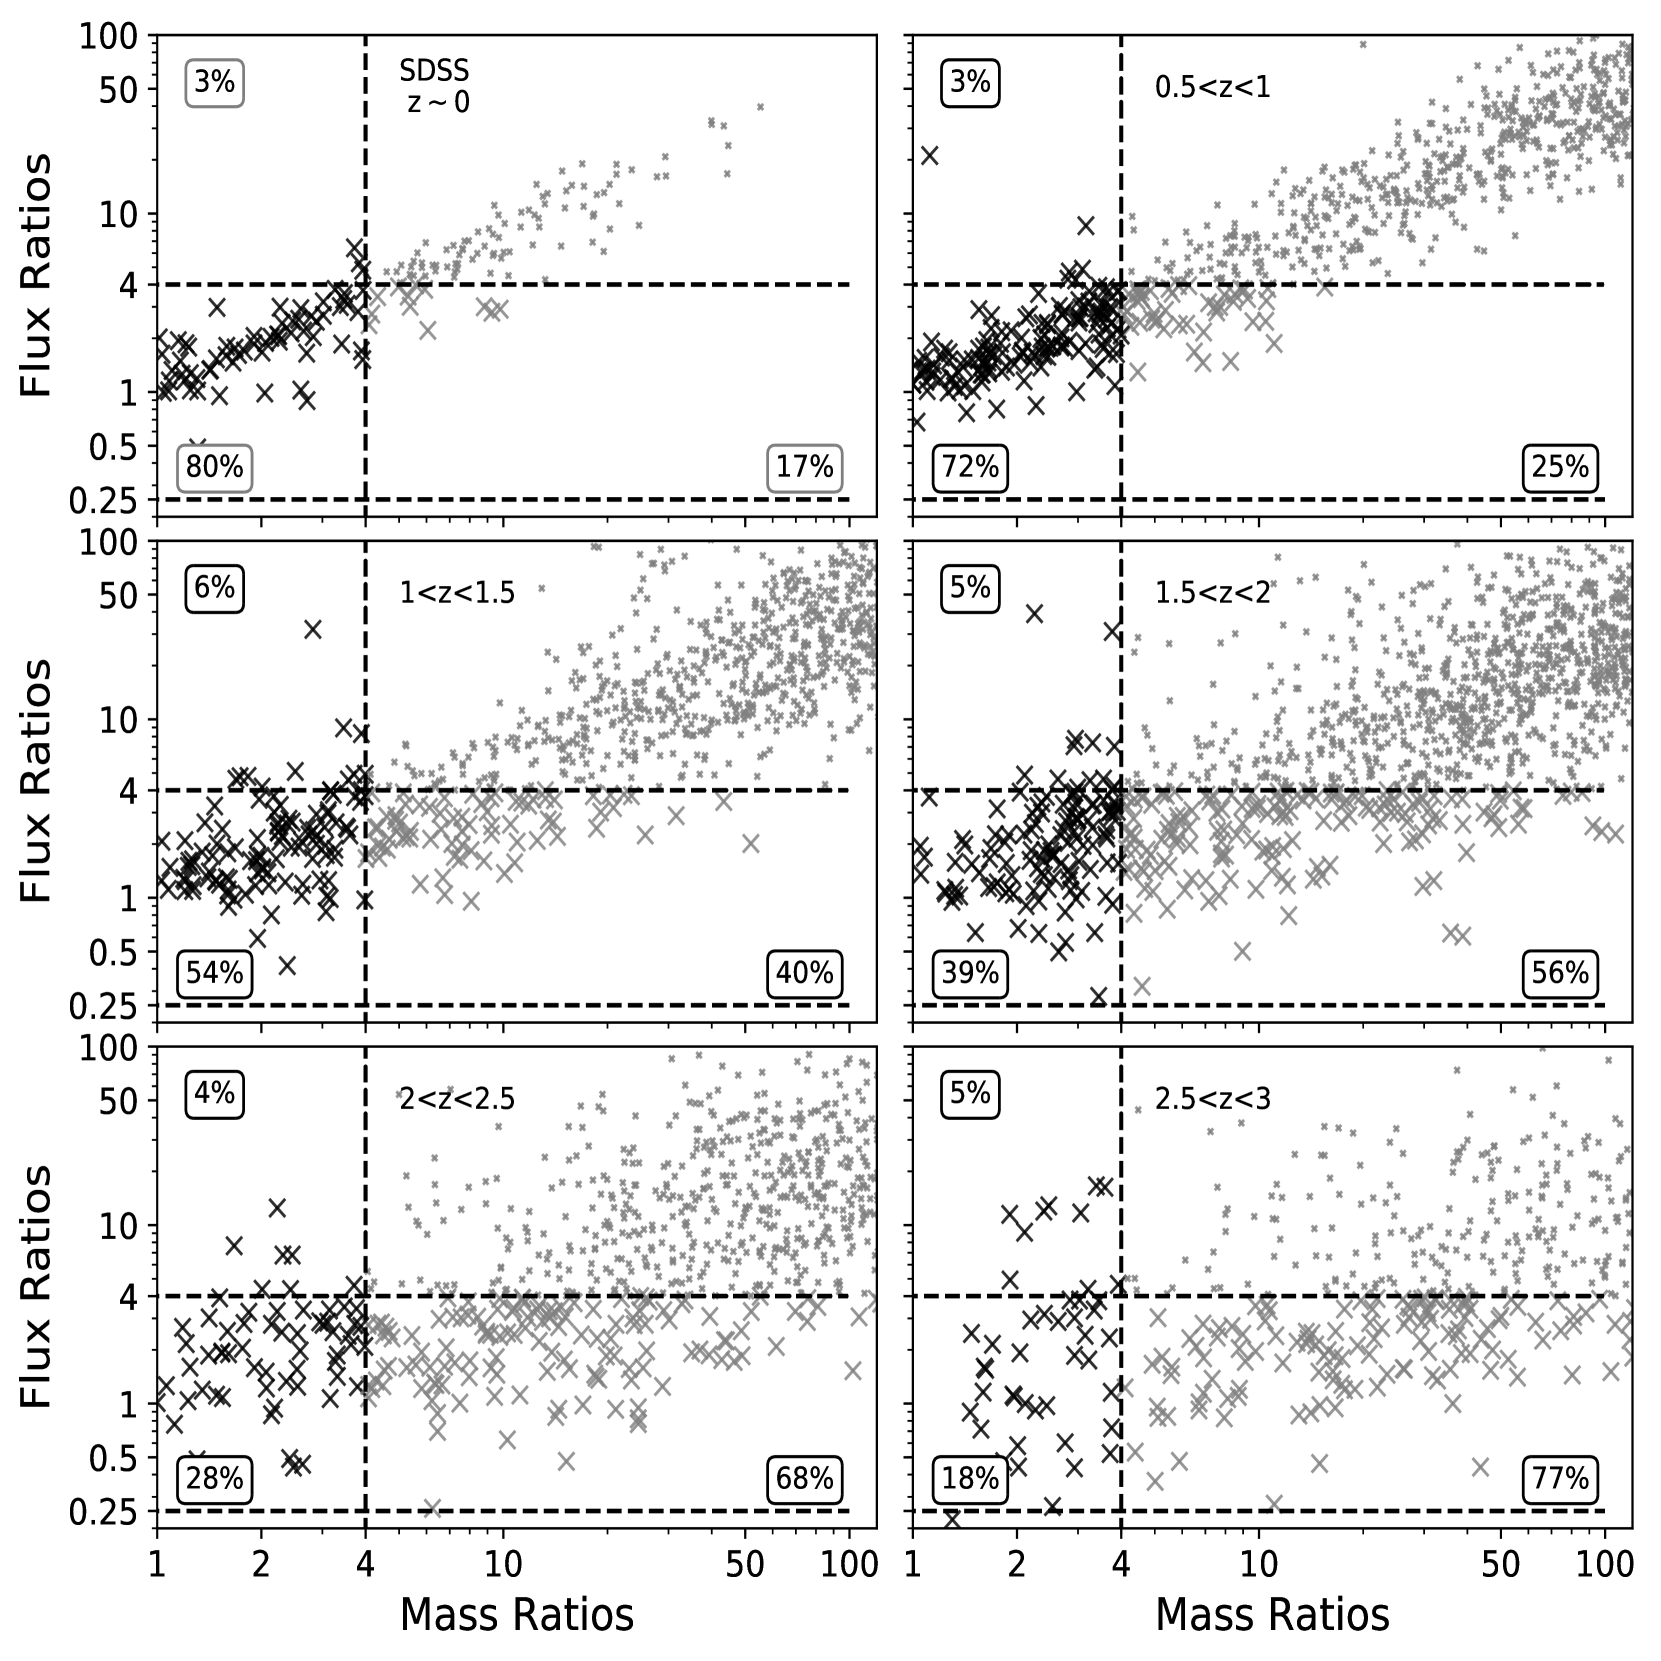
To better understand the striking differences between the FR and MR trends, we analyze stellar mass ratios and flux ratios of CANDELS and SDSS close-pair systems that satisfy our fiducial kpc separation and redshift proximity selections (see § 2.3.2) in Figure 9. At , we find good agreement between MR and FR values for a majority of major and minor () close-pair systems. The agreement suggests that -band (-band) flux ratios are a good approximation for stellar-mass ratios at (). In detail, 80% (72%) of SDSS (CANDELS) pairs are considered major pairs according to both FR and MR criteria. We find 17% (25%) of FR-based major pairs have a (minor) stellar mass ratio, and only 3% of MR-selected major pairs have minor flux ratios at .
In the bottom four panels of Figure 9, we notice that the FR-based major companion selection suffers a steadily increasing contamination by minor companions according to CANDELS stellar mass ratios. This contamination rises from 40% at to over three-quarters in the highest redshift interval. In contrast, our fiducial selection of major companions maintains a very small () constant contamination of pairs between . This analysis clearly demonstrates that FR selection results in inflated major companion counts at , confirming the result that significantly different mass-to-light ratio properties of the companion galaxies at may be the main cause of the contamination by minor companions (Man et al., 2016).

| Study | selection | Major Companion | Redshift Proximity | Primary galaxy selection | Redshift |
| (1) | (2) | (3) | (4) | (5) | (6) |
| Ryan08 | kpc | error overlap | |||
| Bundy09† | kpc | ||||
| Mundy17† | kpc | ||||
| Williams11 | kpc | ||||
| Newman12 | kpc | see caption | |||
| Man16 | kpc | same as Newman12 | |||
| Kartaltepe07 | kpc | km s-1 | |||
| Bundy09† | kpc | LOS | |||
| Man12 | kpc | error overlap | |||
| Bluck09,12 | kpc | line-of-sight correction | |||
| Lin08 | kpc | km s-1 | |||
| López-Sanjuan11† | kpc | km s-1 | , | ||
| Man16 | kpc | same as Newman+12 |
5 Discussion
Our extensive analysis of the full CANDELS sample and a well-defined selection of SDSS galaxies in the preceding sections provides a new baseline for the evolving frequency of massive galaxies with close major companions (and of major mergers by extrapolation) spanning epochs from the start of cosmic high noon to the present-day. In this section, we present a comprehensive comparison of our measurements to those from previous studies by taking advantage of our analysis of varying the companion selection criteria from § 4. We derive the empirical major merger rates based on a constant observability timescale and find significant variation in the rates depending on our stellar-mass ratio or -band flux-ratio choice. We discuss plausible reasons for these variations by re-computing merger rates based on theoretically-motivated, redshift-dependent timescale prescriptions. Finally, we describe the need for detailed calibrations of the complex and presumably redshift-dependent conversion factors required to translate from fractions to rates, which is key to improve major merger history constraints.
5.1 Comparison to previous empirical close-pair-based studies
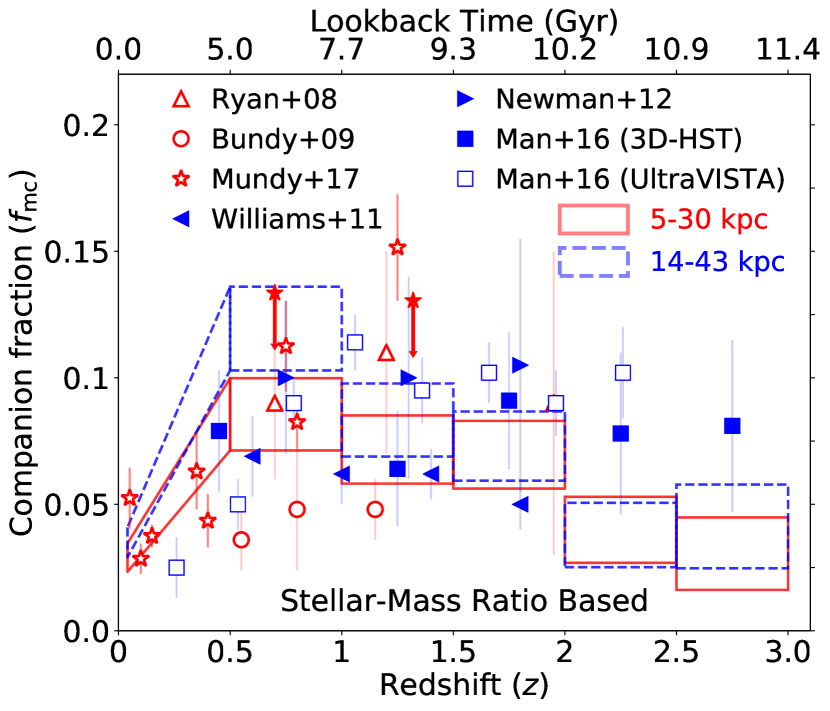
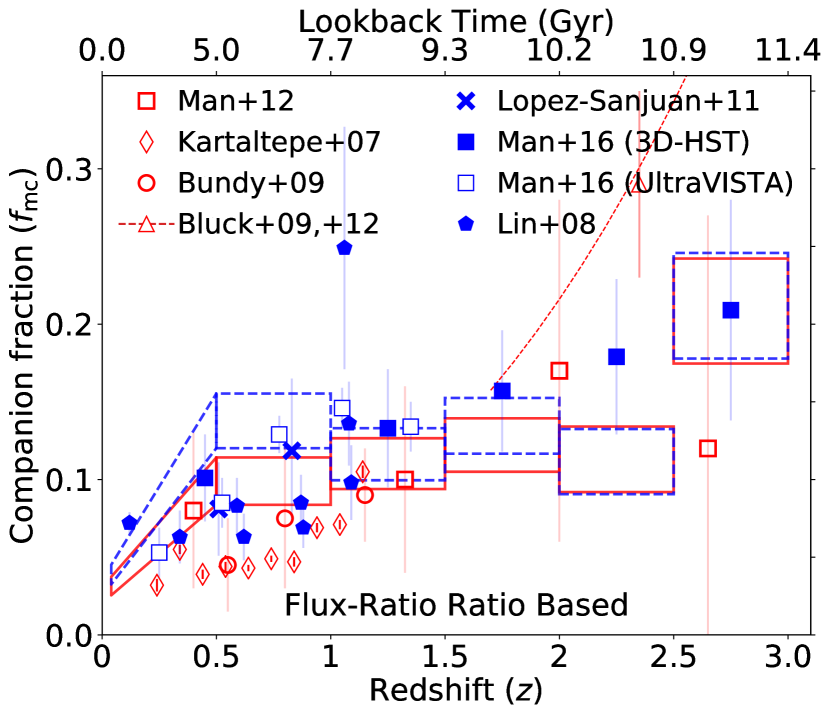
We compare our CANDELSSDSS major companion fractions from to the results from previous stellar-mass and flux selected, empirical close-pair-based studies tabulated in Table 5. We note that some studies quote fraction of pairs (), which is the fraction of close-pair systems among a desired massive galaxy sample of interest. This is different from the companion fraction . To correctly compare to previous studies which used a definition, we derive a simple conversion between the two definitions by separately computing the ratio of , which is constant for the CANDELS and SDSS samples at . Overall, our results are in good agreement with previous studies when we properly convert the published pair fractions into companion fractions. We separate our comparisons into stellar mass-ratio and flux-ratio based studies in Figure 10. For each set of comparisons, we further split them into matching kpc and kpc projected separation selections. We discuss each comparison with respect to any differences in the details of the redshift proximity selection.
5.1.1 Stellar Mass-Ratio Selected Studies
We use the kpc and kpc fractions from § 4.1 (Figure 6) and plot them in Figure 10 alongside previous studies that employed a similar projected separation criterion and 4:1 stellar mass-ratio selection (). We start our discussion by comparing to the studies that employed a kpc criterion. Ryan et al. (2008) studied major close pairs among galaxies more massive than over the redshift range , and found an un-evolving fraction (). We agree with these estimates within their quoted uncertainties; however, we acknowledge that the consistency at is because of their large error bar (). We also note that Ryan et al. used a overlap as their redshift proximity, which is less restrictive than our modified Man et al. (2012) redshift proximity criteria in Equation 8. Based on our analysis in § 4.2, this implies that the Ryan et al. fractions may be over-estimated. Next, we compare to B09 who studied kpc pairs among galaxies between using a redshift proximity that we have adopted as our fiducial choice. It is important to note that B09 elected a 4:1 -band flux ratio as their fiducial major companion selection criterion. However, in their analysis, they found that 80% of their flux-ration-selected companions also met stellar-mass ratio major companion selection. To appropriately compare to B09 pair fractions, we include a 0.8 multiplicative factor to covert them to mass-ratio-based . We find that their estimates are on average smaller than our fractions, marginally agreeing at , and disagreeing at .
We now compare to the most recent study by Mundy et al. (2017), who analyzed close pairs () among a sample of galaxies at from the UDS, VIDEO, GAMA, and COSMOS datasets. In Figure 10, we show all their pair fractions, except for an upper-limit of from COSMOS at and convert them to . We find excellent agreement between GAMA-survey-based, spectroscopically derived fraction at and our SDSS-based fraction at . For the same GAMA sample, they also computed the fractions using photometric redshifts and found an average of at . We separately computed the SDSS using B09 redshift proximity and matching their kpc selection, and find that our fraction is times smaller and marginally disagrees within their quoted uncertainties. At , we find that Mundy et al. fractions are in good agreement with our , except for their COSMOS-survey-based value at , which is marginally smaller than our . At , their fraction () is in disagreement with our findings, while their upper-limits are consistent with our results. Overall, we demonstrate good agreement with Mundy et al. (2017).
Now, we discuss our comparison to the studies that employed a kpc separation selection. We start with Williams et al. (2011), who studied major (4:1 stellar-mass ratio) close pairs among galaxies at , and found a diminishing redshift evolution of the fractions. We find disagreement with the Williams et al. fractions at , where our are higher by 25%, however, we show good agreement within their diminished fractions at . We note that our sample is almost two times larger than their galaxy sample, and a likely reason for this discrepancy is that their uncertainties may have been under-estimated. Next, we compare to Newman et al. (2012), who quantified major companion fraction among galaxies, and found that is flat (at ) at . We find good agreement with their findings within the quoted uncertainties and in that redshift range.
Finally, we compare to a recent study by Man et al. (2016) who study a sample of galaxies to constrain major companion fractions at using two separate datasets, namely 3D-HST and UltraVISTA. Firstly, we find that our values are in excellent agreement with the Man et al. 3D-HST estimates over their redshift range, which is not surprising as 3D-HST covers of the CANDELS fields. We find that the Man et al. UltraVISTA fractions follow an increasing trend that is qualitatively similar to our at , however, we notice that the former fractions are quantitatively smaller than the latter. At , we find that the UltraVISTA fractions are in good agreement with our results, except at , where our is two times smaller. Overall, we note that our companion fractions are in good agreement with Man et al. (2016) estimates. Moreover, Man et al. (2016) applied a parabolic fitting function to their UltraVISTA major companion fractions and report that their redshift evolution may be peaking around , in contrast to our fractions that peak around and diminish up to . This may be a consequence of more-massive galaxies experiencing growth earlier in cosmic-time than the less-massive population, which is often referred to as the galaxy-downsizing phenomenon. In summary, we conclude that our stellar-mass ratio based major companion fractions are in good agreement with previous empirical close-pair-based estimates, once they are closely-matched in selection criteria.
5.1.2 Flux Ratio Selected Studies
We separately derive the major companion fractions for and kpc selections using -band (-band) flux ratio selection for CANDLES (SDSS) and plot them in Figure 10 along side some published studies that used a similar projected separation and flux (luminosity) ratio selection (see Table 5). First, we discuss the comparison to those studies that employ kpc. We start with Kartaltepe et al. (2007), who studied close pairs using a -band luminosity-limited galaxy sample at , and found that the companion fraction evolves as . We find that Kartaltepe et al. estimates are times smaller than our results at , however, they start to converge at and , and agree with our at . We note that Kartaltepe et al. uses a smaller separation annulus of kpc, and in addition they also apply a random chance pairing correction. Based on our analysis from §§ 3.3.3 and 4.1, we note Kartaltepe et al. fractions may be systematically smaller, and most plausibly are causing the observed discrepancy at .
We now compare to B09, and remind our reader that they used a 4:1 flux-ratio as their fiducial major companion criterion. We find good agreement with the Bundy et al. estimates at , but find marginal disagreement at . Next, we compare to Man et al. (2012), who analyzed close pairs among galaxies using 4:1 -band flux-ratio criterion at , and found fairly high fractions up to . We find good agreement with their fractions over the full redshift range, however, we acknowledge that a proper comparison with our highest-redshift bin results is not possible owing to their large uncertainty.
Finally, we compare to Bluck et al. (2009); Bluck et al. (2012), who analyzed the incidence of close companions which satisfy a -band flux ratio selection among a GOODS NICMOS survey sample of galaxies at . Bluck et al. reports that the fraction of galaxies hosting a nearby major companion evolves steeply with redshift as (dashed line in Figure 10b), reaching up to () and (), with a total fraction of . While we find consistent agreement at , we note that their fractions are a factor of two higher at . Similarly, we also find that their total fraction, which spans over , is also larger by a factor of two when compared to our total at . Although we qualitatively agree with the strongly increasing redshift evolution of Bluck et al., we note that our trend is shallower with a simple power-law slope of (see Figure 8). We argue that the steeply increasing fraction evolution by Bluck et al. may be a consequence of the increased contamination from minor companions by their flux-ratio selection (see § 4.3). Also, significant field-to-field variance due to their small sample size and the use of a relatively less restrictive line-of-sight contamination correction may be contributing towards the observed (factor of two) disagreement to our fractions.
We now focus our comparisons to studies that employ a kpc selection (see Table 5). We start our comparison with Lin et al. (2008), who studied close pairs among luminosity-limited sample of galaxies at . We find that our fractions are only marginally consistent with their results at and disagree with them at as our fractions are times larger than their values. We note that Lin et al. used a stringent spectroscopic redshift proximity criterion of km s-1, which may be the reason for their smaller fractions and the observed discrepancy. Nevertheless, we notice that Lin et al. fractions start to converge with our estimates at , which may be due to the rising minor-companion contamination by flux-ratio selection leading to larger fractions. We now compare to López-Sanjuan et al. (2011), who study a spectroscopically confirmed sample of close pairs among -band luminosity-limited galaxy sample to quantify pair fractions at two redshifts and . We find that our estimate at is marginally higher than their fraction, but is in good agreement at . Also, we qualitatively agree with their increasing redshift evolutionary trend of the fractions at .
Finally, we compare to Man et al. (2016), who also derived 4:1 -band flux-ratio based companion fractions for galaxies spanning among the 3D-HST and UltraVISTA datasets. We find that our values trace very closely with the Man et al. 3D-HST estimates and are in excellent agreement within the uncertainties. We also find that Man et al. UltraVISTA estimates qualitatively agree with the increasing redshift evolution of our flux-ratio selected . However, we notice that their estimates at are marginally smaller than our extrapolation between and . In summary, we conclude that our -band flux-ratio based are in good agreement with previous empirical studies once we match closely the choices of companion selection criteria.
5.2 Major Merger Rates
As outlined in the Introduction, empirical merger rates provide a fundamentally crucial measure of the importance of major merging in the evolution of massive galaxies. Our new major companion fractions from CANDELSSDSS allow us to place clearly-defined new constraints on the evolution of major merger rates between and . Here, we elect to focus on a straightforward comparison of merger rates derived from our major companion fractions with the largest systematic differences: stellar mass-ratio versus flux-ratio selection. Then we compare our merger rates to several recent empirical studies and cosmologically-motivated predictions that employ similar companion selection criteria as we do.
The major merger rate based on close-companion (pair) statistics is defined as the number of major galaxy-galaxy merger events per unit time per selected galaxy (see Man et al., 2016):
| (9) |
where is the average observability timescale during which a galaxy-galaxy pair satisfies a given selection criterion, and the multiplicative factor attempts to account for the fact that not all such companions will merge within the interval (e.g., Lotz et al., 2011). It is clear that the and factors are crucial assumptions involved in converting observed companion fractions into merger rates. As such, these factors are a major source of systematic uncertainty in merger rate calculations. A few analyses of theoretical simulations have provided fairly broad guidelines for these key assumptions. Hopkins et al. (2010a) find that different merger timescale assumptions can induce up to a factor of 2 uncertainty in the merger rates. Others have attempted to constrain the fraction-to-rate conversion factors and quote limits of to (Kitzbichler & White, 2008; Jiang et al., 2014). Despite the need for improved constraints on these key merger rate factors, attempts to calibrate and in detail with regard to changing companion selection criteria and as a function of fundamental galaxy properties such as redshift and stellar mass, are lacking.
In practice, previous empirical studies have used merger rate factors that span a wide range. For example, some studies have adopted for simplicity (e.g., Man et al., 2016), while others have employed an intermediate value of 0.6 (e.g., B09, Lotz et al., 2011) based on limits from simulations. Similarly, some empirical studies adopt their values based on analytical fitting function provided by Kitzbichler & White (2008), while others adopt values provided by Lotz et al. (2010) that range from 0.3 to 2 Gyr depending on the close-companion selection criteria. For the major merger rate calculations below, we make a simple assumption that these factors are constant over all redshifts and masses we probe. We adopt and Gyr, which is suitable for our fiducial kpc criterion (Lotz et al., 2010). Exploring the detailed impact of these assumptions is beyond the scope of this paper. However, in § 5.3.2, we test two theoretically motivated redshift-dependent timescale prescriptions to re-derive the merger rates and discuss their implications.
In Figure 11, we show the major merger rate evolution during , which we derive from CANDELS+SDSS major companion fractions for stellar mass-ratio (MR) and flux-ratio (FR) selections with matched fiducial projected separation and B09 redshift proximity criteria. Holding aside the factor-of-two systematic uncertainty contribution from to merger rate calculations, we find both the MR and FR-based merger rates evolutionary trends mimic their respective trends discussed in §§ 3.3 and 4.3, which is expected given our simplistic fraction-to-merger-rate conversion factors. We notice that both the MR and FR selections yield consistent major merger rates at , where they increase strongly from () to Gyr-1 (). At , the different selections have divergent merger rates. The MR-based merger rates decline with redshift to , indicating a turnover at . In contrast, the inflated companion fractions owing to contamination by minor companions, the flux-ratio selection yields times larger rates between with an increasing power-law trend .
Next, we compare our empirical MR-based merger rates to previous empirical estimates (Figure 11). For , we compare to Lotz et al. (2011) who compile close-pair fractions from several observational stellar-mass and luminosity-selected studies (magenta line) and found strongly increasing major merger rate evolution with redshift , which qualitatively agrees with both our MR and FR rate evolutions over this redshift range. The Lotz et al. merger rate evolutions have systematically smaller normalization than ours because their compilation includes close-pair-based fractions that may be systematically smaller than our due to the use of different selection criteria. For example Kartaltepe et al. (2007); Lin et al. (2008) use a stringent proximity selections (see § 5.1.2, and Table 5) and Patton & Atfield (2008) uses a stringent major companion selection criterion 999Patton & Atfield (2008) selects major companions using a 2:1 luminosity ratio as opposed to our 4:1 criterion from a luminosity-limited galaxy sample at .. For merger rates at , we compare our fiducial MR-based merger rate to a recent study of close pairs by Man et al. (2016). We find that our individual data points agree well with the Man et al. results (blue) within the measurement uncertainties at these redshifts. Yet, our standalone rising-diminishing merger rate evolution disagrees with the Man et al. flat trend. If we were to extend their rates to , we would disagree with them; however, we note that Man et al. do not attempt to anchor to a low-redshift (for their 3D-HST sample), as such, claim a flat trend with redshift in agreement with Mundy et al. (2017). Recently, Mundy et al. (2017) in conjunction with Duncan et al., in prep find that the Henriques et al. (2015) semi-analytic model mock light-cones accurately reproduce a flat pair-fraction trend that is consistent with the recent findings by Man et al. (2016); Snyder et al. (2017), and the results of this work. Employing an un-evolving close-pair observability timescale assumption, Mundy et al. reports a flat major merger rate evolution. Our fiducial MR-selected merger rates shown in Figure 11 agree with the Mundy et al. result, which is not surprising owing to the assumption of constant observability timescale.
Here, we discuss our comparison to theoretical major merger predictions. Since these are based on stellar-mass ratios, we refrain from comparing them to our FR-based rates. Hopkins et al. (2010a) provides a comprehensive analysis of major galaxy-galaxy merging using CDM motivated simulation and Semi-Analytic Modeling to derive major merger rate predictions, and quantified systematic error contribution from various theoretical model-dependent assumptions. We find that the Hopkins et al. major merger rate evolution of galaxies (; green line in Figure 11), within a factor of two uncertainty, agrees qualitatively and quantitatively with our MR-based rates up to . At , our fiducial MR-selected, diminishing merger rate trend disagrees with the Hopkins et al. predictions. We also compare our merger rates to a recent theoretical prediction by Rodriguez-Gomez et al. (2015a) from the Illustris numerical hydrodynamic simulation (Vogelsberger et al., 2014). We note that their galaxy merger rates (black line in Figure 11) follow an even stronger increasing redshift dependence () than the Hopkins et al. predictions, which also agrees qualitatively with our trend at . However, at , we note that the Rodriguez-Gomez et al. predictions are smaller than our empirical estimates. Similar to the conclusion from the Hopkins et al. comparison, our fiducial MR-based merger rates disagree with predictions from Rodriguez-Gomez et al. at . We present further discussion on the plausible reason for the observed discrepancy of flat vs. rising merger rate evolution in § 5.3.2.
Being the primary driver for galaxy-galaxy merging, halo-halo merger rates serve as a ceiling for both empirical measurements and theoretical galaxy merging predictions, and their qualitative trend is expected to mimic the galaxy merger rates closely. We find that our empirical MR-selected merger rate trend broadly agrees with the analytical merger rates of dark-matter halos (; brown line in Figure 11) predicted by Neistein & Dekel (2008); Fakhouri et al. (2010); Dekel et al. (2013) (also see Maulbetsch et al., 2007) at but starts to deviate significantly at . Since the translation from a halo-halo merger rate to a galaxy-galaxy merger rate depends on the redshift-dependent mapping of galaxies onto their respective dark-matter halos (halo-occupation statistics), the galaxy merger rates are expected to follow a shallower redshift evolution than the ones set by the halo merger rates (for discussion, see Hopkins et al., 2010a). Although different assumptions of halo-occupation models may contribute up to a factor of two uncertainty in the theoretically predicted galaxy merger rates (e.g., Hopkins et al., 2010b), they all hint towards a rising incidence with increasing redshift. As such, a deviation of more than factor of five (e.g., see redshift bin in Figure 11) between the constant timescale-based fiducial MR-selected empirical rates (diminishing) and the analytical halo merger rate evolution (rising; ) is puzzling. Based on this analysis, we conclude that a straight-forward MR-based estimation of major merger rates using a constant fraction-to-merger-rate observability timescale ( Gyr) are in disagreement with the theoretical predictions at . We discuss the implications of these conclusions in § 5.3.
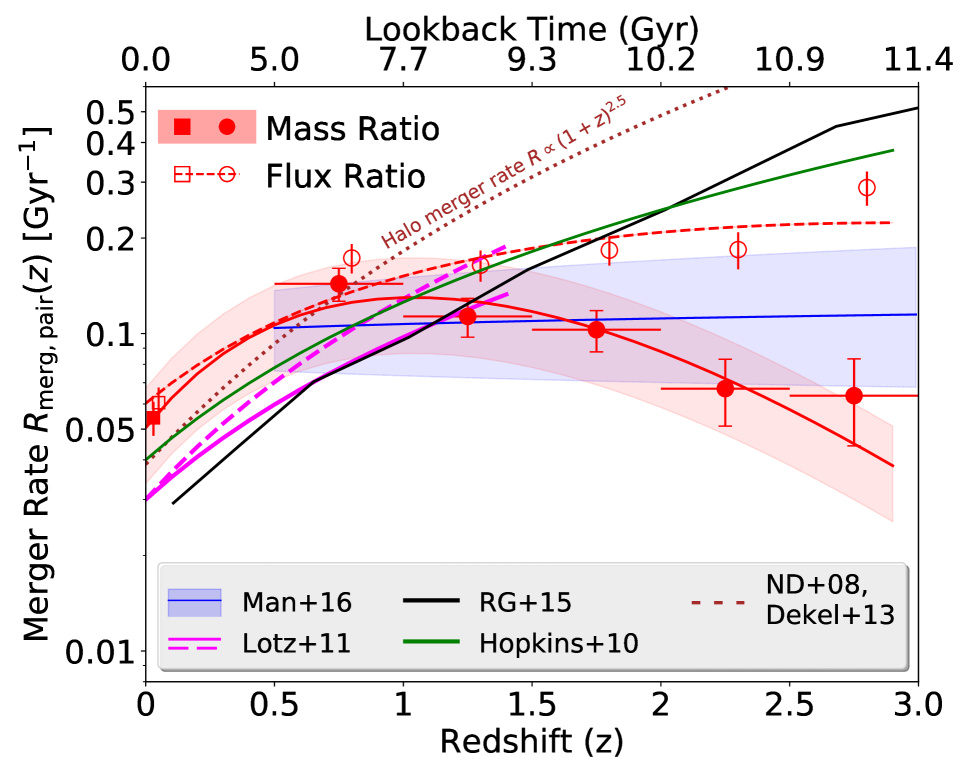
5.3 Implications of the Disagreement between Simplistic Empirical Merger Rates and Model Predictions
So far, we have demonstrated that major merger rates based on a rather straight-forward MR-selection start to disagree with theoretical predictions of major galaxy-galaxy merging at . This indicates there may be one or many redshift-dependent effects plaguing the key variables (, , and ) in Equation 9, causing the observed merger rates to disagree with simulations. Here, we first investigate for plausible systematic under-estimation of values at as a reason for the observed discrepancy by testing if we are missing close companions by not choosing the full PDF when applying the B09 redshift proximity. Then, we discuss another possibility that the simplistic, constant value assumptions of may be incorrect, and test two theoretically-motivated, redshift-dependent prescriptions to re-derive merger rates. We also elaborate on the remnant formation times, which is a key difference between the merger rates measured in theoretical simulations and empirically calculated close-pair-based rates, and comment on how it may be affecting the data-theory comparison.
5.3.1 Are We Missing Companions by Not Accounting for the Full PDFs?
One plausible reason for the data-theory discrepancy may be that the adopted B09 redshift proximity criterion (Eq. 1) is missing plausible physical close-pair systems because we are using only the photometric uncertainties and not the full PDF. To test if this is the case we carry out a simple test, where we start by simplifying Equation 1 as ; therefore, our fiducial criterion equates to . The distribution of values for physical close-pair systems is Gaussian, assuming values are Gaussian. Therefore, using is equivalent to selecting 68% of the full distribution. Ideally, if one assumes the contribution from non-physical pairs (hereafter called as the background) per bin is negligible, as much as of the close pairs (thereby companions) can be missed when using . For this exercise, we allow for a non-zero background to properly estimate the missing pairs at five redshift bins between .
We begin with the cumulative distribution function (CDF) of for all the close-pair systems selected using our fiducial projected separation criterion. To avoid errors from small number statistics, we do not limit close-pair systems with a stellar-mass-ratio selection. However, we require that both the host and companion galaxies to be brighter than mag to exclude large values from affecting the statistics. We now model CDF with a Gaussian integral function in conjunction with a constant background contribution, following the fitting formula: . Here, is the number of close-pair systems that satisfy a cutoff significance () as , and the variables and are the contributions from plausible physical close pairs and the background, respectively. For demonstrative purposes, we present the fits to the CDF and their best-fit parameter values of and in Figure 13 for two redshift bins between . At each redshift bin, we define the ratio as the multiplicative correction factor to our fiducial that corrects for the missing close-pair systems due to Method I. When the background is negligible (), the correction factor is . However, if is significant, then the correction factor may become less than unity. In Figure 14, we plot the corrected alongside the fiducial fractions. We note that fractional change in the major companion fraction after applying the correction factor is less than 5% at . However, at we find the relative contribution from the background starts to dominate the Gaussian contribution and therefore causes the fiducial to decrease by more than 10%. Despite these changes, we note that the overall corrected values do not significantly deviate from the fiducial values. Therefore, we conclude that we are not missing close pairs (thereby companions), by using photometric-redshift errors for our fiducial redshift proximity criteria.
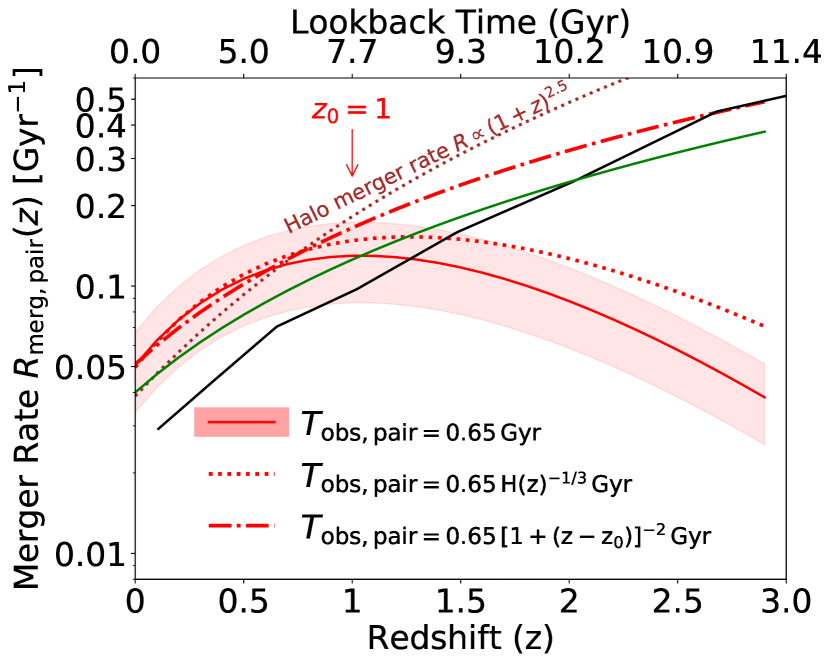
5.3.2 Evolving Observability Timescale and Remnant Formation Times
It is evident by now that the close-pair observability timescale () is a key parameter that dictates the measurement of merger rates. Yet, a wide range of values can be found in the literature (see § 5.2), often assumed to be constant over a wide range of redshifts. Therefore, with the growing evidence (Man et al., 2016; Mundy et al., 2017) for flat or possibly diminishing close-pair-based fractions at , it is expected that a constant timescale assumption-based merger rates to disagree with the continually rising merger-rate trends from the theoretical predictions. A possible implication of this disagreement is that the timescale may be evolving with redshift, such that an ongoing merger can be observed as a close pair for a shorter period at earlier cosmic times. This may not be surprising as simulation-based merging-timescale calibrations (e.g., Kitzbichler & White, 2008; Jiang et al., 2014), motivated by dynamical friction time for a satellite DM-halo to merge with the parent, are complex functions that depend on key merger properties such as the mass ratio, galaxy mass, , and (; is the present-day Hubble constant; is the evolution of as a function of redshift). Moreover, the dynamical timescale based on simple cosmological arguments is also redshift dependent, and can be approximated as (see Snyder et al., 2017). However, as per the discussion in Snyder et al. (2017), any processes that can act faster than the dynamical timescale and may impact the variables of close companion selection criteria, which in turn can change the . In this context, the galaxies are undergoing a rapid transformation concerning their stellar-mass assembly, owing to rapid ongoing star-formation (Madau & Dickinson, 2014) at . Snyder et al. found that this rapid mass assembly can shorten the close-pair observability timescale towards earlier redshifts, which evolves as at . Moreover, they measured the close-pair fractions within the Illustris simulation (Vogelsberger et al., 2014) and inferred that the timescale should evolve as to match the intrinsic merger rates trend from Rodriguez-Gomez et al. (2015b).
In Figure 12, we re-compute the merger rates for the fiducial mass-ratio based companion fractions by adopting the two evolving timescale assumptions and from Jiang et al. (2014); Snyder et al. (2017), respectively. Since Snyder et al. asserts that the close-pair observability is mainly dynamical time dominated at , which results in an un-evolving timescale value, we choose to evolve the only at when re-computing the merger rates. We find that the major merger rates based on Jiang et al. evolving timescale still does not sufficiently agree with the theoretical predictions. On the other hand, when we use simulation-tuned Snyder et al. prescription of , we find that the merger rates agree closely to model predictions of Hopkins et al. (2010a); Rodriguez-Gomez et al. (2015b), and closely mimic the Neistein & Dekel (2008); Dekel et al. (2013) halo-halo merger rates. The fact that our evolving timescale based empirical merger rates agree with the theoretical predictions from Rodriguez-Gomez et al. implies a very good agreement between our and Snyder et al. fractions. Additionally, we argue that the disagreement between Henriques et al. (2015); Mundy et al. (2017) flat merger rate evolution and the Hopkins et al. (2010a); Rodriguez-Gomez et al. (2015b) theoretical predictions (see § 5.2) may be due to the un-evolving close-pair observability timescale assumption. These results imply that an evolving timescale assumption may be more appropriate when measuring merger rates at , and it may be necessary to explain the discrepancy between a constant timescale based rates and theoretical model predictions.
Additionally, we also stress the difference in the measured quantities between the simulations and empirical close-pair-based studies. In theoretical simulations, a merger is counted towards the intrinsic merger rate when the merging process is concluded, i.e., when the remnant of the progenitor galaxies is formed, and therefore it is an instantaneous measure. On the other hand, the close-pair method probes future merging systems, within some time-frame after observing them. Snyder et al. found that the remnant formation time also evolves as , which is defined as the time prior to the formation of the remnant, when the merger is observed as a close pair. We follow Section 4.1 in Snyder et al. and compute instantaneous remnant formation rates at , which is conceptually similar to the instantaneous merger rates quoted by the simulations. We find that remnant formation rate follows an increasing redshift trend, which is in qualitative agreement with finding by Snyder et al. (2017). We acknowledge that a comprehensive analysis of the empirical and theoretical measurement methods is necessary to make quantitative data-theory comparisons confidently. However, it is beyond the scope of the current study to fully address them. We reserve further discussions on this analysis to an accompanying paper (Paper#2 in the series; Mantha et al., in prep).
5.4 Future Work
So far, we have discussed plausible evolutionary observability timescale prescriptions that may be necessary when deriving merger rates at . While this may be true, is another key parameter in Equation 9 which may also depend on the companion selection criteria. In fact, recent studies (e.g., Lin et al., 2010; de Ravel et al., 2011) find that varies as a function of , redshift, and local over-density (often represented by ). Although, a redshift-dependent timescale prescription sufficiently brings empirical and theoretical merger rates to agreement, it is possible that may be a simultaneous function of several key close-pair variables. As such, these conversion factors may be better represented as , , where and are the evolving prescriptions of and , respectively. To fully quantify the interplay among the companion selection criteria and the fraction-to-merger-rate conversions, it is important to derive detailed calibrations for and using large-scale cosmological simulations. We will discuss this in a follow-up Paper#2 (Mantha et al., in prep).
Furthermore, it has been speculated that stellar-mass ratio may be a poor representer of ongoing “significant” mergers, owing to the dominant cold-gas contribution to the total baryonic mass (gasstellar mass) of the galaxy at (Lotz et al., 2011; Man et al., 2016). If this is true, a galaxy merger with may in fact be significant if the total baryonic (stellar+cold gas) mass ratio of the galaxies is considered (i.e., ). This may cause for many of the mergers that can be significant contributors to several aspects of galaxy evolution to be missed because of the selection bias. Empirical confirmation of this speculated selection bias deserves a dedicated analysis of its own, and we will discuss this in an accompanying paper (#3 of this series).
Semi-Analytic Models (SAMs) are showing a great promise as the testing grounds for many galaxy evolution related questions (e.g., Brennan et al., 2015; Pandya et al., 2016). Three studies, (Somerville et al., 2008; Lu et al., 2014; Croton et al., 2016, Somerville et al., in prep) have independently developed SAMs based on Bolshoi-Plank N-body simulation (Klypin et al., 2016) and produced mock datasets that mimic observational data in the five CANDELS fields. Additionally, multiple realizations of each CANDELS mock field are also made available. We will take advantage of the intrinsic merger history information and apply close pair analysis on these mock datasets to derive the necessary calibrations. With the help of multiple realizations per field, we will be able to quantify the impact of sample variance towards close-pair statistics and merger rates. Also, by introducing realistic, CANDELS-like random and systematic errors onto simulated and quantities, we will carry out a comprehensive investigation of their impact on the measured merger rate evolution. These calibrations and analyses will help fill the gaps in our understanding of the merger rate measurements and will provide most up-to-date major merger rate constraints with future state-of-the-art telescopes.
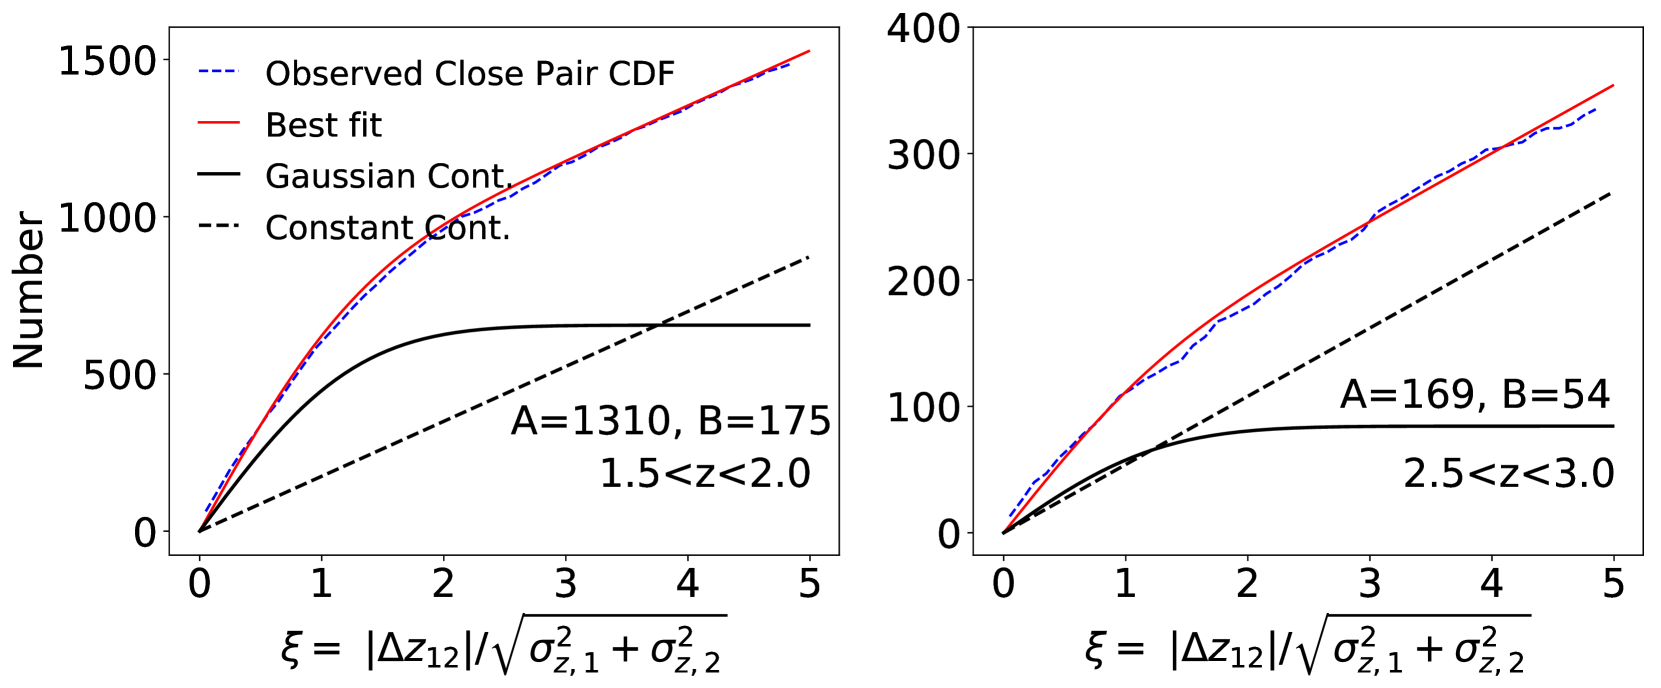
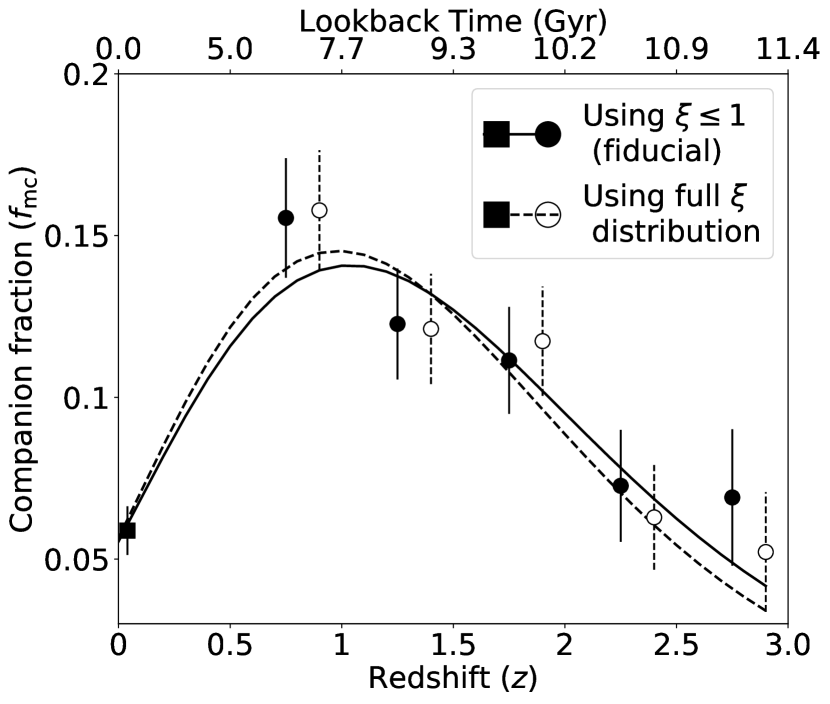
6 Conclusions
In this paper we analyze a large sample of nearly 9800 massive () galaxies spanning using the five Hubble Space Telescope CANDELS fields (totaling ) and volume-matched region of the SDSS surveys to quantify the redshift evolution of major companion fraction . We adopt a fiducial selection criteria of projected separation ( kpc), redshift proximity (CANDELS) and km s-1 (SDSS), and stellar mass-ratio major companion selection criterion (MR).
Our key result is the MR-based major companion fraction increases from 6% () to () and decreases to (), indicating a turnover at with power-law exponential (Equation 7) best-fit values , , and . We perform comprehensive tests demonstrating that these evolutionary trends are robust to changes in companion selection criteria except for -band flux ratio (FR) selection, where FR-based agree with MR-based fractions up to , but disagree at as they increase steadily with redshift as up to , confirming previous speculations (Bundy et al., 2004, 2009). This disagreement is due to increasing contamination of FR selection by minor companions (MR) from 40% at to over three-quarters at , confirming the result by Man et al. (2016) that significantly different mass-to-light ratio properties of the companion galaxies at may be the main cause for the contamination by minor companions.
We compute major merger rates for MR and FR-based fractions by using a constant fraction-to-merger-rate conversion and a non-evolving close-pair observability timescale Gyr (Lotz et al., 2010). We find that the MR-based rates follow an increasing trend with redshift up to , after which they decline up to . On the other hand, the FR-based rates follow a rising trend with redshift over our full redshift range . We also re-compute the MR-based rates using two additional theoretically-motivated, redshift dependent timescales: (Jiang et al., 2014) and (Snyder et al., 2017).
If recent cosmologically-motivated merger simulations are representative of nature, our results indicate the strong need for improved understanding of how MR and FR estimates trace the galaxy mass (gas+stars) and halo mass ratios of merging systems as a function of redshift. This analysis underscores the strong need for detailed calibrations of these complex, presumably evolving prescriptions of and to constrain the empirical major merger rates confidently. In addition, and may be evolving not only as a function of redshift, but also stellar-mass, companion selection criteria (, ), and environment (local over-density), which we plan to pursue through a comprehensive analysis of close-pair statistics using mock datasets from the Semi-Analytic Models in Paper#2.
Finally, we recompute for different companion selections and we find good agreement with previous empirical estimates when we match their companion selection criteria. This confirms the report by Lotz et al. (2011) that part of the reason for the observed study-to-study differences is due to close-pair selection mismatch. Additionally, our comprehensive analysis of the impact of different selection criteria and statistical corrections on measurements yields the following results:
-
•
The redshift evolution of major companion fractions is qualitatively robust to changes in projected separation criterion, with smaller resulting in lower fractions as expected. However, the kpc selection ( the area of kpc selection) yields similar results to kpc criterion owing to the increased probability of physical companions at smaller projected separations.
-
•
Moreover, the redshift evolution of major companion fractions is qualitatively robust to changes in redshift proximity criterion. While the modified Man et al. (§ 4.2) proximity-based fractions are systematically higher than the fiducial values, the hybrid B09-based proximity (§ 4.2) yields smaller major companion fractions at and nearly identical values at when compared to fiducial B09 (Equation 1) based fractions, owing to the sparsity of spectroscopic-redshift coverage in CANDELS at these redshifts.
-
•
We recompute the SDSS evolutionary anchor using the modified Man et al. and B09 redshift proximity criteria applied to simulated errors similar to those for CANDELS galaxies. We find the recomputed companion fractions are statistically equivalent () to the fiducial values, which demonstrates a high probability of small velocity separations ( km s-1) for companions in kpc projected pairs in the SDSS.
-
•
When major companion fractions are corrected for random chance pairing, we find negligible corrections () for SDSS owing to our stringent km s-1 proximity selection, and approximately equal corrections of at for CANDELS. Importantly, our key results regarding the evolutionary trends of major companion fractions are qualitatively the same with or without this statistical correction.
-
•
We also demonstrate that the B09 redshift proximity method does not exclude close-pair systems owing to our use of a simple 68% confidence limit to represent the full PDF.
-
•
Finally, we demonstrate that MR-selected merger rates using un-evolving prescriptions of and agree with the theoretical predictions at but strongly disagree at . If we re-compute our MR-based rates using an evolving, dynamical-time motivate timescale by Jiang et al., we find the merger rates are still lower than and disagree with the theoretical merger rate predictions at . However, if we use a redshift-dependent timescale motivated by Snyder et al. (2017), our MR-based rates agree with the theory at redshifts .
Acknowledgements
This work is dedicated in memory of K. N. V. S. Kishore Babu, a dear friend who inspired KBM to pursue Astrophysics. We are grateful to Peter Behroozi, Mark Brodwin, Philip Hopkins, Kartheik Iyer, Allison Kirkpatrick, Viraj Pandya, Vicente Rodriguez-Gomez, Brett Salmon, Raymond Simons for helpful comments and discussions during different manifestations of this work. Special thanks to Daniel Shanaberger for carefully reading the manuscript, thanks to Gillen Brown, Cody Ciaschi, Bandon Decker, Benjamin Floyd, Ripon Saha, and Madalyn Weston for their valuable inputs during the UMKC Galaxy Evolution Group (GEG) discussions. DHM and KBM acknowledge support from the Missouri Consortium of NASA’s National Space Grant College and Fellowship Program, and funding from the University of Missouri Research Board. RSS acknowledges support from the Downsbrough family, and from the Simons Foundation. SL acknowledges support from the National Research Foundation of Korea (NRF) grant, No. 2017R1A3A3001362, funded by the Korea government (MSIP). This work is based on observations taken by the CANDELS Multi-Cycle Treasury Program with the NASA/ESA HST, which is operated by the Association of Universities for Research in Astronomy, Inc., under NASA contract NAS5-26555. Support for Program number HST-GO-12060 was provided by NASA through a grant from the Space Telescope Science Institute, which is operated by the Association of Universities for Research in Astronomy, Incorporated, under NASA contract NAS5-26555. This publication makes use of the Sloan Digital Sky Survey (SDSS). Funding for the creation and distribution of the SDSS Archive has been provided by the Alfred P. Sloan Foundation, the Participating Institutions, the National Science Foundation, the US Department of Energy, the National Aeronautics and Space Administration, the Japanese Monbukagakusho, the Max Planck Society and the Higher Education Funding Council for England. This publication also made use of NASA’s Astrophysics Data System Bibliographic Services, TOPCAT (Tools for OPerations on Catalogues And Tables, Taylor, 2005), the core python package for the astronomy community (Astropy 1.2.1; Astropy Collaboration et al., 2013).
Appendix A Checking Consistency of CANDELS team Redshifts to Single Participant Estimates
In § 2.3.2, we have discussed adopting the values based on single participant as the photometric-redshift errors of to be able to apply the redshift proximity criterion successfully. To choose an appropriate participant for this analysis, we test the consistency of redshift estimates from six participants to the CANDELS team values for the sample of galaxies. We find the redshifts based on S. Wuyts s agree best with the CANDELS team and available values, where the median (of the CANDELS five fields) outlier fraction101010It is defined as the fraction of galaxies that are outliers. We consider a galaxy to be an outlier if of 1.5 and 3, respectively. This agreement is key to our analysis, and thus we choose the S. Wuyts values centered on their redshifts to estimate the for the CANDELS team values. For simplicity, in Figure 15, we only show the S. Wuyts redshift estimates vs. team .
AFFILIATIONS
1Department of Physics and Astronomy, University of Missouri-Kansas City, Kansas City, MO 64110, USA
2Department of Physics and Astronomy, Rutgers, The State University of New Jersey, NJ 08854-8019, USA
3Space Telescope Science Institute, 3700 San Martin Drive, Baltimore, MD 21218.
4Department of Physics and Astronomy and PITT PACC, University of Pittsburgh, Pittsburgh, PA 15260, USA
5University of Nottingham, School of Physics & Astronomy, Nottingham, NG7 2RD UK
6University of California, Santa Cruz, USA
7Oxford Astrophysics, Denys Wilkinson Building, Oxford OX1 3RH, UK
8Astrophysics Science Division, Goddard Space Flight Center, MD 20771, USA
9Department of Physics, University of Bath, Bath, UK
10The University of Michigan, 300E West Hall, Ann Arbor, MI 48109-1107
11Racah Institute of Physics, The Hebrew University, Jerusalem 91904 Israel
12School of Physics and Astronomy, Rochester Institute of Technology, Rochester, NY 14623, US
13Department of Physics and Astronomy, Colby College, Waterville, ME 04961, USA
14Center for the Exploration of the Origin of the Universe, Seoul National University, Seoul, Korea
15Goddard Space Flight Center, Code 665, Greenbelt, MD 20771, USA
16Department of Physics and Astronomy, The Johns Hopkins University, Baltimore, MD 21218, USA
17University of California, Berkeley
18Department of Astronomy, The University of Texas at Austin, Austin, TX 78712, USA
19INAF-Osservatorio Astronomico di Roma, Roma, Italy
20Max Planck Institute fur Extraterrestriche Physik, 85741 Garching bei Munchen, DE
21Department of Physics & Astronomy, University of California, Irvine, CA 92697, USA
22Departamento de Astrofísica, Facultad de CC. Físicas, Universidad Complutense de Madrid, Madrid, Spain
23Aix Marseille Université, CNRS, LAM (Laboratoire d’Astrophysique de Marseille) UMR 7326, 13388, Marseille, France
24Scientific Support Office, ESA/ESTEC, Noordwijk, The Netherlands
25Leiden Observatory, Leiden University, Leiden, Netherlands
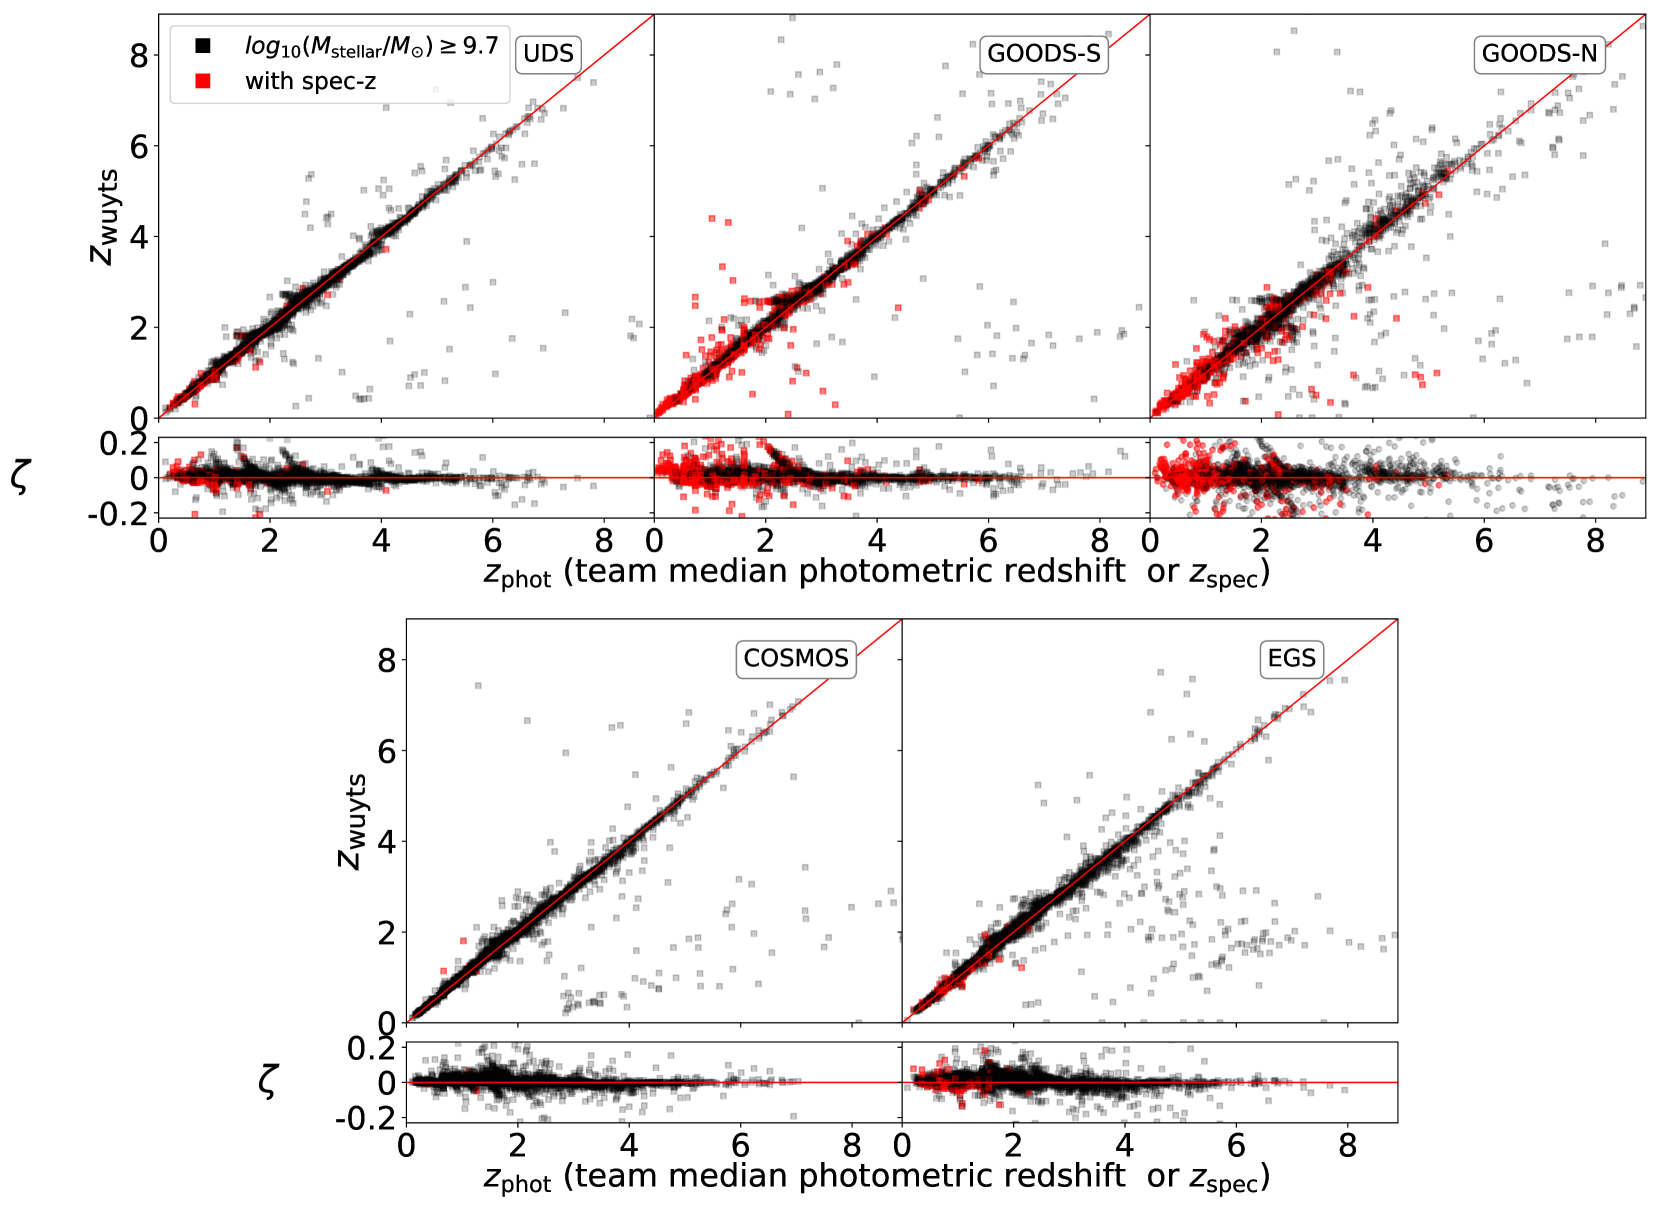
References
- Abazajian et al. (2009) Abazajian K. N., et al., 2009, ApJS, 182, 543
- Adelman-McCarthy et al. (2006) Adelman-McCarthy J. K., et al., 2006, ApJS, 162, 38
- Ashby et al. (2015) Ashby M. L. N., et al., 2015, ApJS, 218, 33
- Astropy Collaboration et al. (2013) Astropy Collaboration et al., 2013, A&A, 558, A33
- Barnes & Hernquist (1996) Barnes J. E., Hernquist L., 1996, ApJ, 471, 115
- Bell et al. (2003) Bell E. F., McIntosh D. H., Katz N., Weinberg M. D., 2003, ApJ Supplement Series, 149, 289
- Bell et al. (2006a) Bell E. F., et al., 2006a, ApJ, 640, 241
- Bell et al. (2006b) Bell E. F., Phleps S., Somerville R. S., Wolf C., Borch A., Meisenheimer K., 2006b, ApJ, 652, 270
- Blanton et al. (2003) Blanton M. R., Lin H., Lupton R. H., Maley F. M., Young N., Zehavi I., Loveday J., 2003, AJ, 125, 2276
- Blanton et al. (2005) Blanton M. R., et al., 2005, The Astronomical Journal, 129, 2562
- Bluck et al. (2009) Bluck A. F. L., Conselice C. J., Bouwens R. J., Daddi E., Dickinson M., Papovich C., Yan H., 2009, Monthly Notices of the Royal Astronomical Society: Letters, 394, L51
- Bluck et al. (2012) Bluck A. F. L., Conselice C. J., Buitrago F., Grützbauch R., Hoyos C., Mortlock A., Bauer A. E., 2012, ApJ, 747, 34
- Bournaud & Duc (2006) Bournaud F., Duc P.-A., 2006, A&A, 456, 481
- Bournaud et al. (2011) Bournaud F., Dekel A., Teyssier R., Cacciato M., Daddi E., Juneau S., Shankar F., 2011, ApJ, 741, L33
- Bower et al. (2006) Bower R. G., Benson A. J., Malbon R., Helly J. C., Frenk C. S., Baugh C. M., Cole S., Lacey C. G., 2006, MNRAS, 370, 645
- Brammer et al. (2008) Brammer G. B., van Dokkum P. G., Coppi P., 2008, ApJ, 686, 1503
- Brennan et al. (2015) Brennan R., et al., 2015, MNRAS, 451, 2933
- Bridge et al. (2007) Bridge C. R., et al., 2007, ApJ, 659, 931
- Bruzual & Charlot (2003) Bruzual G., Charlot S., 2003, MNRAS, 344, 1000
- Bundy et al. (2004) Bundy K., Fukugita M., Ellis R. S., Kodama T., Conselice C. J., 2004, ApJ, 601, L123
- Bundy et al. (2009) Bundy K., Fukugita M., Ellis R. S., Targett T. A., Belli S., Kodama T., 2009, ApJ, 697, 1369
- Cacciato et al. (2012) Cacciato M., Dekel A., Genel S., 2012, MNRAS, 421, 818
- Carlberg (1990) Carlberg R. G., 1990, ApJ, 359, L1
- Cassata et al. (2005) Cassata P., et al., 2005, MNRAS, 357, 903
- Cebrián & Trujillo (2014) Cebrián M., Trujillo I., 2014, MNRAS, 444, 682
- Ceverino et al. (2015) Ceverino D., Dekel A., Tweed D., Primack J., 2015, MNRAS, 447, 3291
- Chabrier (2003) Chabrier G., 2003, PASP, 115, 763
- Conselice (2003) Conselice C. J., 2003, ApJS, 147, 1
- Conselice (2006) Conselice C. J., 2006, ApJ, 638, 686
- Conselice et al. (2003) Conselice C. J., Bershady M. A., Dickinson M., Papovich C., 2003, AJ, 126, 1183
- Conselice et al. (2008a) Conselice C. J., Rajgor S., Myers R., 2008a, MNRAS, 386, 909
- Conselice et al. (2008b) Conselice C. J., Rajgor S., Myers R., 2008b, Monthly Notices of the Royal Astronomical Society, 386, 909
- Conselice et al. (2009) Conselice C. J., Yang C., Bluck A. F. L., 2009, Monthly Notices of the Royal Astronomical Society, 394, 1956
- Cox et al. (2008) Cox T. J., Jonsson P., Somerville R. S., Primack J. R., Dekel A., 2008, MNRAS, 384, 386
- Croton et al. (2016) Croton D. J., et al., 2016, ApJS, 222, 22
- Dahlen et al. (2013) Dahlen T., et al., 2013, ApJ, 775, 93
- Darg et al. (2010) Darg D. W., et al., 2010, MNRAS, 401, 1043
- De Propris et al. (2007) De Propris R., Conselice C. J., Driver S. P., Liske J., Patton D., Graham A., Allen P., 2007, ApJ, 666, 212
- Dekel & Burkert (2014) Dekel A., Burkert A., 2014, MNRAS, 438, 1870
- Dekel et al. (2009) Dekel A., Sari R., Ceverino D., 2009, ApJ, 703, 785
- Dekel et al. (2013) Dekel A., Zolotov A., Tweed D., Cacciato M., Ceverino D., Primack J. R., 2013, MNRAS, 435, 999
- Di Matteo et al. (2005) Di Matteo T., Springel V., Hernquist L., 2005, Nature, 433, 604
- Di Matteo et al. (2007) Di Matteo P., Combes F., Melchior A.-L., Semelin B., 2007, A&A, 468, 61
- Di Matteo et al. (2008) Di Matteo P., Bournaud F., Martig M., Combes F., Melchior A.-L., Semelin B., 2008, A&A, 492, 31
- Domingue et al. (2009) Domingue D. L., Xu C. K., Jarrett T. H., Cheng Y., 2009, ApJ, 695, 1559
- Fakhouri & Ma (2008) Fakhouri O., Ma C.-P., 2008, MNRAS, 386, 577
- Fakhouri et al. (2010) Fakhouri O., Ma C.-P., Boylan-Kolchin M., 2010, MNRAS, 406, 2267
- Fioc & Rocca-Volmerange (1997) Fioc M., Rocca-Volmerange B., 1997, A&A, 326, 950
- Galametz et al. (2013) Galametz A., et al., 2013, ApJ Supplement Series, 206, 10
- Genel et al. (2009) Genel S., Genzel R., Bouché N., Naab T., Sternberg A., 2009, ApJ, 701, 2002
- Gottlöber et al. (2001) Gottlöber S., Klypin A., Kravtsov A. V., 2001, ApJ, 546, 223
- Grogin et al. (2005) Grogin N. A., et al., 2005, ApJ, 627, L97
- Grogin et al. (2011) Grogin N. A., et al., 2011, ApJ Supplement Series, 197, 35
- Guo et al. (2013) Guo Y., et al., 2013, ApJ Supplement Series, 207, 24
- Henriques et al. (2015) Henriques B. M. B., White S. D. M., Thomas P. A., Angulo R., Guo Q., Lemson G., Springel V., Overzier R., 2015, MNRAS, 451, 2663
- Hewlett et al. (2017) Hewlett T., Villforth C., Wild V., Mendez-Abreu J., Pawlik M., Rowlands K., 2017, MNRAS, 470, 755
- Hopkins et al. (2006) Hopkins P. F., Somerville R. S., Hernquist L., Cox T. J., Robertson B., Li Y., 2006, ApJ, 652, 864
- Hopkins et al. (2008) Hopkins P. F., Cox T. J., Kereš D., Hernquist L., 2008, ApJS, 175, 390
- Hopkins et al. (2010a) Hopkins P. F., et al., 2010a, ApJ, 715, 202
- Hopkins et al. (2010b) Hopkins P. F., et al., 2010b, ApJ, 724, 915
- Jiang et al. (2014) Jiang C. Y., Jing Y. P., Han J., 2014, ApJ, 790, 7
- Jogee et al. (2009) Jogee S., et al., 2009, ApJ, 697, 1971
- Kartaltepe et al. (2007) Kartaltepe J. S., et al., 2007, ApJ Supplement Series, 172, 320
- Kartaltepe et al. (2015) Kartaltepe J. S., et al., 2015, ApJS, 221, 11
- Khochfar & Burkert (2003) Khochfar S., Burkert A., 2003, ApJ, 597, L117
- Khochfar & Burkert (2005) Khochfar S., Burkert A., 2005, MNRAS, 359, 1379
- Kitzbichler & White (2008) Kitzbichler M. G., White S. D. M., 2008, MNRAS, 391, 1489
- Klypin et al. (2016) Klypin A., Yepes G., Gottlöber S., Prada F., Heß S., 2016, MNRAS, 457, 4340
- Kocevski et al. (2012) Kocevski D. D., et al., 2012, ApJ, 744, 148
- Koekemoer et al. (2011) Koekemoer A. M., et al., 2011, ApJS, 197, 36
- Laidler et al. (2007) Laidler V. G., et al., 2007, PASP, 119, 1325
- Lin et al. (2004) Lin L., et al., 2004, ApJ, 617, L9
- Lin et al. (2008) Lin L., et al., 2008, ApJ, 681, 232
- Lin et al. (2010) Lin L., et al., 2010, ApJ, 718, 1158
- Lofthouse et al. (2017) Lofthouse E. K., Kaviraj S., Conselice C. J., Mortlock A., Hartley W., 2017, MNRAS, 465, 2895
- López-Sanjuan et al. (2009) López-Sanjuan C., Balcells M., Pérez-González P. G., Barro G., García-Dabó C. E., Gallego J., Zamorano J., 2009, Astronomy and Astrophysics, 501, 505
- López-Sanjuan et al. (2011) López-Sanjuan C., et al., 2011, A&A, 530, A20
- Lotz et al. (2004) Lotz J. M., Primack J., Madau P., 2004, AJ, 128, 163
- Lotz et al. (2008) Lotz J. M., et al., 2008, ApJ, 672, 177
- Lotz et al. (2010) Lotz J. M., Jonsson P., Cox T. J., Primack J. R., 2010, Monthly Notices of the Royal Astronomical Society, 404, 575
- Lotz et al. (2011) Lotz J. M., Jonsson P., Cox T. J., Croton D., Primack J. R., Somerville R. S., Stewart K., 2011, ApJ, 742, 103
- Lu et al. (2014) Lu Y., et al., 2014, ApJ, 795, 123
- Madau & Dickinson (2014) Madau P., Dickinson M., 2014, ARA&A, 52, 415
- Man et al. (2011) Man A. W. S., Zirm A., Toft S., 2011, arXiv:1112.3764 [astro-ph]
- Man et al. (2012) Man A. W. S., Toft S., Zirm A. W., Wuyts S., van der Wel A., 2012, ApJ, 744, 85
- Man et al. (2016) Man A. W. S., Zirm A. W., Toft S., 2016, ApJ, 830, 89
- Martig & Bournaud (2008) Martig M., Bournaud F., 2008, MNRAS, 385, L38
- Maulbetsch et al. (2007) Maulbetsch C., Avila-Reese V., Colín P., Gottlöber S., Khalatyan A., Steinmetz M., 2007, ApJ, 654, 53
- McIntosh et al. (2008) McIntosh D. H., Guo Y., Hertzberg J., Katz N., Mo H. J., van den Bosch F. C., Yang X., 2008, MNRAS, 388, 1537
- Mobasher et al. (2015) Mobasher B., et al., 2015, ApJ, 808, 101
- Moster et al. (2011) Moster B. P., Somerville R. S., Newman J. A., Rix H.-W., 2011, ApJ, 731, 113
- Moustakas et al. (2013) Moustakas J., et al., 2013, ApJ, 767, 50
- Mundy et al. (2017) Mundy C. J., Conselice C. J., Duncan K. J., Almaini O., Häußler B., Hartley W. G., 2017, preprint, (arXiv:1705.07986)
- Naab et al. (2006) Naab T., Khochfar S., Burkert A., 2006, ApJ, 636, L81
- Narayanan et al. (2010) Narayanan D., et al., 2010, MNRAS, 407, 1701
- Nayyeri et al. (2017) Nayyeri H., et al., 2017, ApJS, 228, 7
- Neistein & Dekel (2008) Neistein E., Dekel A., 2008, MNRAS, 388, 1792
- Newman et al. (2012) Newman A. B., Ellis R. S., Bundy K., Treu T., 2012, ApJ, 746, 162
- Oke & Gunn (1983) Oke J. B., Gunn J. E., 1983, ApJ, 266, 713
- Pandya et al. (2016) Pandya V., et al., 2016, preprint, (arXiv:1611.03869)
- Patton & Atfield (2008) Patton D. R., Atfield J. E., 2008, ApJ, 685, 235
- Patton et al. (1997) Patton D. R., Pritchet C. J., Yee H. K. C., Ellingson E., Carlberg R. G., 1997, ApJ, 475, 29
- Patton et al. (2000) Patton D. R., Carlberg R. G., Marzke R. O., Pritchet C. J., da Costa L. N., Pellegrini P. S., 2000, ApJ, 536, 153
- Patton et al. (2011) Patton D. R., Ellison S. L., Simard L., McConnachie A. W., Mendel J. T., 2011, MNRAS, 412, 591
- Peirani et al. (2010) Peirani S., Crockett R. M., Geen S., Khochfar S., Kaviraj S., Silk J., 2010, MNRAS, 405, 2327
- Pozzetti et al. (2010) Pozzetti L., et al., 2010, A&A, 523, A13
- Robaina et al. (2009) Robaina A. R., et al., 2009, ApJ, 704, 324
- Robaina et al. (2010) Robaina A. R., Bell E. F., van der Wel A., Somerville R. S., Skelton R. E., McIntosh D. H., Meisenheimer K., Wolf C., 2010, ApJ, 719, 844
- Rodriguez-Gomez et al. (2015a) Rodriguez-Gomez V., et al., 2015a, MNRAS, 449, 49
- Rodriguez-Gomez et al. (2015b) Rodriguez-Gomez V., et al., 2015b, Monthly Notices of the Royal Astronomical Society, 449, 49
- Ryan et al. (2008) Ryan Jr. R. E., Cohen S. H., Windhorst R. A., Silk J., 2008, ApJ, 678, 751
- Sanders et al. (1988) Sanders D. B., Soifer B. T., Elias J. H., Madore B. F., Matthews K., Neugebauer G., Scoville N. Z., 1988, ApJ, 325, 74
- Santini et al. (2015) Santini P., et al., 2015, ApJ, 801, 97
- Snyder et al. (2017) Snyder G. F., Lotz J. M., Rodriguez-Gomez V., Guimarães R. d. S., Torrey P., Hernquist L., 2017, MNRAS, 468, 207
- Somerville et al. (2008) Somerville R. S., Hopkins P. F., Cox T. J., Robertson B. E., Hernquist L., 2008, MNRAS, 391, 481
- Springel (2000) Springel V., 2000, MNRAS, 312, 859
- Stefanon et al. (2017) Stefanon M., et al., 2017, ApJS, 229, 32
- Strauss et al. (2002) Strauss M. A., et al., 2002, AJ, 124, 1810
- Swinbank et al. (2010) Swinbank A. M., et al., 2010, MNRAS, 405, 234
- Tal et al. (2009) Tal T., van Dokkum P. G., Nelan J., Bezanson R., 2009, AJ, 138, 1417
- Targett et al. (2011) Targett T. A., Dunlop J. S., McLure R. J., Best P. N., Cirasuolo M., Almaini O., 2011, MNRAS, 412, 295
- Taylor (2005) Taylor M. B., 2005, in Shopbell P., Britton M., Ebert R., eds, Astronomical Society of the Pacific Conference Series Vol. 347, Astronomical Data Analysis Software and Systems XIV. p. 29
- Treister et al. (2012) Treister E., Schawinski K., Urry C. M., Simmons B. D., 2012, ApJ, 758, L39
- Villforth et al. (2014) Villforth C., et al., 2014, MNRAS, 439, 3342
- Villforth et al. (2017) Villforth C., et al., 2017, MNRAS, 466, 812
- Vogelsberger et al. (2014) Vogelsberger M., et al., 2014, MNRAS, 444, 1518
- Wen & Zheng (2016) Wen Z. Z., Zheng X. Z., 2016, ApJ, 832, 90
- Weston et al. (2017) Weston M. E., McIntosh D. H., Brodwin M., Mann J., Cooper A., McConnell A., Nielsen J. L., 2017, MNRAS, 464, 3882
- Williams et al. (2011) Williams R. J., Quadri R. F., Franx M., 2011, ApJ, 738, L25
- Yang et al. (2007) Yang X., Mo H. J., van den Bosch F. C., Pasquali A., Li C., Barden M., 2007, ApJ, 671, 153
- York et al. (2000) York D. G., et al., 2000, AJ, 120, 1579
- Younger et al. (2009) Younger J. D., Hayward C. C., Narayanan D., Cox T. J., Hernquist L., Jonsson P., 2009, MNRAS, 396, L66
- de Jong & Bell (2007) de Jong R. S., Bell E. F., 2007, Astrophysics and Space Science Proceedings, 3, 107
- de Ravel et al. (2009) de Ravel L., et al., 2009, A&A, 498, 379
- de Ravel et al. (2011) de Ravel L., et al., 2011, arXiv:1104.5470 [astro-ph]
- van der Wel et al. (2009) van der Wel A., Rix H.-W., Holden B. P., Bell E. F., Robaina A. R., 2009, ApJ, 706, L120