A non-thermal pulsed X-ray emission of AR Scorpii
Abstract
We report the analysis result of UV/X-ray emission from AR Scorpii, which is an intermediate polar (IP) composed of a magnetic white dwarf and a M-type star, with the XMM-Newton data. The X-ray/UV emission clearly shows a large variation over the orbit, and their intensity maximum (or minimum) is located at the superior conjunction (or inferior conjunction) of the M-type star orbit. The hardness ratio of the X-ray emission shows a small variation over the orbital phase, and shows no indication of the absorption by an accretion column. These properties are naturally explained by the emission from the M-type star surface rather than from the accretion column on the WD’s star similar to the usual IPs. Beside, the observed X-ray emission also modulates with WD’s spin with a pulse fraction of . The peak position is aligned in the optical/UV/X-ray band. This supports the hypothesis that the electrons in AR Scorpii are accelerated to a relativistic speed, and emit non-thermal photons via the synchrotron radiation. In the X-ray bands, the evidence of the power-law spectrum is found in the pulsed component, although the observed emission is dominated by the optically thin thermal plasma emissions with several different temperatures. It is considered that the magnetic dissipation/reconnection process on the M-type star surface heats up the plasma to a temperature of several keV, and also accelerates the electrons to the relativistic speed. The relativistic electrons are trapped in the WD’s closed magnetic field lines by the magnetic mirror effect. In this model, the observed pulsed component is explained by the emissions from the first magnetic mirror point.
1. Introduction
AR Scorpii (hereafter ARSco) is a white dwarf binary system categorized as the intermediate polar (hereafter IP), and it is a compact binary system with a binary separation of cm. The distance to the source is pc (Marsh et al. 2016; Buckley et al. 2017). This binary system consists of a magnetic white dwarf, for which the surface magnetic field is G, and a M-type main sequence star (hereafter M-type star) with a radius of and a mass of . The spin period of the white dwarf is s, and the orbital period of the system is hrs. In terms of the radio/optical/UV emission properties, AR Sco is distinguished from other IPs, and is similar to those of neutron star (NS) pulsar. The radio/optical/UV emission modulates due to the spin of the WD, and the light curve shows the double peak structure. The phase separation between two peaks is in the optical/UV bands, and the pulse fraction exceeds 95% at the UV bands (Marsh et al., 2016). The optical emission is observed with a strong linear polarization and a polarization degree varying over the spin phase. The double peak structure of the pulse profile and the morphology of the linear polarization (Buckley et al., 2017) in the optical bands are resemble to those of the Crab pulsar, which is an isolate young NS pulsar with electromagnetic wave from radio to high energy TeV bands (e.g. Kuiper et al. 2001; Kanbach et al. 2005; Takata et al. 2007). Moreover, the optical emission from AR Sco also modulates on the orbital period (3.56hrs), which indicates the heating of the day-side of the M-type star by the magnetic field/radiation of the WD (Marsh et al. 2016; Katz 2017). This feature is also similar to that of the millisecond pulsar/low mass star binary systems (e.g. Fruchter et al. 1988; Kong et al. 2012). With the unique properties of the emission, AR Sco may be the first WD binary system that continuously shows a non-thermal radiation from relativistic electrons.
AR Sco’s broadband electromagnetic spectrum from radio to UV bands is characterized by a synchrotron radiation from relativistic electrons, indicating acceleration process in the binary system. As pointed out by Geng et al. (2016), on the other hand, the number of particles that emits the observed pulsed optical emission of AR Sco is significantly larger than the number that can be supplied by the WD itself. Geng et al. (2016) thus suggest that an electron/positron beam from the WD’s polar cap sweeps the stellar wind from the M-type star, and a bow shock propagating into stellar wind accelerates the electrons in the wind. Takata et al. (2018) consider the relativistic electrons that are trapped at the closed magnetic field lines of the WD by the magnetic mirror effect, and suggest that the pulse emission is originated by the emission from the first magnetic mirror point. Both models predict the non-thermal X-ray emission from this system. However, Marsh et al. (2016) report no significance detection of the pulse emission in the X-ray bands, and determine the upper limit of the pulse fraction at %. Therefore, the origin of the X-ray emission from this system has not been undetermined. In this paper, we report the analysis of results from the UV/X-ray data taken by the XMM-Newton.
2. Data analysis
579264.09615 & 57641.54629 8.4611 8.5390 0.07792
We analyze the archive XMM-Newton data taken at 2016 September 19 (Obs. ID: 0783940101, PI: Steeghs). This new observation was performed with a total exposures of 39ks. The observation was operated under the fast mode for the OM camera, the small window mode for the MOS1/2 CCDs (time resolution 0.3s), and the large window mode for the PN camera (time resolution 47.7ms). Event lists from the data are produced in the standard way using the most updated instrumental calibration, , and tasks of the XMM-Newton Science Analysis Software (XMMSAS, version 16.0.0). A point source is significantly detected () by the XMMSAS task at the position of AR Sco. To perform the spectral and timing analyses, we extract the EPIC data from a circle region with a radius of centered at source position (J2000). The arrival times of all the selected events of the OM/EPIC data are barycentric-corrected with the aforementioned position and the latest DE405 Earth ephemeris.
2.1. Timing analysis
2.1.1 Orbital modulation
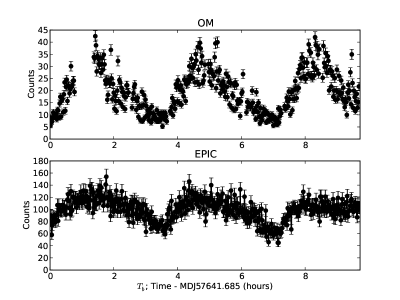
Marsh et al. (2016) argue that the un-pulsed optical/UV emission shows the maximum (or minimum) brightness at the superior conjunction (or inferior conjunction) of the M-type star orbit, and the emission is originated from the day-side of the M-type star. The new XMM-Newton observation covers more than two orbits of AR Sco, and the X-ray emission significantly modulates over the orbital phase (Figure 1). We can see in the figure that the X-ray modulation after subtracting the background remains a large DC level, and it synchronizes with the UV orbital modulation.
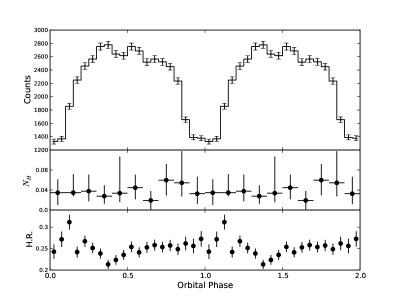
We fold the EPIC data in the orbital frequency mHz (Table 1) with the reference time (MJD)=579264.09615, where the M-type star is in the inferior conjunction; that is, the M-type star is located between the WD and Earth. The property of the X-ray orbital modulation of AR Sco is distinguished from those of other IPs. AE Aquarii is the IP system whose orbital period (hours) and spin period (s) are similar to those of AR Sco (Choi et al. 2017; Itoh et al. 2006; Terada et al. 2008), but its X-ray emission does not show significant orbital modulation. The observed X-ray flux from some IPs shows a sharp drop to zero due to an eclipse of the emission region, which indicates that the X-ray emission region is confined close to the WD’s surface (Cropper et al., 2002). Some IPs exhibit an orbital modulation due to an absorption by an accretion stream, for which the and hardness ratio in X-ray bands rapidly vary with the change of the observed flux (Evans et al. 2004; Pekön & Balman 2011; Rea et al. 2017). For AR Sco, however, a large DC component of the observed light curve suggests that the size of the X-ray emission region is comparable to the size of the binary system. Moreover, the small variation of the hardness of the X-ray emission over the orbit (Figure 2) indicates that the absorption by the accretion matter is not the origin of the observed orbital modulation. Instead, the large variation of the orbital modulation with a DC component and synchronizing with the UV modulation is naturally explained if the emission is originated from the day-side of the M-type star, on which the plasma is heated by the magnetic field/radiation of the WD.
In Figure 1, we find that OM orbital light curve shows a faster rise and a slower decay, and the orbit maximum is prior to the superior conjunction of the companion orbit. This orbital waveform is consistent with the previous results (Marsh et al. 2016; Littlefield et al. 2017). This orbital shift is interpreted as a consequence of either (1) the major magnetic dissipation at the leading surface of the M-type star or (2) the precession of the rotation axis of the WD owing to a misalignment to the orbital axis (Katz, 2017). Littlefield et al. (2017) reveals that the orbital waveform and maxim gradually shift with time.
2.1.2 Energy dependent pulse profile
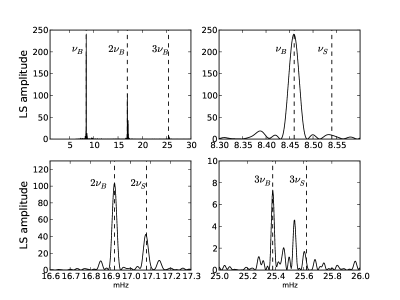
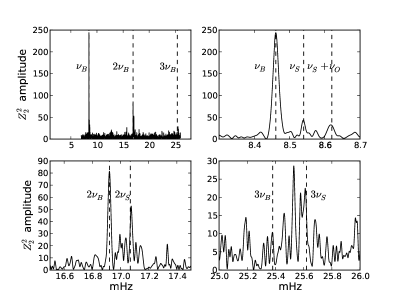
In Marsh et al. (2016), the timing analysis shows that the optical/UV emission from AR Sco is modulating with the beat frequency of the WD’s spin frequency and the orbital frequency. The pulse profile folded in the beat frequency shows a double peak structure with a phase-separation of . Moreover, the peaks in the optical and UV bands are in phase, and the radiation power of the pulse emission in the optical/UV bands is comparable to or more than the DC emission from the M-type star surface and WD surface. The broadband spectrum from the radio to optical bands is described by a non-thermal spectrum. These optical/UV properties suggest that the AR Sco continuously generates relativistic electrons. To confirm this hypothesis, the detection of the pulse emission in a higher energy band and the correlation of the pulse peaks in different energy bands are important. We therefore search the beat frequency (mHz) reported by Marsh et al. (2016) in the OM/EPIC data, and we find a significant peak at the beat frequency in the Lomb-Scarge periodogram (Lomb, 1976) in OM data (Figure 3), and in the periodogram (Buccheri et al., 1983) in all EPIC data (Figure 4). For the EPIC data, the beat frequency [mHz, where the error is determined by the equation (6a) in Leahy (1987)] is detected with or of the H-test (de Jager & Büsching, 2010), which corresponds to random probability of , suggesting the X-ray pulsation is significantly detected. In addition to the fundamental beat frequency, a peak in periodogram can be found at the spin frequency [mHz], and their harmonics. Table 1 summarizes the ephemeris used to make a folded light curve in this paper.
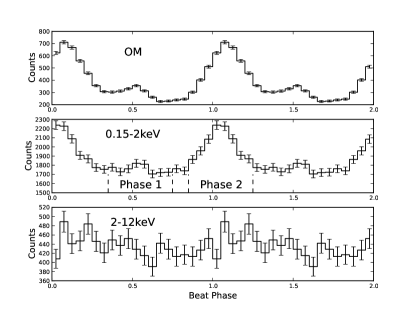
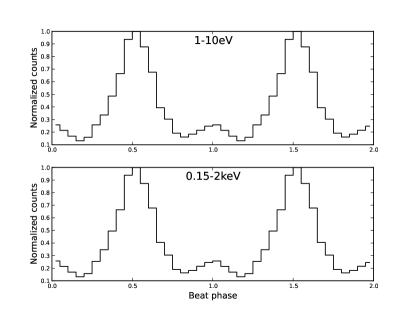
To investigate property of the pulse profile, we fold the OM/EPIC data into the beat phase, and obtain the orbitally phase averaged pulse profiles in the UV bands, 0.15-2.0keV bands, and 2-12keV bands (Figure 5). In the UV bands, the pulse profile is composed of the prominent first peak and a small second peak, and the phase-separation between the peaks is in the beat phase, which is consistent with the previous result of the optical/UV pulse profiles (Marsh et al., 2016). We can see in Figure 5, the pulse profile in 0.15-2keV bands is similar to that of UV bands, although the second peak is less significance (). This similarity in the pulse profile shows that the pulse emission in the UV/soft X-ray bands is produced by the same population of the particles.
The narrow phase width of the main peak and the double peak pulse profile of AR Sco are also distinguished from the pulse profiles of canonical IPs, in which the X-ray spin modulation is observed as a broad single pulse (e.g. Pekön & Balman 2011). This observational fact also supports the hypothesis that the X-ray emission of AR Sco is not explained by the emission from the accretion column/heated WD’s surface. Our result shows that the pulse emission from AR Sco extends from radio to soft X-ray bands, and the pulse profile is aligned from the optical/UV to X-ray energy bands (three to four order of magnitude in the energy). This is a strong indication that the electrons are accelerated to relativistic energies in AR Sco system, and the pulse emission is produced by the synchrotron radiation process. In 2-12keV energy band, the detection of the pulsation is not significant with for the probability of a flat distribution.
Another interesting feature is the energy dependent pulse fraction. The pulse fraction, which is defined by the equation , is measured as % in the UV bands, while it is in 0.15-2keV energy bands, which is consistent with the upper limit of in Marsh et al. (2016). The small pulse fraction shows that the DC level is the main component in the X-ray emission. Moreover, the large orbital variation synchronizing with the UV emission shows that DC component is originated from the heated-side of the M-type star, and there is a keV plasma around the M-type star surface. The energy conversion from the magnetic energy to the particle energy due to the magnetic reconnection/dissipation on the M-type star is a possible scenario to heat up/accelerate the plasma.
2.1.3 Pulse profile; orbital evolution
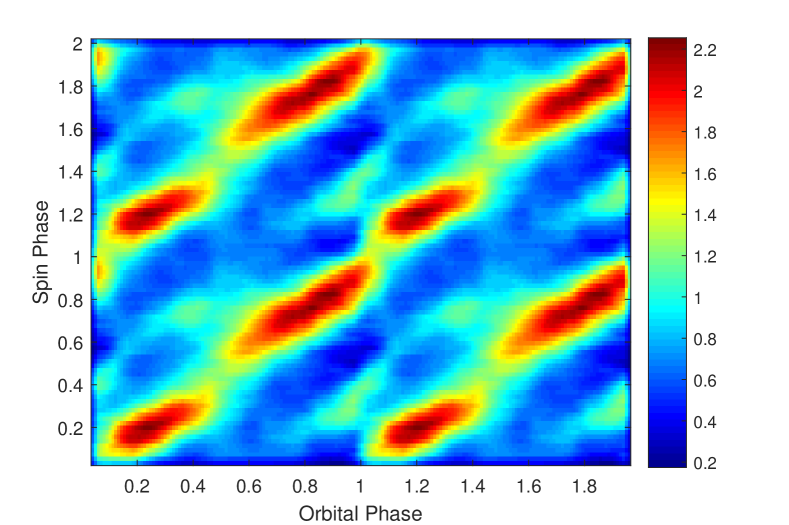
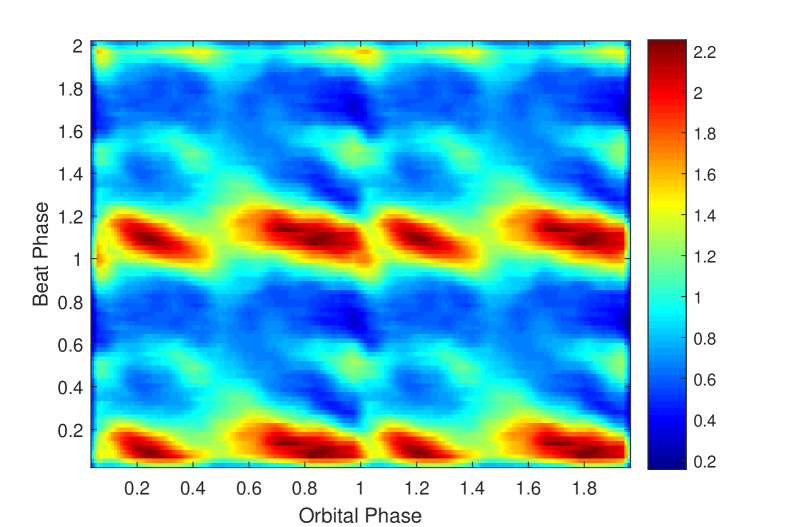
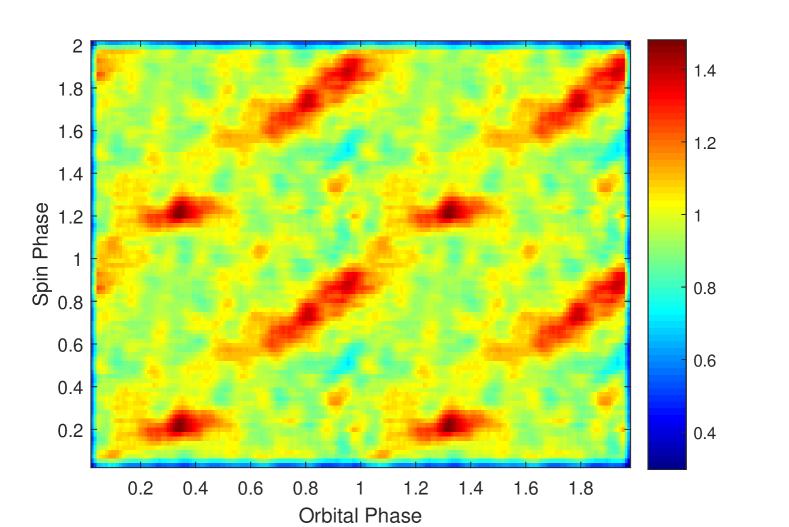
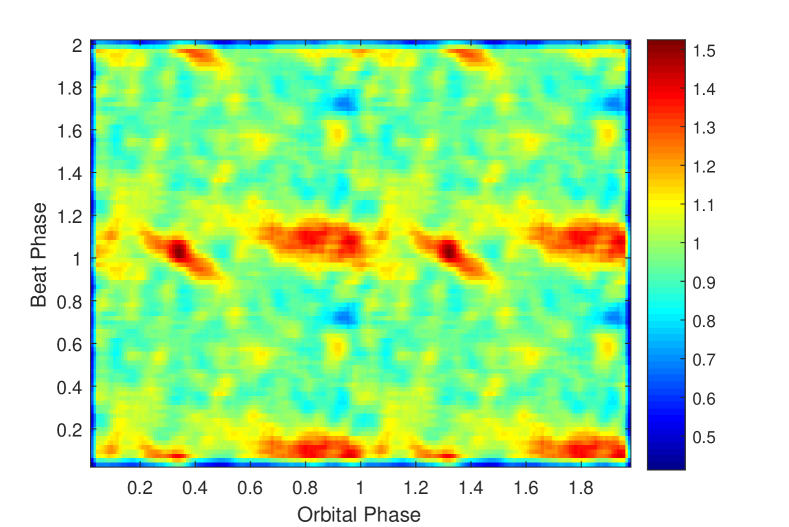
The pulse emission from AR Sco is observed with the beat frequency . This indicates that the position of the pulse peak in the spin phase has a linear shift in the orbital phase. To confirm this, we make a dynamic pulse profile folded in the spin phase over the orbital phase (upper panel in Figure 6). In Figure 6, we can clearly see the shift of the position of the pulse peak in the spin phase for both OM (right panel) and EPIC (left panel) data. However, an interesting feature can be seen in the dynamic pulse profile of the EPIC data; in the right upper panel, the phase shift of the pulse peak at orbital phase is slower than that in orbital phase, and results in a discontinuity of the peak position at the superior conjunction () and inferior conjunction () of the orbit of the M-type star. This interesting feature can also be seen in the dynamic pulse profiles folded in the beat phase (lower panel in Figure 6); in this case, the X-ray pulse peak (right pane) shifts at the orbital phase, while the peak position does not show a shift during the orbital phase.
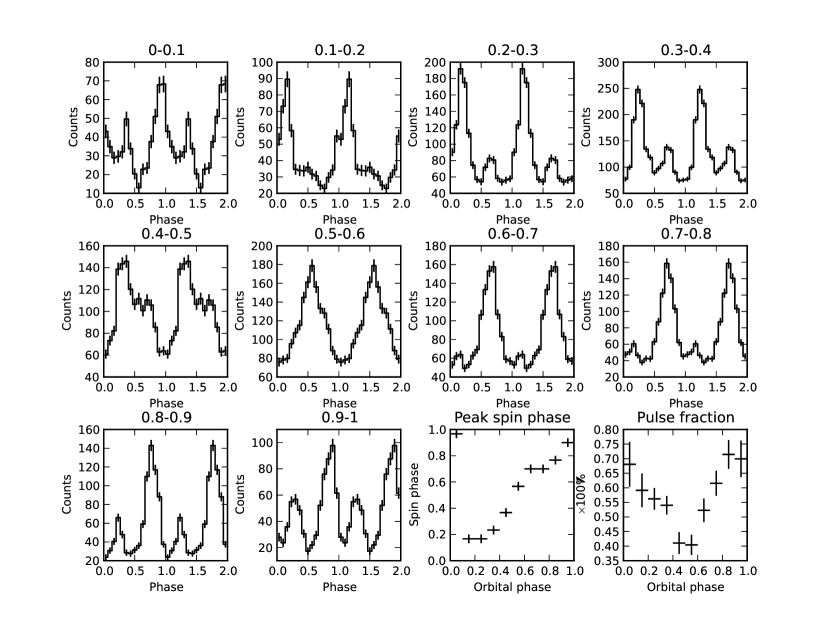
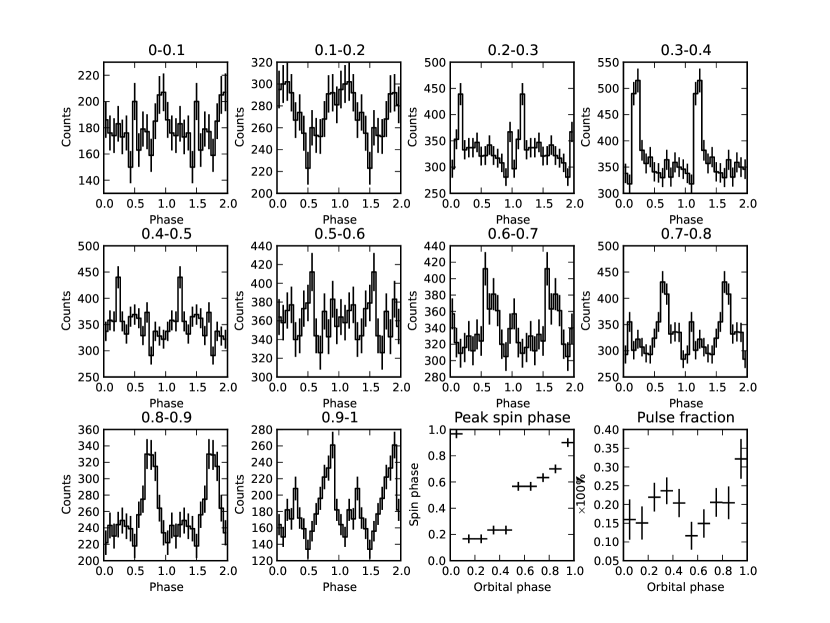
To investigate an evolution of the pulse profile over the orbit, we create orbitally resolved pulse profiles, folded in spin phase, of the OM data and the EPIC data (Figure 7). In Figure 7, we can see that the pulse shapes in both UV and X-ray bands evolve over the orbital phase. On the other hand, we can also see that the pulse shape and peak position in the UV/X-ray bands are similar each other in most of the orbital phase. This observational result also supports the hypothesis that the pulse emissions in the UV and X-ray bands are originated from the same population of the particles.
In the UV bands, the double peak structure can be clearly seen at most part of the orbital phase. Around orbital phase (superior conjunction), however, the pulse profile is described by a broad single peak, and the pulse shape drastically changes during orbital phase, where the shift of the main peak position in the spin phase is faster than other orbital phase. In the X-ray bands, we also confirm such a rapid change in the behavior of the pulse profile around the superior conjunction. In Figure 7, a large change in the pulse profile can be also seen around the inferior conjunction ().
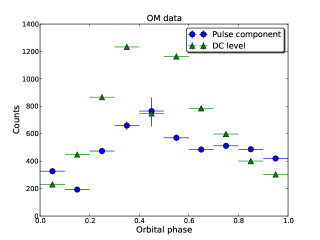
An interesting feature is the large variation of the pulse fraction over the orbital phase. For the UV bands, the pulse fraction is maximum at the inferior conjunction (%) and minimum at the superior conjunction (%). The X-ray emission also shows a similar trend, although the uncertainty is large. For the OM data, we fit the pulse profile with two Gaussian components, and determine the DC level for each orbital phase. In Figure 8, we can see that the DC component varies by a factor of 6 over the orbital motion, while the pulsed component changes by a factor of . For the pulsed component, moreover, the count is almost constant during orbital phase. The difference in the evolution of the photon count over the orbital phase suggests that the emission region of the pulsed component and DC level is different. Since the DC level emission is likely came from the entire surface of the day-side of the M-type star, the pulsed component is produced in part of the M-type star’s surface or at the WD’s magnetosphere.
2.2. Spectral analysis
| 2VMEKAL | 3VMEKAL | |
|---|---|---|
| () | ||
| (keV) | ||
| (keV) | ||
| (keV) | - | |
| aaReference time for the orbital phase. Adopted from Marsh et al. (2016) | ||
| aaNormalization of the VMEKAL component in units of , where (cm) is the distancde to the source. | ||
| aaNormalization of the VMEKAL component in units of , where (cm) is the distancde to the source. | - | |
| bbReference time for the spin phase. | ||
| ccBeat frequency in Figure 4. () | ||
| (dof) | 459 (407) | 416 (404 ) |
2.2.1 Phase averaged spectrum
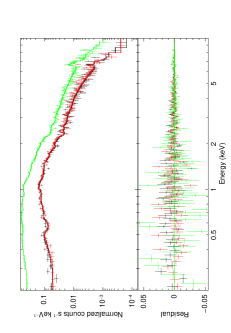
In order to further investigate the X-ray emission from AR Sco, we carry out a spectral analysis with the EPIC camera. We generate the spectra from photons in the 0.15-12keV energy bands within a radius of 20” circle centered at the source. The background spectrum is generated from a source free region. The response files are generated by the XMMSAS tasks and . We group the channels so as to archive the signal-to-noise ratio S/N 3 in each energy bin with of SAS, and use Xspec (version 12.9.1) to fit the data.
The obtained spectra (Figure 9) clearly show a keV emission line from He-like . To fit the EPIC data, therefore, we adopt an optically thin thermal plasma emission (VMEKAL in Xspec), which is a common spectral model for the IPs. During the fitting, we find that the current EPIC data can constrain only the abundance of , and therefore we fix other elements at the solar abundance. First, we fit the data with a single temperature model, and find that the model cannot provide an acceptable fit ( for 410 dof). Adding a power-law component or a disk component ( in Xspec) does not improve the results of the fitting. Then we fit the data with two different temperature components, and find that a two component model with keV and keV can provide an acceptable fit (Table 1). In order to determine the number of VMEKAL components with different temperatures, we fit the data with three temperature and four temperature component models. An improvement of the fitting is found by adding the third component with a statistic value of 14.1, which means that the probability of this improvement being caused by chance is . Less significant improvement is found for a fourth component with a -value of 1.8 or a change probability of 0.15. The best-fit two and three temperature VMEKAL models are shown in Table 1. We do not find significant evidence of a non-thermal component in the phase-averaged spectrum. Since the X-ray flux modulates over the orbit (Figure 1), we evenly divide an one orbit into four parts to investigate the evolution of the spectrum over the orbital phase. We do not find any significant change in the orbitally phase-resolved spectra.
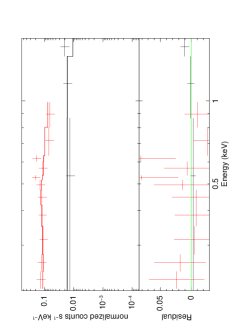
2.2.2 Spectrum of the pulsed component
It has been considered that the emission from radio to UV bands is produced by the synchrotron radiation of the relativistic electrons (Marsh et al., 2016). As described in section 2.1, the pulse UV/X-ray emission is originated from the same population of the plasma. To examine the contribution of the non-thermal component in the X-ray bands, we first perform a phase-resolved spectral analysis, and we compare the spectra at ’Phase1’ and at ’Phase 2’ in Figure 5. We find that the phase-resolved spectra for Phase 1/Phase 2 are well described by an optically thin thermal plasma emission model, and we do not find significant difference in the fitting parameters of the two phases within error. This would be because the pulse fraction is % and therefore the phase-resolved spectrum is also dominated by the un-pulsed component.
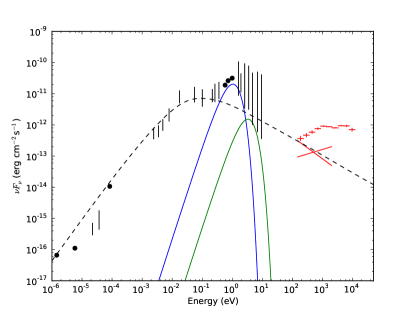
We then generate the spectrum of the pulsed component by subtracting the spectrum of ’Phase 1’ from that of ’Phase 2’. We remove the MOS1 data because of a small amount of the photon counts. During the fitting, we fix the hydrogen column density at from the phase-averaged spectrum. As a result, the power-law model can describe the data reasonably well ( for 12 dof). It yields a soft emission with a photon index and an unabsorbed flux of in 0.15-2keV energy bands. An optical thin plasma emission model (1 MEKAL model) also results in a comparable goodness of the fit. In this model, however, the fitting cannot constrain the parameters of the model, that is, the error range is larger than the central value. Figure 10 shows the broad-band SED spectrum of AR Sco.
3. Discussion
With pc, the X-ray luminosity is of the order of , similar to of AE Aquarii (Kitaguchi et al., 2014), but it is two to three orders of magnitude lower than that of typical IPs. One interesting feature of AR Sco is the weak absorption of the soft X-rays, which corresponds to , lower than observed in many IPs (Yuasa et al., 2010). With the distance pc of AR Sco, the column density will be mainly contributed by the interstellar absorption. This also supports the hypothesis that most of the X-ray emission of AR Sco is not produced as a result of the mass accretion on the WD surface, as we have discussed in section 2.1.
Most of the X-ray emission of the AR Sco is produced by the thermal plasma heated up to several keV. Since there is no evidence of the accretion column for AR Sco, an alternative plausible process is a magnetically interaction between the WD and M-type star, such that a magnetic dissipation process eventually heats up/accelerates the plasma on the M-star surface. When the WD’s magnetic field lines sweep across the surface of the M-type star, the magnetic interaction on the M-type star produces an azimuthal component of WD’s magnetic field, and the pitch will increase at before the magnetic field becomes unstable against the dissipation process. We estimate the rate of the energy dissipation as (Lai 2012; Buckley et al. 2017)
| (1) | |||||
where is the WD’s magnetic dipole moment, is the skin depth (Buckley et al., 2017), and is the spin angular frequency. Since the thermal component of the X-ray emission is observed with a luminosity of , a small fraction of the dissipation energy is converted into keV plasma. Most of the dissipation energy would be used to accelerate the electrons, and be radiated away by the synchrotron radiation that has a peak at the IR/optical bands in the spectral energy distribution and a synchrotron luminosity of .
An evidence of the non-thermal emission can be found in the pulsed component, although the possibility of the emission from the thermal plasma cannot be ruled out. However the alignment of the pulse peaks in the optical/UV/X-ray energy bands (three to four order of magnitude in the energy) strongly supports the synchrotron emission process of the non-thermal relativistic electrons. The double peak structure in optica/UV bands of AR Sco is similar to the Crab pulsar (isolated young neutron star), for which the electrons/positrons are accelerated by the electric field parallel to the magnetic field line, where the charge density deviates from the Goldreich-Julian charge density. As pointed out by Geng et al. (2016), however, the number of the particles that emit the observed pulse optical emissions of AR Sco is significantly larger than the number that can be supplied by the WD itself. This suggests that the synchrotron emitting electrons are supplied from the M-type star surface, and the acceleration process is different from that of NS pulsars.
Magnetic reconnection on the M-type star is a possible process to produce the relativistic electrons. The strength of the magnetic field of the WD at the surface of the M-type star is of the order of
| (2) |
where is the magnetic moment of the WD. In the observed SED (Figure 10), the spectral peak appears at eV. If the observed pulse emission is originated from the M-type star surface, the synchrotron radiation implies the typical Lorentz factor of . With the Lorentz factor , on the other hand, the time scale of the synchrotron loss around the M-type star is . Since the cooling time scale is longer than the crossing time scale of s, the accelerated electrons on the M-type star surface can migrate into the inner magnetosphere of the WD along the magnetic field of the WD before losing their energy.
Takata et al. (2018) discuss that the observed pulse emission is produced by the relativistic electrons trapped by the closed magnetic field lines of the WD. The accelerated electrons from the M-type star will move toward the WD’s surface with the condition that , and increase the perpendicular momentum under the first adiabatic invariance. The electron is rebounded by the magnetic mirror effect and returns to outer magnetosphere. The synchrotron emission from the first magnetic mirror point after leaving the M-type star surface dominates the emission from the subsequent mirror points, and are observed as the pulse emission (Figure 11). In this scenario, the pulse emission can be produced from the inclined rotator, for which the dipole magnetic axis and the spin axis are not aligned; in Takata et al. (2018), the spin axis of WD is assumed to be perpendicular to the orbital plane. The electrons trapped into different magnetic field lines have different travel time from the M-type star surface to the first magnetic mirror point. Due to the difference in the travel times, the electrons injected at the different time may arrive the first magnetic mirror point simultaneously. This enhances the observed flux and this effect becomes important for the electrons that are injected around when the magnetic axis is laid within the plane made by the spin axis and the direction of the M-type star. Since the position of this plane relative to the direction of the Earth shifts over the orbital phase, the pulse peak also shifts in the spin phase, and results in the formation of the beat frequency in the timing analysis.
In summary, we have reported that the X-ray emission from AR Sco is modulating with the orbital phase and with the beat phase. The X-ray orbital modulation with a week absorption and synchronizing with the UV emission suggests that the most of the emission is originated from the M-type star surface, rather than the WD’s surface similar to other IPs. We found that the pulse shape of the X-ray emission is similar to that in the optical/UV bands, and the peak position is aligned in the optical/UV/X-ray bands. This is strong evidence that the pulse emission is the non-thermal, and it is produced by the synchrotron radiation process of the relativistic electrons. In the X-ray data, the evidence of the non-thermal emission can be seen in the spectrum of the pulsed component. Our results support that AR Sco is the new class of the WD binary system that continuously produces the non-thermal radiation from the relativistic electrons.
JT is supported by the National Science Foundation of China (NSFC) under 11573010, U1631103 and 11661161010. PHT is supported by NSFC through grants 11633007 and 11661161010. CYH is supported by the National Re search Foundation of Korea through grants 2014R1A1A2058590 and 2016R1A5A1013277. AKHK is supported by the Ministry of Science and Technology of Taiwan through grants 105-2112-M-007-033-MY2, 105-2119-M-007-028-MY3, and 106-2918-I-007-005. KSC are supported by GRF grant under 17302315.
References
- Buccheri et al. (1983) Buccheri, R., Bennett, K., Bignami, G. F., Bloemen, J. B. G. M., Boriakoff, V., 1983, A&A, 128, 245-251
- Buckley et al. (2017) Buckley, D. A. H., Meintjes, P. J., Potter, S. B., Marsh, T. R., Gänsicke, B. T., 2017, Nature Astronomy, 1, 0029
- Choi et al. (2017) Choi, C.-S., Dotani, T., Agrawal, P. C., 1999, ApJ, 525, 399
- Cropper et al. (2002) Cropper, M., Ramsay, G., Hellier, C., Mukai, K., Mauche, C., Pandel, D., 2002, in Philosophical Transactions of the Royal Society of London Series A, 360, 1951
- de Jager & Büsching (2010) de Jager, O. C. and Büsching, I., 2010, A&A, 517, L9
- Evans et al. (2004) Evans, P. A. and Hellier, C. and Ramsay, G. and Cropper, M., 2004, ApJ, 349, 715-721
- Fruchter et al. (1988) Fruchter, A. S., Gunn, J. E., Lauer, T. R., Dressler, A., 1988, Nature, 334, 686-689
- Geng et al. (2016) Geng, J.-J. and Zhang, B. and Huang, Y.-F., 2016, ApJ, 831, L10
- Itoh et al. (2006) Itoh, K. and Okada, S. and Ishida, M. and Kunieda, H., 2006, ApJ, 636, 397-494
- Katz (2017) Katz, J. I., 2017, ApJ, 835, 150
- Kanbach et al. (2005) Kanbach, G. and Słowikowska, A. and Kellner, S. and Steinle, H., 2005, in AIP Conf. Proc. 801, Astrophysical Sources of High Energy Particles and Radiation, ed. T. Bulik, B. Rudak, & G. Madejski (Melville, NY: AIP), 306
- Kitaguchi et al. (2014) Kitaguchi, T., An, H., Beloborodov, A. M., Gotthelf, E. V., Hayashi, T. et al., 2014, ApJ, 782, 3
- Kong et al. (2012) Kong, A. K. H., Huang, R. H. H., Cheng, K. S., Takata, J., Yatsu, Y., 2012, ApJ, 747, L3
- Kuiper et al. (2001) Kuiper, L., Hermsen, W., Cusumano, G., Diehl, R., Schönfelder, V. et al., 2001, A&A, 278, 918-935
- Lai (2012) Lai, D., 2012, ApJ, 757, L3
- Littlefield et al. (2017) Littlefield, C. and Garnavich, P. and Kennedy, M. and Callanan, P. and Shappee, B. and Holoien, T., 2017, ApJ, 845, 7
- Marsh et al. (2016) Marsh, T. R., Gänsicke, B. T., Hümmerich, S., Hambsch, F.-J., Bernhard, K. 2016, Nature, 537, 374-377
- Pekön & Balman (2011) Pekön, Y., Balman, S., 2011, MNRAS, 411, 1177-1196
- Rea et al. (2017) Rea, N., Zelati, F. C., Esposito, P., D’Avanzo, P., de Martino, D., et al., 2017, MNRAS, 471, 2902-2916
- Lomb (1976) Lomb, N. R., 1976, Ap&SS, 39, 447-462
- Takata et al. (2007) Takata, J. and Chang, H.-K. and Cheng, K. S., 2007, ApJ, 656, 1044-1055
- Takata et al. (2018) Takata, J., Yang, H., Cheng, K.-S., 2017, ApJ, in press,
- Terada et al. (2008) Terada, Y., Hayashi, T., Ishida, M., Mukai, K., Dotani, T. et al. 2008, PASJ, 60, 387-397
- Yuasa et al. (2010) Yuasa, T., Nakazawa, K., Makishima, K., Saitou, K., Ishida, M., et al., 2010, A&A, 520, A25