The Late Jolt
Re-Examining the World Trade Center Catastrophe
Abstract.
The Twin Towers of the World Trade Center collapsed in a progressive top to bottom manner on the 11th of September 2001 after they were struck by two aircrafts.
A model of a gravity-driven collapse of a tall building has been proposed by Bažant et al. We apply this model to the collapse of the North Tower to determine the energy dissipation of buckling columns per storey during the collapse. This has already been done by Bažant et al. for the first three seconds. Using video record data we extend this time range to over 9 seconds. Our findings are 250 MJ during the first 4.6 seconds. In the time interval between 4.6 and 7.7 seconds after collapse initiation we find an additional energy dissipation per storey of 2500 MJ. Because the steel columns increase in strength towards the ground this value corresponds to a value of 2000 MJ for the storeys in the aircraft impact zone. After 7.7 seconds the value reduces to the value that corresponds to the value during the first 4.6 seconds.
These results have two possible interpretations:
-
(1)
If due to the building design (column strength, shape etc.) the energy dissipation per storey cannot reach the high values which we observed, then the collapse cannot be described by the gravity-driven collapse model.
-
(2)
If the collapse is described correctly by the gravity-driven collapse model, then we fond direct evidence that the collapse mechanism did not follow the same pattern during the whole of the collapse. The possible amount of energy dissipation was reduced by an order of magnitude during two long time time intervals.
In both cases there is no a priori reason to justify the sometimes expressed belief that the collapse was inevitable even after the falling top section had gained a significant amount of momentum. In fact, if the amount of energy dissipation had stayed only a little longer on the high level, then a gravity-driven collapse would have arrested.
Note that (1) implies that if in principle the gravity-driven collapse model describes gravity-driven collapses of tall buildings, then the collapse was not gravity-driven.
Keywords: World Trade Center, North Tower, Progressive Floor Collapse, Crush-Down Equation, Energy Dissipation, Structural Dynamics, High-Rise Buildings, New York City, Terrorism.
1. Introduction
1.1. The Case
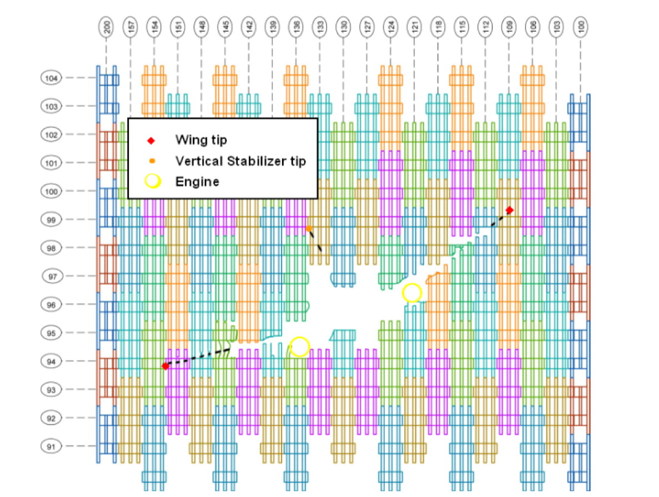
On the 11th of September 2001 three major buildings collapsed in New York City. They were part of the World Trade Center complex which consisted of seven buildings overall. The focus in this paper lies on one of the three. It was called the North Tower of the World Trade Center. At the time it was built it was the tallest building in the world with a height of , 110 storeys and a huge antenna on top. In the morning of the 11th of September 2001 it was struck by an aircraft. The fuselage of the aircraft impacted on the height of the 96th storey roughly 50 m below the top. The whole building collapsed 102 minutes later [NIST, 2005a, Ch. 2].
1.2. An Attempt for Explanation: The Gravity-Driven Collapse
An American government agency, the National Institute of Standards and Technology, issued a report in 2005 that tried to explain how the collapse initiated [NIST, 2005a]. However, they did not target the question how the collapse progressed. Two years later, in 2007, a model was proposed by Bažant and Verdure that describes the collapse of the North Tower as a gravity-driven progressive collapse [Bažant and Verdure, 2007].
Therein the collapsing building is modelled by three distinct parts which are: 1. The initial top segment that sat above the first failing floor (this segment keeps its height until the crushing front hits the ground). 2. The segment below the top segment which is compacted from its original undamaged size and moving with the same velocity as the top segment (the height of this segment is growing in time). 3. The resting, still undamaged segment below these two (the height of this segment is reducing).
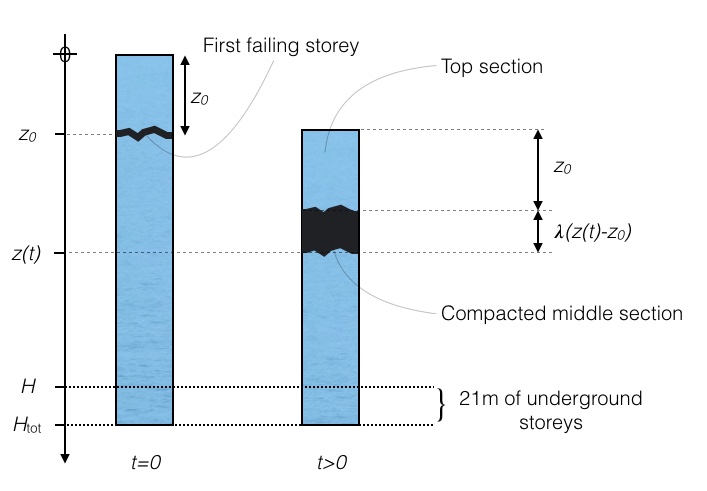
During the course of the collapses the initial top segment stays undestroyed and the height of the falling segment (the top and the middle segment together) is strictly increasing until the crushing front reaches the ground. Then the top segment is destroyed. It should be emphasised that this behaviour—the undestroyed top segment—is not a choice of model parameters but a consequence of the underlying Newtonian equation of motions. The argument for this conclusion is sketched in [Bažant et al., 2008, Appendix] where a two-sided front propagation is computed. The upward directed crushing front stops within a fraction of a second after having propagated an extremely short distance only.111 Unfortunately, the authors do not comment why they include the term to the momentum of the top segment in (33) of [Bažant et al., 2008] or (4) of [Bažant and Le, 2008]. A term like this could be considered in (32) as a result of the first colliding storeys. In (32) this term would avoid a vanishing mass of the compacted layer at time 0 if the initial conditions are used. (A non-vanishing mass is needed to solve the equation for .) So up to this initial and neglectable decay the height of the falling segment must increase.
The amount of how much the falling segment is growing in height is specified by how much the middle segment is compacted. When the crushing front reaches a storey, the ratio of the full height of that storey divided by the height after the crushing front has passed is called the compaction parameter . In [Bažant and Verdure, 2007] it is assumed that all storeys are compacted to the same height, and a value of is used. So if is the parameter that specifies the fraction of material that is spit outwards during the collapse at the crushing front, then
| (1) |
where is the initial volume of the tower, is the volume of the compacted rubble pile of the tower. In the numerical analysis of [Bažant and Verdure, 2007] is used, in [Bažant et al., 2008] a value of is considered to be reasonable. The actual value of does effect the downward movement only gradually (cp. Figure 5). In any case, if the crushing front has propagated a certain distance, then the height of the falling segment has increased by times this distance.
Now let us fix a coordinate system which is pointing downwards to the ground and whose origin has a fixed elevation above concourse level, namely the elevation of the initial undestroyed tower top (cp. Figure 1). Let be the position of the storey that collapsed first at the time of collapse initiation (), i. e. is the height of the undestroyed top segment. If is the position of the crushing front at time , then is the position of the roof top at time , and its time derivative is the downward velocity of both the top and the middle segment. Therefore the total momentum of the falling two segments is given by , where
| (2) |
describes the accumulated mass of the two moving segments. is the mass height-density of the undestroyed tower.
Then the equation of motion—which is called Crush-Down Equation in [Bažant and Verdure, 2007]— that is valid until the crushing front reaches the ground is given by
| (3) |
where is the upward resistance force due to column buckling, and , evidently, is the acceleration of gravity in New York City. Note here that the term column force always refers the upward directed force exerted by the intact building against the falling upper segments during the actual collapse. This quantity is related but not identical to the column strength itself, which is an abstract quantity that can be measured under controlled conditions in a corresponding experiment. (See Section 1.4 below for a further discussion.)
To model the aircraft impact damage and the fire damage of the tower let be the parameter which specifies how much the columns are weakened at . means full support. So the upward force is the product , where describes the undamaged column force. For our numerical analysis we will use
| (4) |
Note that the concrete choice of is only of minor importance, as it only effects the solution of the Crush-Down Equation in the very beginning. It is merely a way to trigger the propagation of the Crush-Down Equation from a resting upper building segment. (We don’t make any statements about what happened prior to the collapse or about the mechanism that led to a reduction of the column force.)
The shapes of and are specified in [Bažant et al., 2008, Fig. 2(a)] essentially as piece-wise linear functions, where the slope of the linear increasing part of is chosen proportional to the (increasing) cross-sections of the columns:222 It is mentioned on pages 895, 896 of [Bažant et al., 2008] that the transition into the linear increasing part should happen at the 81 storey for and . Therefore the term appears. The building had 110 storeys.
| (5) | |||||
| (6) |
where is a constant, is the height of one storey, the height of the tower, and is the maximal energy absorption capacity of the buckling columns per storey at the height of the aircraft impact. In other words: The quantity is the energy dissipation per storey that is needed to crush the columns of building in one storey, i. e. up to the constant factor , the quantity is the average upward resistance force during the collapse.
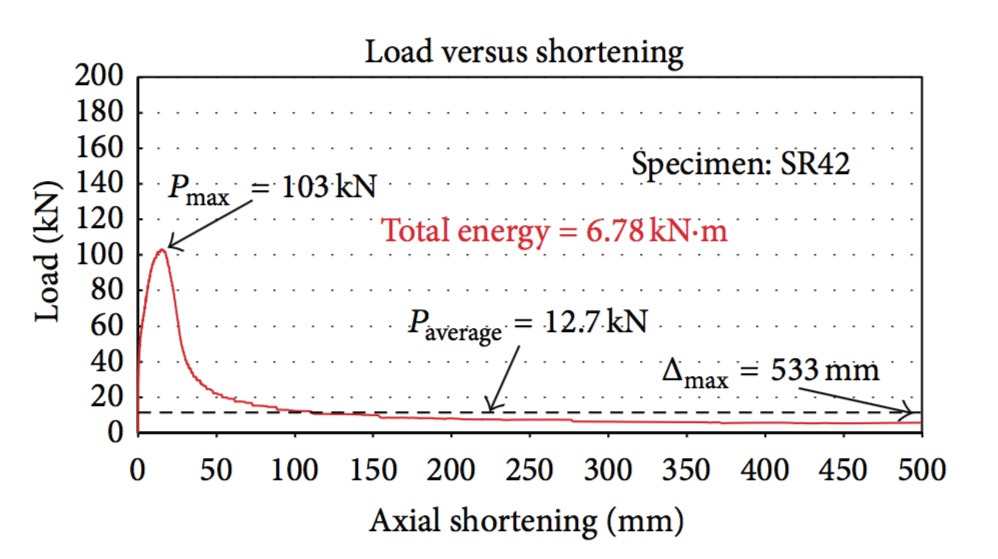
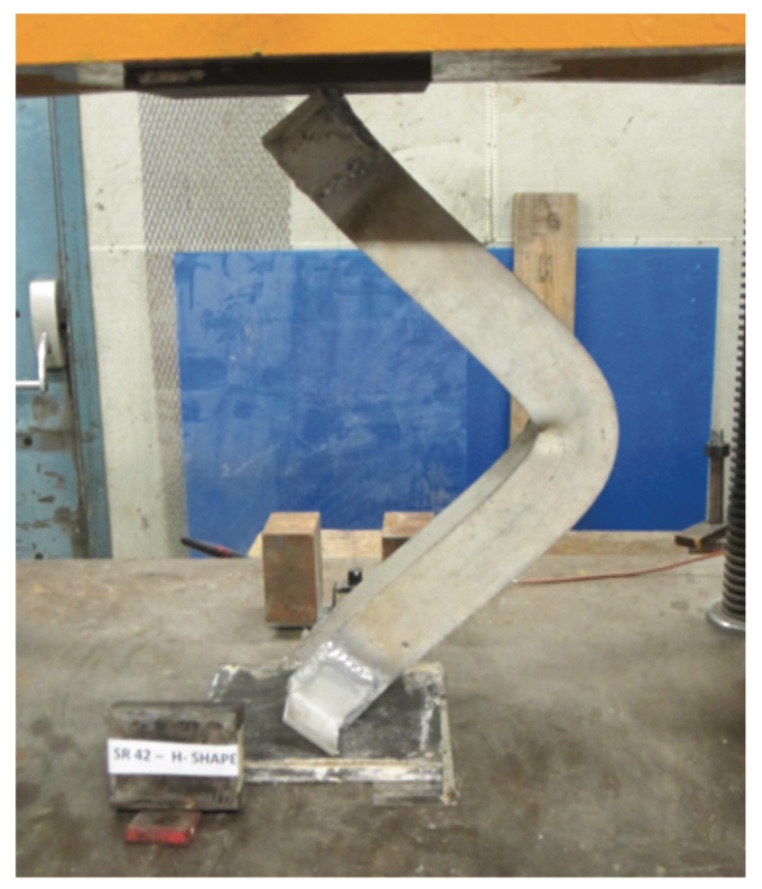
Of course, in a realistic scenario the force is not piece-wise linear, and the model will give unphysical solutions if the parameters are close to collapse but in reality still stable. One could simply add to a periodic function with period and vanishing integral to enhance the model to get rid of these unphysical solutions. Over one period (i. e. one storey) the actual shape of such a function could be chosen to be of the shape of the red function in Figure 2. It shows the axial load-displacement curve of an actual H-profile column that has been buckled under controlled conditions. Note here that the function in Figure 2 should only give a qualitative idea of how might be modified over one storey. The situation during the actual collapse is more involved: The columns are fixed, not all columns buckle simultaneously, some might brake off from their base etc. We cannot say much about the concrete collapse mechanism and take it as a black box. However, if collapse occurs, then only the average over one storey is the energetically relevant quantity. In this case should be regarded as the average upward force, and the error of the solution computed without the periodicity of the upward force is tiny.
Similarly, the mass density is the average of the actual mass density of the tower.
1.3. Initial Conditions
1.4. The Magnitude of Energy Dissipation
The main goal of this paper is to determine the quantity under the premiss of a progressive floor collapse of the North Tower as described by the Crush-Down Equation. For the sake of completeness, let us recapitulate some of the ongoing debate from the literature and clarify our goal:
In [Bažant and Zhou, 2002] and [Bažant et al., 2008] a maximal possible value of is mentioned, which is based on computations for a three-hinge buckling scenario. Yet meanwhile Korol and Sivakumaran have made empirical studies of buckling columns (cp. Fig. 2), which indicate that this value should be about 3 to 4 times bigger [Korol and Sivakumaran, 2014]. In [Bažant and Le, 2016] it is suggested that this value again should be corrected by a factor of . Taking these considerations seriously, a value of up to or maybe even more might be considered as realistic if the collapse mechanism is is based on the three-hinge buckling scenario. Note that in [Szulandziński et al., 2013] a value of even is proposed.
It should be emphasised that these values do not take any empirical data into account that are based on observations from the actual collapsing tower.
The objective of this paper is to obtain more refined empirical data form the actual collapse (Section 2). Indeed, using a larger pool of video record data we shall extend the empirical range to over 9 seconds in total. We observe a slightly smaller value of about 250 MJ for the time period of . However, we find that this value cannot stand the empirical data in the three second time interval between and , where we shall find an additional value of more than of energy dissipation of the buckling columns per storey. Taking the increasing strength of the columns into account, this value corresponds to a value of more than at impact level.
This amount of energy dissipation would—if it lasted longer—arrest the fall within the next 10 metres. However, after that period of three seconds the energy dissipation per storey reduces again to the initial low value (relative to the value at impact level).
We do not speculate how it was possible that the resisting structure rises and decays by an order of magnitude, but do point out that this was the case. A thorough investigation of the collapse mechanism needs to be done in order to understand how such an extreme difference of energy dissipation over long time intervals was possible.
We then conclude in Section 3.1 that there is no a priori reason that one should unconditionally assume that the columns of the building were designed too weak to arrest the fall even after the falling top segment had gained a significant amount of momentum.
1.5. The Modified Model
In [Bažant et al., 2008] the derived Crush-Down Equation is modified on the left-hand side as well as on the right-hand side. Let us discuss and clarify these modifications. We start with the left-hand side.
-
(lhs 1)
The compaction parameter is supposed to increase proportionally with . I. e. instead of assuming that every storey is compacted to the same height, it is assumed that every storey is compacted to the same density. We do not feel convinced that this necessarily more realistic, because it seems reasonable to expect that during the collapse the lower storeys are compacted to a higher density than the storeys above. In any case, this is only a tiny modification, and for simplicity we will ignore it and take in what follows.
-
(lhs 2)
The velocity profile of the middle segment is supposed to be non trivial. It is assumed to vary linearly from the top of the middle segment down to the crushing front. However, this modification is not done accurately in [Bažant et al., 2008] for the following reasons:
-
(a)
If the velocity profile is non trivial, then conservation of mass implies that the density of the compacted segment is also varying. Yet in [Bažant et al., 2008] it is assumed that the density is constant.
-
(b)
The linear velocity profile of [Bažant et al., 2008] is assumed to vary between the velocity of the top segment (at the top of the compacted layer) and the velocity of the crushing front (at the bottom of the compacted layer). This is an extremely unphysical assumption, because the latter velocity is bigger than the first one. Realistically, the velocity at the bottom of the compacted layer should be lower than the velocity at the top. The velocity of the crushing front should not be regarded as the velocity of any mass-bearing instance, but as a quantity that describes the change of the geometry of the crushing building.
-
(a)
The interested reader is advised to have a look at [Schneider, 2017b], where detailed account of how to deal with non-trivial velocity profiles in the compacted segment is given. Therein a version of the Crush-Down Equation for a rather general class of non-trivial velocity profiles is derived for both cases and . The result is that the modified left-hand side of the Crush-Down Equation in [Bažant et al., 2008] is not only based on unphysical assumptions, but also that the resulting modification has the wrong sign, and under realistic assumptions its absolute value is far too big. The wrong sign and the wrong absolut value also changes the solution of the Crush-Down equation in the wrong way [Schneider, 2017b, Figure 3].
In any case these adjustments are small, and for simplicity we ignore these technicalities here: We do not make any changes on the left-hand side of the Crush-Down Equation.
Let us now turn to the modifications on the right-hand side. The upward resistance force—which in (3) is supposed to be the force due to column buckling only—is completed by three other terms. They originate in the pulverisation of the concrete floor slabs, the kinetic energy of the ejected air in the squeezed storeys and the kinetic energy of the solid ejected material ().
-
(rhs 1)
The term due to ejection of solid material from the tower is derived from the assumption that a certain fraction of all the outwards-thrown material is kicked out at the crushing front with the velocity of the falling segment, and the other fraction of material has vanishing velocity. This implies that the term
should be added to the upward Force . Note that in [Bažant et al., 2008] the factor does not appear as the bottom of the compacted layer is assumed to move with the velocity of the crushing front. Of course, this factor can be suppressed by rescaling . A value of is used in [Bažant et al., 2008].
-
(rhs 2)
Once the crushing front has passed, the air inside a crushed storey got ejected. This causes an additional term
that should be added to the upward force. Here no term appears, as the ejection of air is due to the geometric changes of the collapsing building, which happen with velocity (and not with the velocity of the falling segment). For the precise structure of see [Bažant et al., 2008, p. 897], where a numerical range of from approximately to is derived. The higher values of seem to be rather artificial, as the air in the building might also escape through the elevator shafts and through the brocken floor slabs of a collapsing storey. This is has not been taken into account in [Bažant et al., 2008]. We will use a value of .
-
(rhs 3)
For the pulverisation of concrete another term is brought into the Crush-Down Equation:
where is a constant and is the mass of the concrete floor slabs. The numerical value used in [Bažant et al., 2008] is .
No clear explanation is given in [Bažant et al., 2008] why this term should occur: The Crush-Down Equation expresses the change of momentum under a continuous series of collisions. The total momentum after impact is not effected if the colliding objects break into pieces or if they stay intact.
In any case, this term has the same structure () as the term in (rhs 2), so the general structure of the Crush-Down Equation does not change if the term is included or not, and we will only refer to .
To summarise the modifications on the right hand side: A term of the form should be added.
1.6. The Downward Movement (Part 1)
For the numerical analysis let us transform the Crush-Down Equation, which is a 1-dimensional differential equation of 2nd order, into its corresponding 2-dimensional equation of 1st order. Firstly, it can be rewritten as
| (7) |
where
| (8) | |||||
Secondly, if is the vector field given by
| (11) |
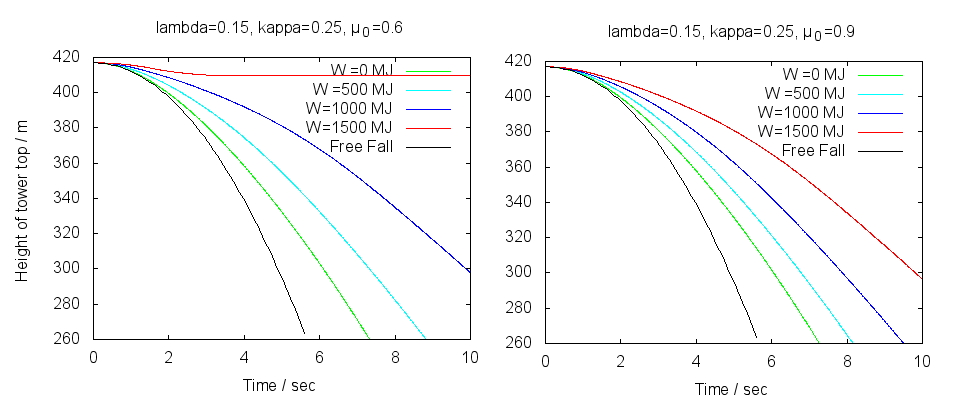
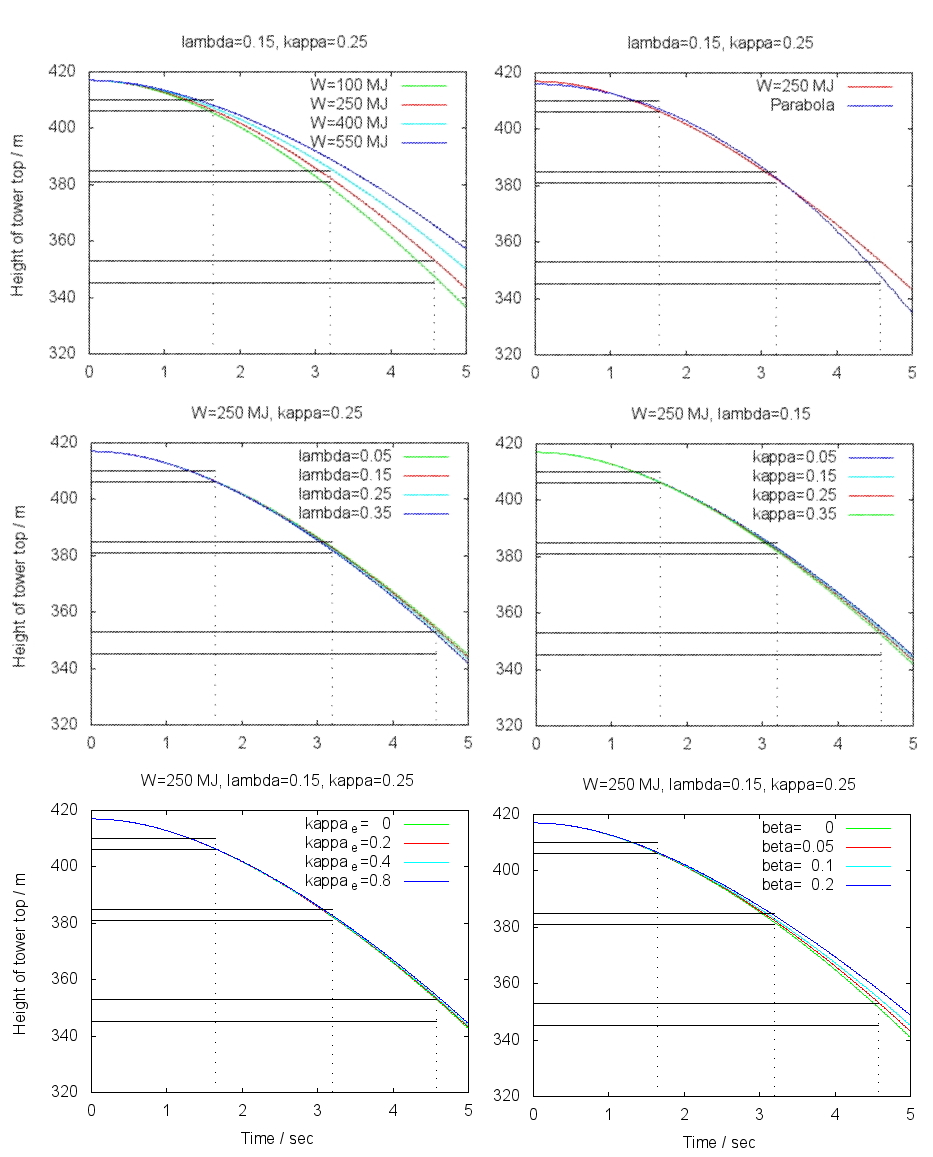
we shall consider the equation , which is equivalent to the original Crush-Down Equation. To analyse this equation numerically we use the open source computer algebra system Maxima (wxMaxima 16.04.0, [Maxi]) that is equipped with a pre-implementation of the Runge-Kutta algorithm. The source code is given in Appendix C. Figure 3 shows the height of the tower top as a function of time as derived from the Crush-Down Equation. The solutions in the left diagram are computed for the following choice of parameters:
| (12) | |||
| (16) |
For comparison we have included the right diagram with a total mass of the tower increased by 50%. For the total mass of the tower (including 21 m of underground storeys [NIST, 2005b, p. 19]) is 288,000 t. This value has been estimated meticulously in [Urich, 2007]. In [Bažant et al., 2008] a value of 500,000 t is stated without reference, which would give .
2. Length Measurements of the North Tower’s Collapse
2.1. Coupling the Model to Empirical Data
So far we have developed the mathematical framework to describe the collapse of the North Tower. We are now in the position to feed the model with empirical data to extract , the energy dissipation of the squashing building per storey during the collapse. The Crush-Down Equation enables us to recompute the upward force (i. e. its scaling factor ) from the downward movement of the crushing front. For that we need to determine the downward movement of the crushing front from the actual collapse. This is the contend of the following empirical analysis.
2.2. The Idea of Measurement
Our plan is to analyse video footage from different records of the North Tower’s Collapse. The sources are a short film documantary by Etienne Sauret called 24 Hours [Sauret] a History Channel documentary called The 9/11 Conspiracies: Fact or Fiction [History Channel] and some footage from CBS [CBS] and CNN [CNN]. Our goal is to determine the position of the roof under the principal assumption that the initially falling top segment of the building stays undetroyed during the course of the collapse. As we have mentioned this principal assumption is a consequence of a gravity-driven collapse.
During the first three and a half seconds the top segment is visible in Sauret’s video record, which enables a direct measurement of the height of the roof. After the roof disappeared behind the dust cloud the antenna is still visible, so we can trace the roof by tracing the movement of the antenna.
After the antenna disappeared we can still make reasonable statements about the position of the roof by just estimating the crushing front from below. This is done with the video clips of History Channel and CBS. The initial height of the top segment plus the height of the compacted segment must be added to the measured lower bound of the crushing front to obtain a lower bound for the position of the roof.
2.3. Video Analysis Tool and Machine Data
We do some simple length measurements with the open-source video analysis tool Tracker, Version 4.96 [Trac], running on a 2.7 GHz Intel Core i5 iMac with operating system OSX 10.11.3 (15D21). It is equipped with an 8 GB 1600 MHz DDR3 RAM, and an Intel Iris Pro 1536 MB graphics card.
2.4. Etienne Sauret
We use a sequence of stills from the short film 24 Hours shot by Etienne Sauret [Sauret] to determine the elevation of the top of the tower at three different times after collapse initiation.
Time is always measured relative to the collapse initiation at , which for us is the first recognisable movement of the north-west corner of the roofline. In the video copy we use this happens at frame number (first frame has number 0). The first visible movement of the antenna is three frames earlier. The frame rate of the video is 29,97 frames per second, i. e. 3 frames in 0.10 seconds, which means the uncertainty in time is about 0.033 sec.
Let us now chronologically follow our measurements.
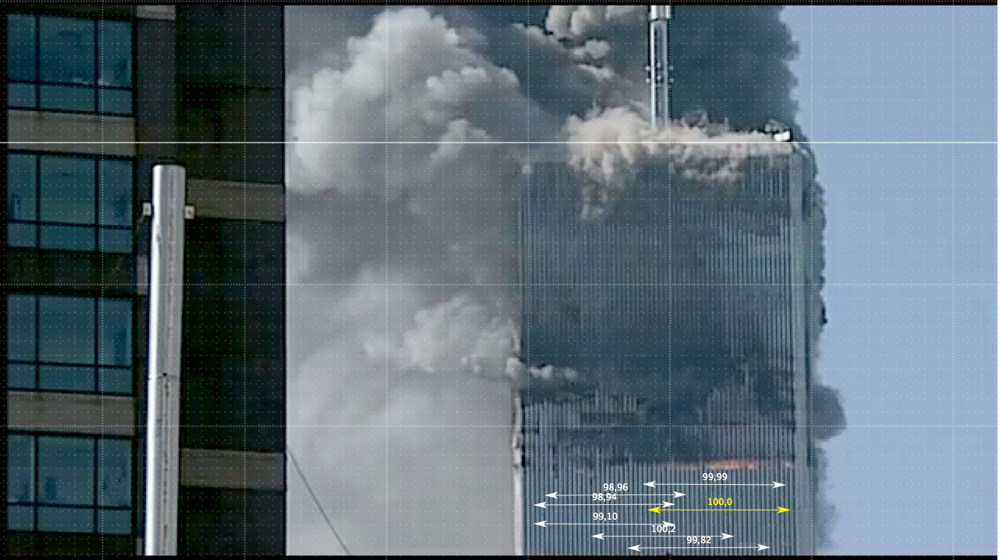
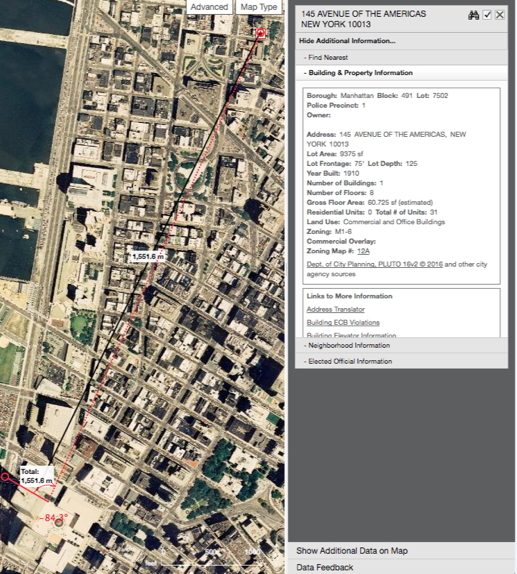
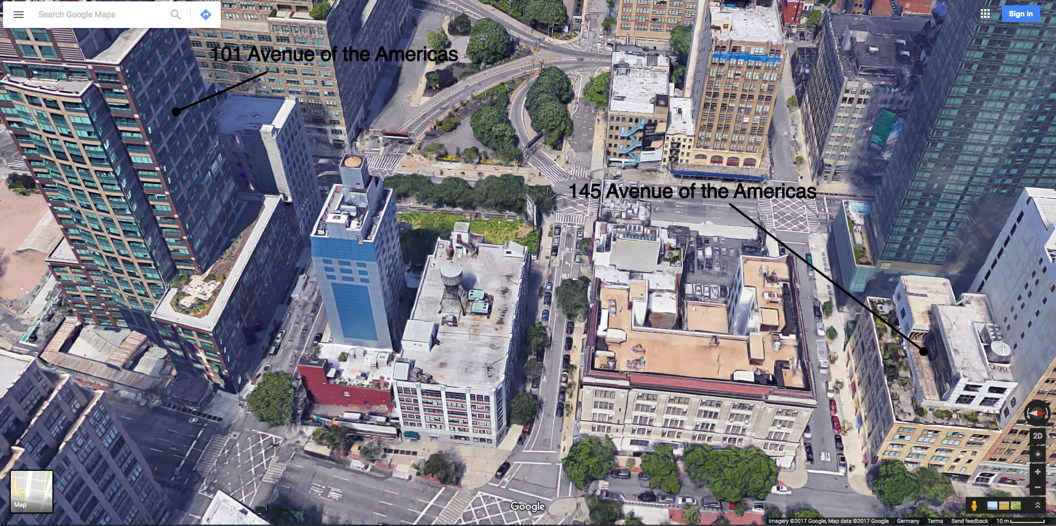
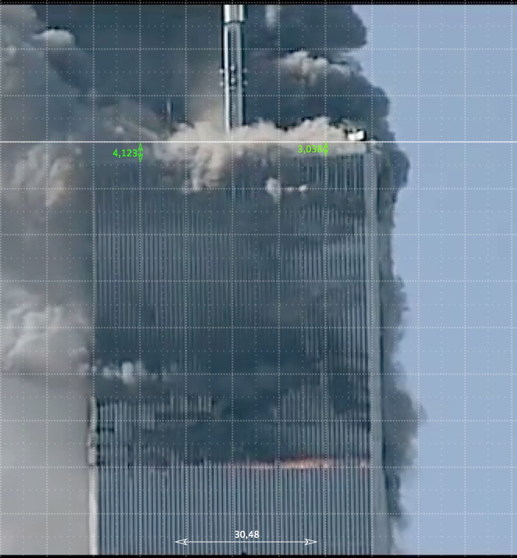
Figure 4 shows frame 800, i. e. . It shows a foreground building in the left. All other images are cropped and only show the right part of the actual video image. The foreground building is 101 Avenue of the Americas (6th Avenue). The video was shot from 145 Avenue of the Americas which is an 8 storey building (s. building description in Figure 15 and Figure 15), where Sauret’s film company Turn of the Century Pictures was based on the 7th floor [Turn]. This position gave an almost orthogonal perspective on the north side of the North Tower with a distance of (Figure 15). The roof of the North Tower (without its antenna) had an elevation of [NIST, 2005a, p. 5]. The optical center of the camera is targeting approximately 30 m below the roofline slightly to the east of the building. After estimating the height of the camera with another we obtain an upward camera angle of . The sideward camera angle is estimated by (Figure 15). Therefore, measured vertical distances have to be scaled up by a factor of when compared with horizontal distances on the north face of the tower. (The camera’s angle of view is small and neglected). Below we shall make an explicit comparison with a known vertical distance.
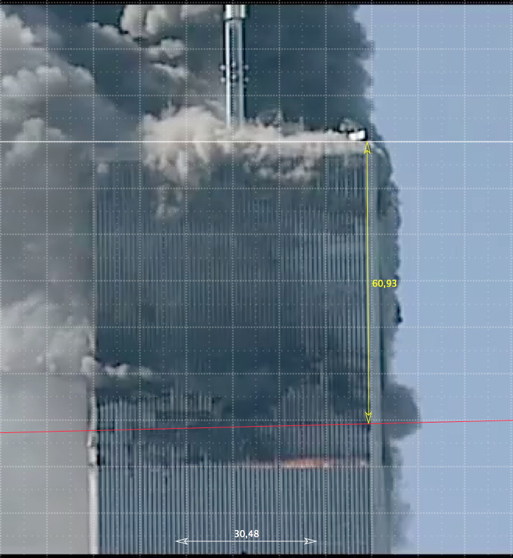
The horizontal length calibration of the video is done as follows: Seven times we have measured the distance of thirty columns including the gap to the next column, where we have set one of the distances to a reference scale of 100 units. Figure 4 shows these measurements. The yellow line is the reference line. Figure 13 shows a zoom on the relevant part of the image. From top to bottom these seven measurements are:
The mean is 99.86 with a standard deviation of 1.05. The structural diagrams of the steel segments used in the construction of the tower are shown in [NIST, 2005b, p. 25]. The width of a segment of three columns (including the gap to the next column) is stated as 10 ft 0 in, so thirty columns and the gap to the next one had a width of Therefore we will use
| (17) |
Our baseline for vertical length measurements is the horizontal line touching the north-west corner of the roof. This is the slightly thickened line of the grid in Figure 4.
From Sauret’s camera perspective the north-east corner appears to be approximately 1 m lower than the north-west corner.
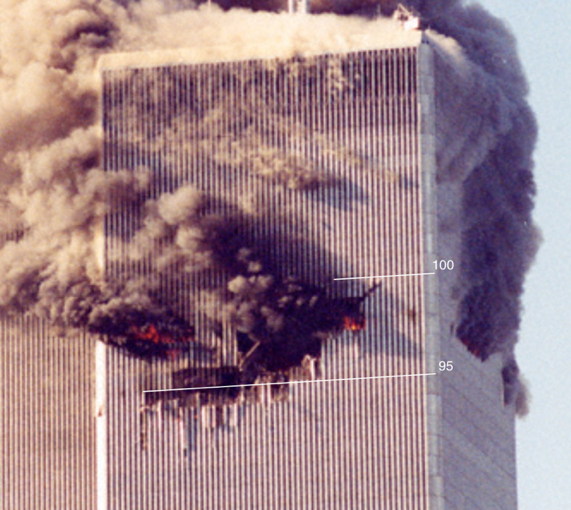
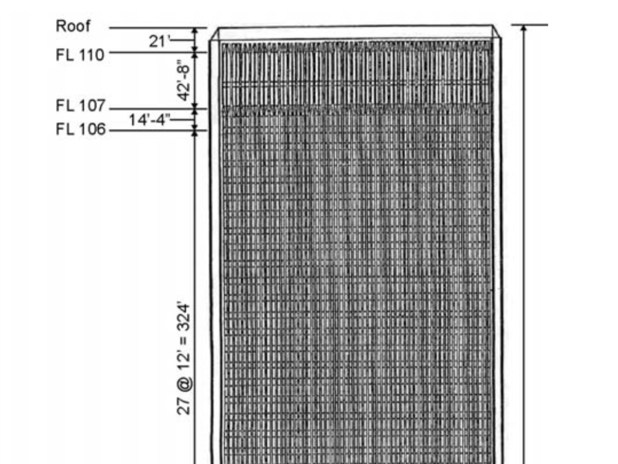
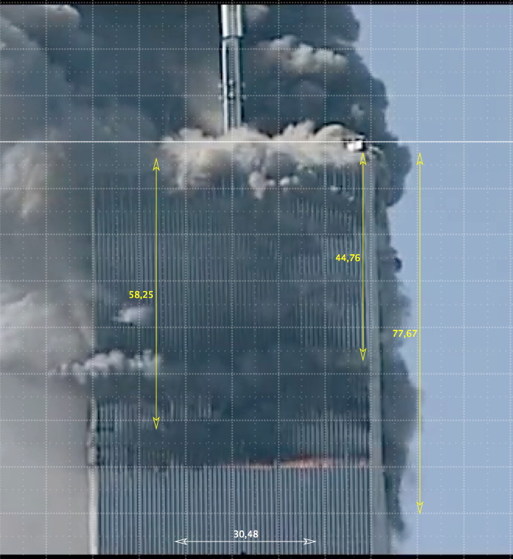
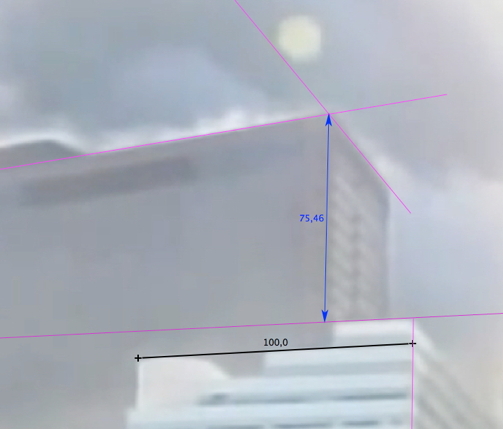
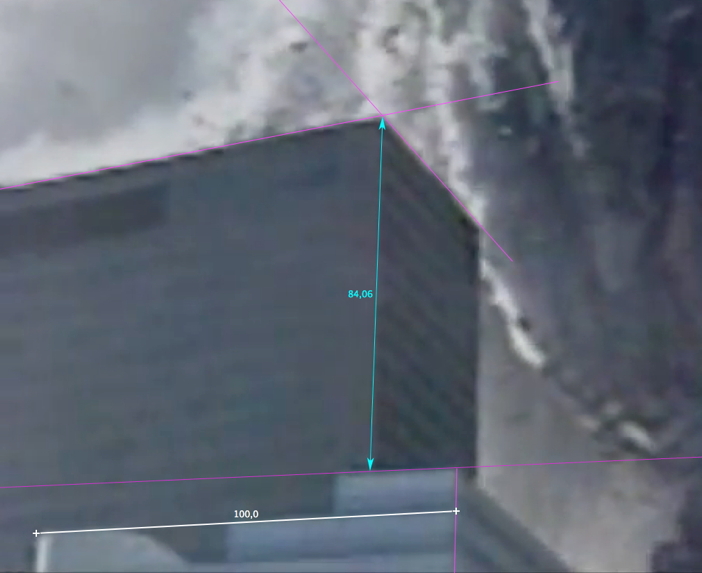
We should now compare the horizontal calibration with a known vertical length. This is done by the measurement in Figure 17. The white line indicates the horizontal calibration of . The yellow measurement from the baseline to the red line gives a vertical distance of . We can identify the red line with the long white line in Figure 17, which itself can be identified with the 95th floor (Figure 19). According to the structural drawings of the tower, the distance from the roofline to the 95th floor was (Figure 19). So the deviation is within our range of precision and we can proceed.
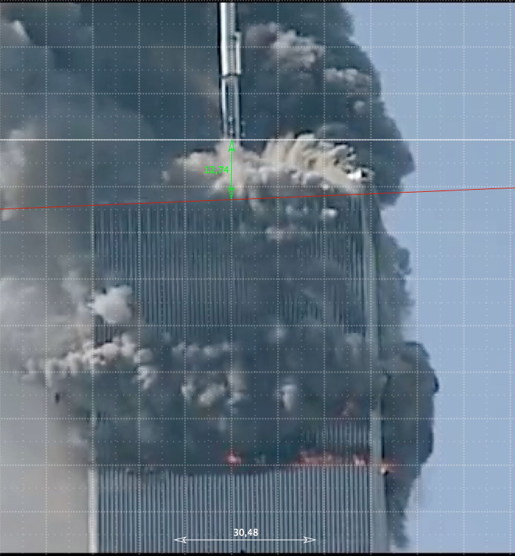
Three meters below the roofline the visible end of the steel columns appears as a transition from the lighter roof to the darker lower side of the building. We refer to this line as the ‘bottom of the roof’. It is sometimes easier to identify than the roof itself. Figure 21 shows the collapse initiation at frame 934. We measure 10 m away from the corners the position of the bottom of the roof. We find it and below the baseline. So in the middle we have a distance of 3.7 m to the baseline, i. e. in the middle the top of the roof has a distance of to the baseline
Figure 21 shows frame 957, . The middle one of the three yellow arrows points from the top of the roof to where one might think the collapse initiated at the north-west corner of the building. This is the middle of the lighter part of the appearing dust cloud. It has a length of . The arrow in the left indicates a part of the perimeter columns which move simultaneously with the top segment: As far as one can say, at this stage the crushing front is no clean horizontal line. The yellow line to the right has a height of , which is the height that is used in [Bažant and Verdure, 2007, Fig. 6] for the initially falling block. Clearly, this is an overestimation of that height. It has already been pointed out in [Szulandziński et al., 2013] that the mass of the falling block has been overestimated in [Bažant and Zhou, 2002, Bažant and Verdure, 2007, Bažant et al., 2008]. The wrong height assumption is probably the origin of this error, because the values match the mass distribution functions given in [Bažant and Verdure, 2007, Fig. 6]. Note that in [NIST, 2005a, p. 151] it is mentioned that the collapse initiated at the 98th floor. According to the structural drawings (Figure 19) the 12 storeys above had a height of . We will use therefore use as a lower bound for the height of the initially falling block.
The red line in Figure 23 has an angle of . It shows frame 983, . We find the top of the roof at below the baseline (the green measurement line ).
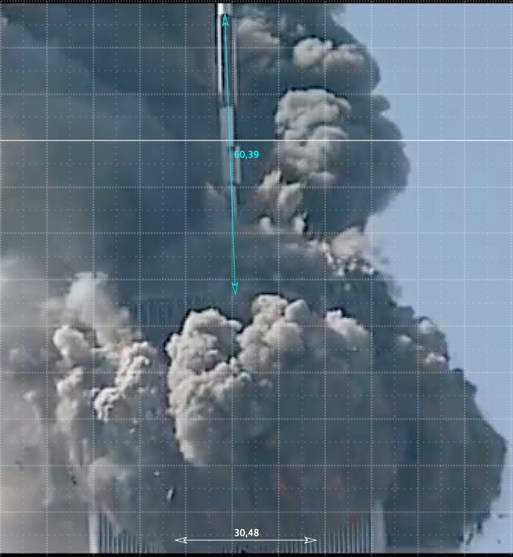
The antenna had clearly recognisable segments that appear white and dark from the front perspective. At frame 1024, , the bottom of a white part is visible at the top of the video. The measured distance between the lowest point of the white part of antenna and the bottom of the roof is . This is the light blue line in Figure 23. The antenna has an angle of approx. to the east at this time. (The antenna’s angle to the south reaches a value of before it is not visible any more. See below.)
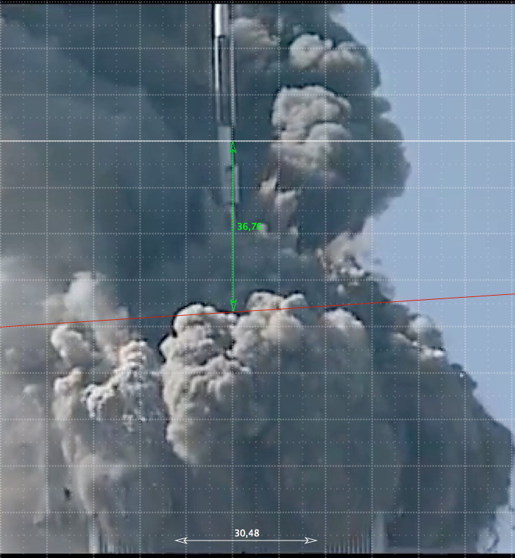
The red line in Figure 25 has an angle of . It shows frame 1030, . We find the top of the roof at below the baseline (the green measurement line ). The roof is still visible until couple of frames later but the contour is getting weaker as it gradually disappears behind the dust cloud.
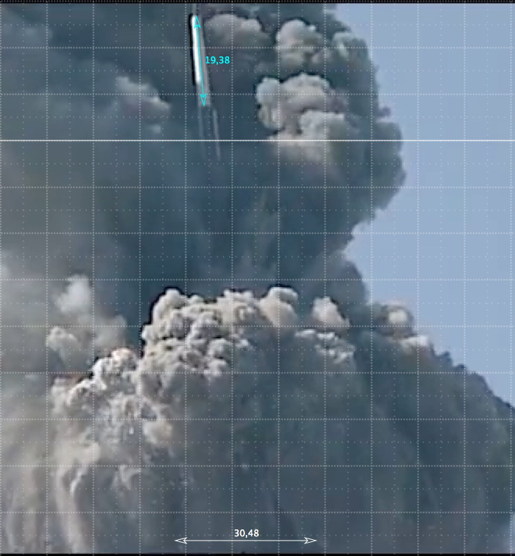
At frame 1050 the light part of the antenna is completely visible and measured. This is the short light blue line showing a measured length of in Figure 25. Together with the lower part we find the measured length of these two antenna segments to be . The eastward angle of the antenna is .
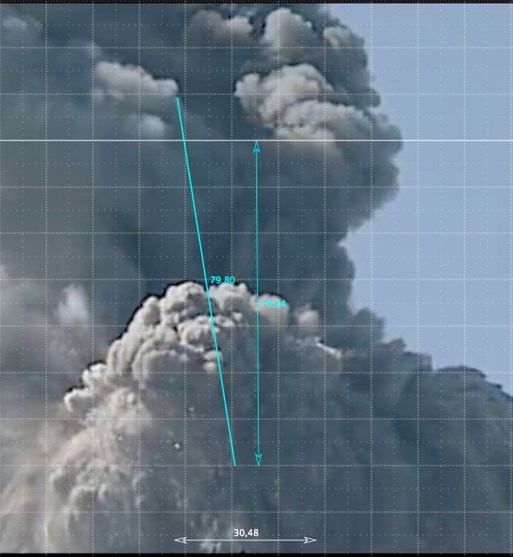
Figure 26 showes frame 1071, . This is the last frame where the top part of the white antenna segment is still visible. The light blue line of 79.8 m length indicates the position of the antenna with an assumed angle of to the east. The distance from the baseline to its lowest point is therefore . This is the point where the bottom of the roof is at this time. Of course, we assume here that the roof still exists. The antenna not only tilted eastwards but also southwards. In [NIST, 2005d, p. 166] an angle of is mentioned. So there is a small additional correction factor of , which gives a decent of for the top of the roof.
If we assume the total elevation of the middle of the roof to be at collapse initiation, we can summarise the measurements in the following table, including appropriate error estimates. The error estimate for the last value (antenna based) is bigger as the antenna might not be fixed on the roof, as we have mentioned the movement of the antenna started little before .
| Time/sec | Part of roof |
|
|
||||
|---|---|---|---|---|---|---|---|
| 0 | top, middle | 0.7 | |||||
| 1.64 | top, middle | 10.0 | |||||
| 3.20 | top, middle | 34.8 | |||||
| 4.57 | top, middle | 68.3 |
2.5. The Downward Movement (Part 2)
The video material of the Sauret video has already been used in [MacQueen and Szamboti 09] and [Chandler, 2010] to determine the downward acceleration of the roofline of the North Tower with shorter time intervals during the first three seconds. Their basic findings were a movement of the roof with a constant acceleration of and , respectively. To quickly compare our results with these two we do a linear regression for a parabola . The four data points from the first and third column of Table 1 give
| (18) |
where is the regression coefficient.
The empirical data from Table 1 are illustrated in the six diagrams of Figure 5 by the horizontal black lines which indicate the error bars. The actual values in the middle are not displayed. The coloured curves are the predicted model curves for the indicated values and for the other parameters as given in (12). The parabola in the upper right corner is the one derived from (18) and displayed for reasons of comparison.
For simplicity we do not give a sophisticated optimisation analysis here, but based on the printed model curves we take , , , , as the result with which we continue to work. The precise values for the best fit will not be important for our main result (cp. Section 2.9). The red graph in all six diagrams shows this solution.
Note, firstly, that higher values of become more and more unrealistic in a gravity-driven collapse. Secondly, a higher value of would require a lower value of .333 The same is true for the erroneous assumption on the velocity profile of the middle segment which would require a lower value of as explained in [Schneider, 2017b]. Thirdly, a lower value of would also match better if the starting time of the model curve is put slightly later at , . This would be a legitimate adjustment, as the model only describes the dynamical aspect of the collapse itself. It does not model the transition from the stable to the unstable state which takes a finite time interval. In this respect the value of is only an upper bound of energy dissipation for the first . This is important later.
2.6. Comaparing with Prior Obtained Data
Unfortunately, there is no reference in [Bažant and Verdure, 2007, Bažant et al., 2008] about the video footage that has been used and no indication about the starting time for their measurements. So neither we can comment on their starting time nor on the accuracy of their measurements. The result of [Bažant et al., 2008, p. 902] is an average upward force due to column buckling of . This correspond to a value of energy dissipation of per storey ().
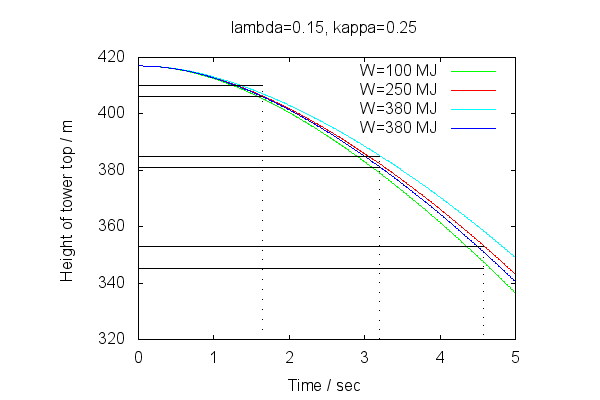
The discrepancy of our 250 MJ and the value of 380 MJ of [Bažant et al., 2008] (cp. 1.4) might be mainly explained due to the different numerical values of the mass of the tower. In [Bažant et al., 2008] a mass of 500,000 tons is used, whereas we use a mass of 300.000 tons. A direct comparison of the two solutions (250 MJ for 300.000 tons and 380 MJ for 500,000 tons) is given in Figure 6, where it is observed that their difference is rather small.
2.7. History Channel
We only want to evaluate one still from a documentary aired on History Channel [History Channel]. The frame rate of this video is 59.97 frames per second, so 6 frames correspond to 0.1 seconds. This footage shows the destruction of the North Tower recorded from West Street from a north-west ground perspective. It does not show all of the collapse, as the first few seconds are missing.
Figure 7 shows the collapsing tower at frame 262. It is possible to identify the time of frame 262 with a precision of one frame in Sauret’s video. This is done in Appendix B and the result is .
The building to the left is WTC 7. It was one of the three high-rise buildings that collapsed on the 11th of September 2001. It had 47 storeys and its roofline had a height of [NIST, 2008, p. 5]. The green line follows the roofline. Once the camera position is known we can determine the height of the point that is behind the green line right on the corner of the tower. The camera position is determined in Appendix A.1. If we assume the height of the camera to be ,444 Because the distance is much bigger than , the camera height has no practical influence on the result of (2.7). E. g. an additional height of 2 m would reduce the height of the crushing front by only. then the camera was located on West Street, in a distance of away from the north-west corner of the tower (Figure 32). The distance from the north-west corner of the tower to the intersection of the camera line and the projection of the green roof line to the ground (that’s the bold green line in Figures 32, 31) is determined to be . (That’s the red line in Figures 32, 31.) Therefore the point on the corner of the tower has an elevation of
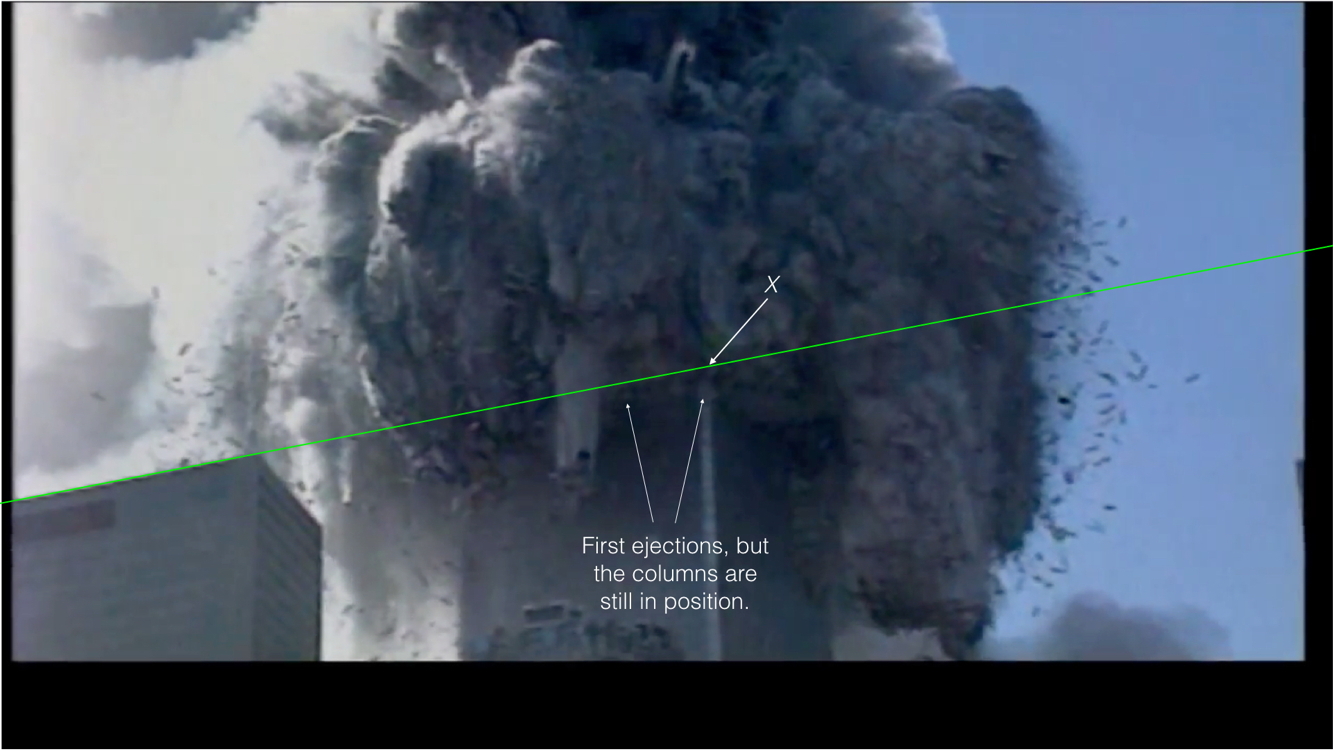
Apparently, Figure 7 shows that the crushing front is about to reach the point . Some amount of dust is already blown outwards below , but the perimeter columns are still standing without being affected. This is agreed in [Bažant et al., 2008, p. 901], where it is stated:
-
“Some critics believe that the bottom of the advancing dust cloud seen in the video represented the crushing front. However, this belief cannot be correct because the compressed air exiting the tower is free to expand in all directions, including the downward direction. This must have caused the dust front to move ahead of the crushing front[…]“
In other words the point is only a lower bound for the approaching crushing front. However, we shall give an argument in Section 2.9 that the distance between and the crushing front is probably small.
Now recall that the original height of the tower was 417 m and that the falling upper block had an initial height of at least This means that at the time of frame 262 a distance of at most has been crushed.
If we assume a gravity-driven collapse, then the top 46 m are still undestroyed, and a falling segment of height sits somewhere above point in Figure 7. We conclude that the roof had a total elevation of at least above concourse level at the time of frame 262. For a compaction parameter of this gives an elevation of .
Note that if one assumes a bigger height for the initial falling segment (as in [Bažant and Verdure, 2007, Bažant et al., 2008]), a bigger value of (as in [Bažant and Verdure, 2007, Bažant et al., 2008]) or a bigger height for the crushing front one obtains an even higher elevation of the roof.
2.8. CBS
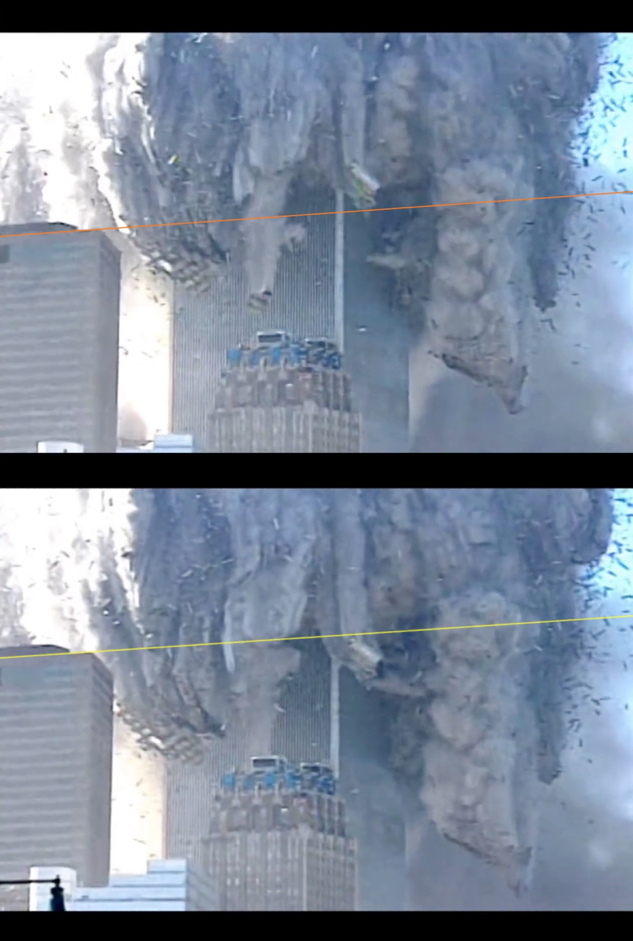
We do the same routine as for the History Channel clip for a clip from CBS. The copy of the film that we use has a frame rate of 25 frames per second [CBS]. Figure 8 shows frame 739 of this clip at a time of after collapses initiation (s. Appendix B.2 for synchronising the CBS clip). It shows that the crushing front is about to pass the point behind the green line (the roofline of WTC 7). The falling debris obstructs the view to most of the ejected dust from the tower, but going through the actual video clip shows that the moment is captured correctly in the sense that this is the last moment for which we can conclude that the crushing front is above the point . For comparison Figure 9 shows the same clip 10 and 20 frames ( and ) earlier.
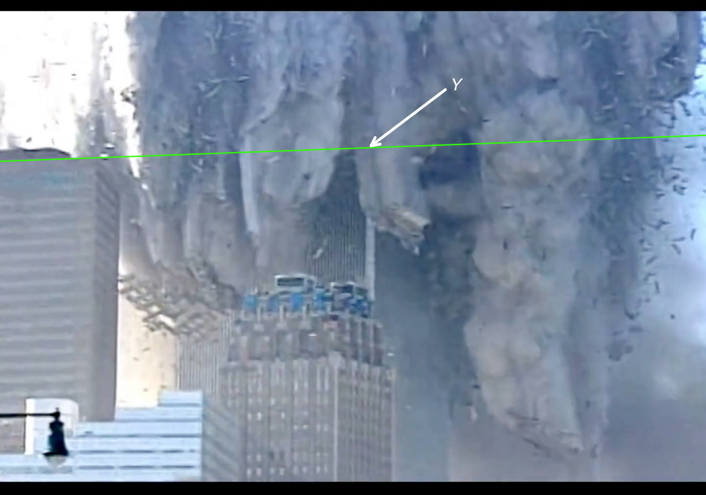
In Figure 49 the distance from the north west corner to the green line in the direction of the CBS camera is measured by the dark blue line. This distance is . In Appendix A.2 we find that the distance between the CBS camera and the north-west corner is . So if we again assume a camera height of we find another lower bound for the crushing front by the height of the point on the tower at time :
This estimate implies that a height of not more than has been compacted. For this gives an elevation of .
2.9. The Downward Movement (Part 3)
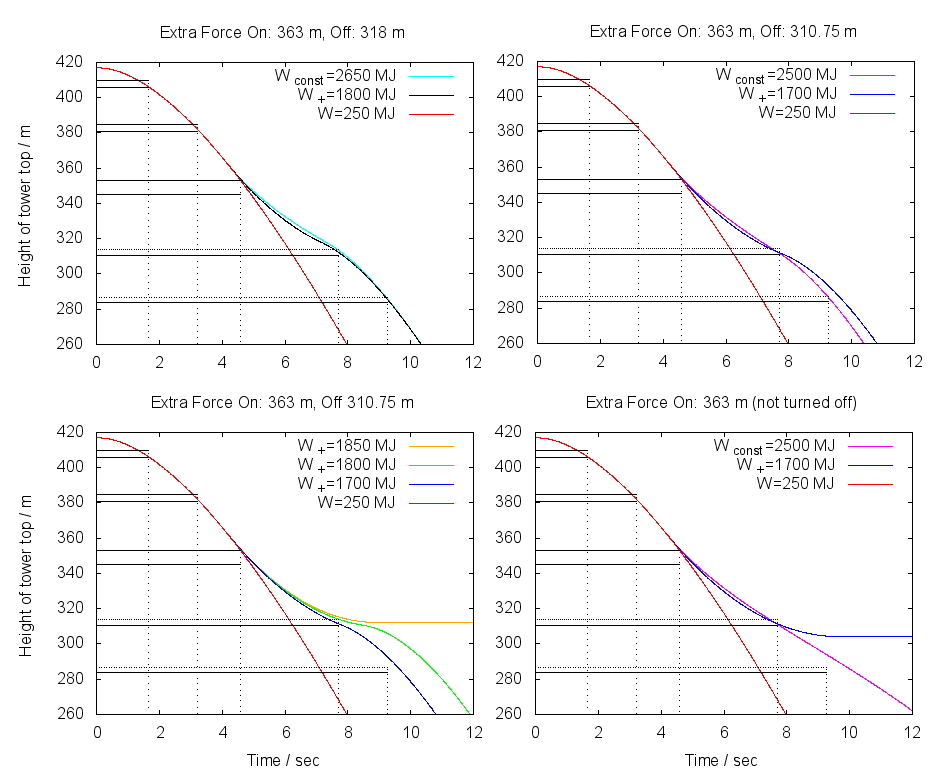
The error bars for the measured data are shown in Figure 10 as before by horizontal black lines. The dotted lines for the two lower measurements indicate that this is only a lower bound.
The red graph is identical in all four diagrams and shows the solution of the Crush-Down Equation with the maximal energy dissipation during the first seconds as explained in 2.5, i. e. , , and the other parameters as in (12). Note that the red graph misses the empirical data point at by 40 m, so we detect a major discrepancy here. This discrepancy would be significantly bigger for the above discussed value of an energy dissipation of only per storey.
The graphs in other colours are also solutions of the Crush-Down Equation for the same choice of parameters except that to the upward force an extra upward force is added over a certain interval. The interval is indicated above each diagram. It specifes the position of the roof where the force is turned on, and the position of the roof where it is turned off again.
Two types of extra forces we have used for the computations: A constant force and an extra force that is directly proportional to by the factor , i. e. in this case the total upward force is again proportional to , namely . Therefore the sum is the quantity which can be directly compared to the values discussed in Section 1.4. The force is the relevant quantity, as it reflects the column strength of the actual building. The discussion of the force is given for reasons of comparison.
All extra forces are turned on 10 m above the upper error bar of the third measurement, i. e. at 363 m in all diagrams. This takes the solutions out of the measured position at time , but we are interested in the minimal extra force that must be applied to match the two lower data points. By increasing the height where the extra force is turned on, we decrease the value of the necessary extra force to reach the lower data points at and , so this gives an error that decreases our result.
Three intervals are considered: Turning off at 318 m , turning off at 311 m and not turing of at all. The height 311 m is the height of the lower error bar of the measurement at . The extra force is minimised if it is applied until 311 m.
The magenta graph in the upper right diagram shows that during the time interval from to an additional energy of at least per storey was dissipated. The minimal value for to reach the data point at is (the blue graph). This corresponds to an energy dissipation of per storey at impact height. (The blue graphs in all three diagrams have the same value of .)
The two diagrams at the bottom indicate that this value is extremely close to arresting the collapse. Indeed the collapse would arrest if this extra force would continue 10 more meters (or a little more than another second) as one can see from the blue graph in the lower right. Note that the solution with the constant extra force does not arrest if the extra force stays turned on (the magenta graph in the lower right). The increasing strength of the actual columns is responsible for this effect.
The diagram to the lower left shows that the collapse would also arrest if only a slightly bigger value of 1850 MJ would apply (the yellow graph). The yellow graph terminates within the errorbars. Therefore the distance of the crushing front to the dust front cannot be bigger than the distance from the yellow graph to the lower one of the two error bars at time (which is less than 5 meters, i. e. less than two storeys), for otherwise the collapse would have terminated.555 To be precise at this point: The distance from the dust front to the crushing front could be bigger than the 5 m-distance of the yellow solution to the lower error bar, but that would mean that an even higher extra force did occur (over a shorter interval). A reasonable assumption is that the distance from the crushing front to the dust front is constant. This implies that the solution of the blue graph, which does not match the data point at (in the upper right diagram) is not the solution that we are looking for. But if one increases the extra force a little (), and tuns it off earlier at , one obtains the solution given in the upper left diagram This solution satisfies the empirical requirements. This solution also seems to be a better fit because from just watching the History Channel clip one might guess that the velocity of the dust front is not decelerating when it approaches the point . A more refined measurement could clarify this impression.
Note that the black graph has an energy dissipation that corresponds to an energy dissipation of per storey at impact level.
3. Discussion of Observations
3.1. The Magnitude of Energy Dissipation — Revisited
Under the principal assumption that the collapse of the North Tower was gravity-driven—as described by the Crush-Down equation—we found that the dissipated energy due to column buckling through the first 4.6 seconds was on a scale of at most per storey. In the subsequent three seconds this value increased by almost an order of magnitude to over 2000 MJ. After that time period it fell back to the initial low value. (Here we refer to the values relative to the columns at impact height.)
If the maximal possible dissipation of energy per storey is on a scale below 2000 MJ (as it is demanded in [Bažant and Le, 2016]), then this implies that the principal assumption is wrong.
If the maximal possible dissipation of energy can reach the high values which we determined (as the empirical studies of Korol and Sivakumaran indicate [Korol and Sivakumaran, 2014]), then we must urgently face the question why this value was not reached during the whole of the collapse, i. e. before 4.6 seconds and after 7.7 seconds—either of which would have terminated the propagation of the collapse. Understanding the mechanism that enabled this fluctuation of energy dissipation must have priority in a thorough investigation of the collapse. In particular, there is no reason whatsoever that one should expect that the collapse was inevitable and could not have been arrested by the energy dissipation of the buckling columns at any stage during the first of the collapse (and even later).
The numerical values for and that we used are all three smaller than the values used in [Bažant and Verdure, 2007, Bažant et al., 2008]. If we did the same analysis for the higher values therein, our result would be even more dramatic in the sense that the additional amount of energy dissipation would be bigger. (This statement is obvious for and also for , because less height is compacted. To discuss the parameter note that the height of the roof as computed from the measured position of the dust front decreases with a smaller .)
It would be desirable to have a more refined measurement of the downward movement of the crushing front/dust front. (We only used two data points.) As we have determined the camera position for the two clips from History Channel and CBS, a detailed analysis is possible, but requires much more effort. (The camera angle is changing, and the camera is zooming simultaneously.)
3.2. Conclusion
This work has presented fundamental empirical data of the collapse of the North Tower of the World Trade Center. These data reveal some highly remarkable phenomena during the collapse: Under the assumption of a gravity-driven collapse we have shown that the energy dissipation of buckling columns was reduced by an order of magnitude during two long time intervalls of the collapse. A thorough investigation of the collapse is needed to answer the questions that compellingly arise at this stage.
Appendix A Determining the Camera Position
A.1. History Channel
To determine the camera position we compare its perspective with the perspective of a known camera position. Other methods are applicable to determine the position, however, we present this method, because it is the most precise one we found.
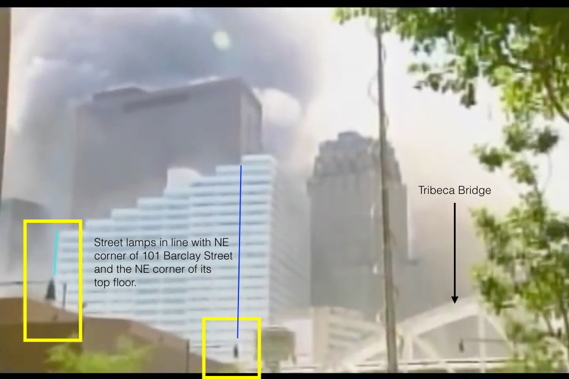
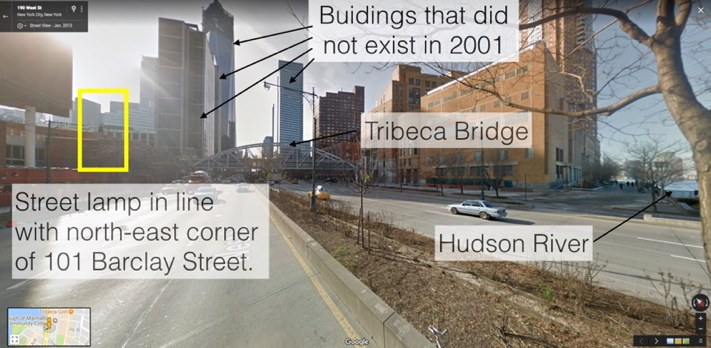
Consider Figure 27. This is a still from the NBC News coverage on the 11th of September 2001. The still is taken at 48 sec [NBC]. The camera is located on the green separation line on West Street. The building to the left is the Borough of the Manhattan Community College. The visible bridge that crosses West Street approximately 100 m southwards is the Tribeca Bridge (also known as Stuyvesant Bridge). The big white building is 101 Barclay Street and the tall building behind is WTC 7. Note that the camera position is uniquely determined by the position of the two street lamps in the picture, which coincidentally happen to be in line the north-east corner of 101 Barclay Street, and the north-east corner of the top floor of the same building, which is also in line with the north west corner of WTC 7.
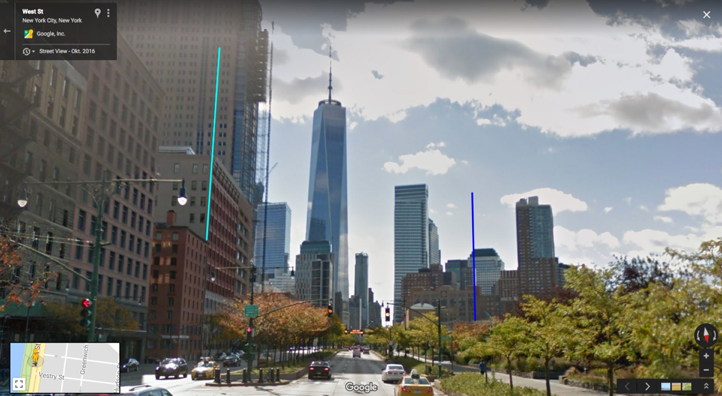
Figure 28 shows a Google Street View screen shot of the same location. It is dated January 2013.
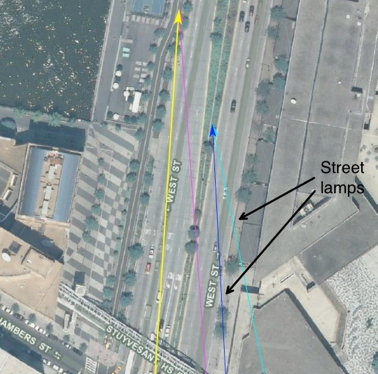
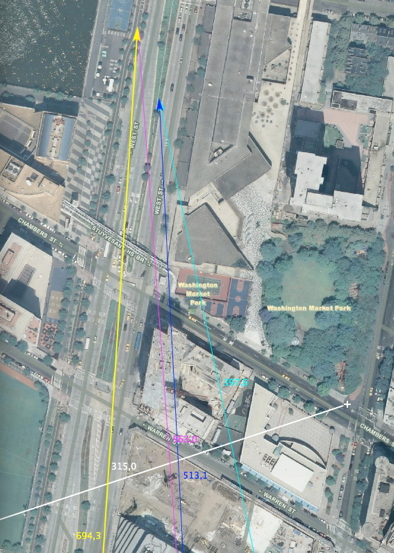
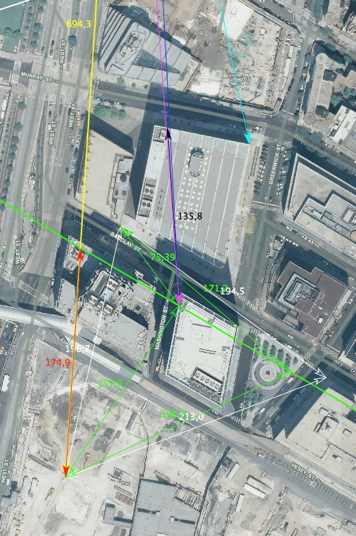
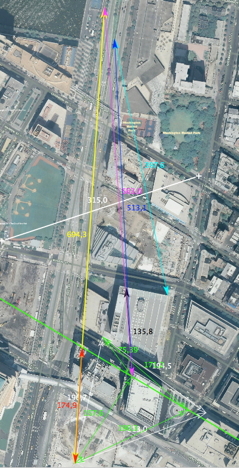
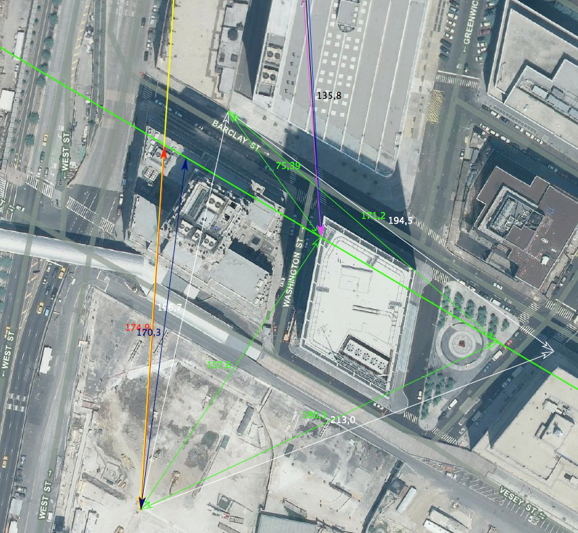
Figures 29, 30 and 31 show enlarged parts of Figure 32, which is material from an aerial photograph taken in 2006 and available on the website of the City of New York [NYC, 2006]. The intersection of the blue and the cyan line in these images is the NBC camera position. In Figure 29 the street lamps are visible on the pavement. They are used for placing the blue and the cyan line.
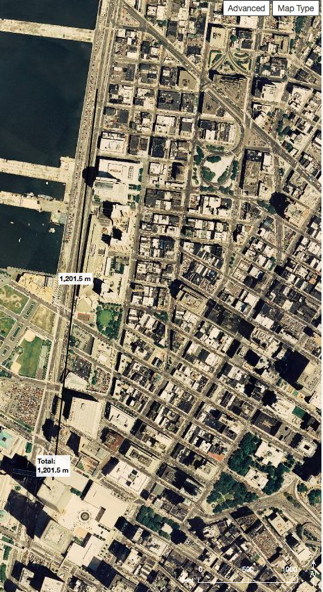
The length calibration for Figure 32 (the white line of ) is set between two randomly chosen street lamps which have a distance of . This length itself is determined by the online tool provided by the City of New York (Figure 33).
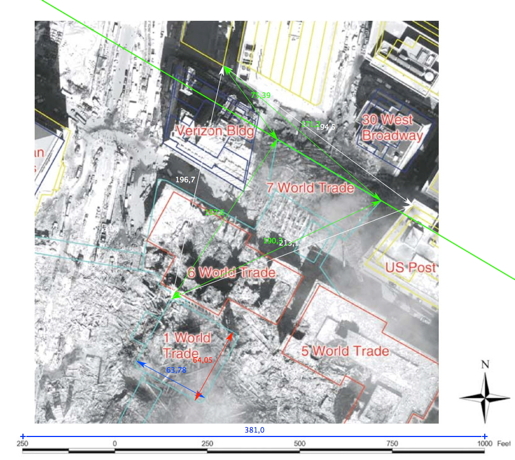
Using figure Figure 34, which is taken from [FEMA, 2002, Chap. 1, p. 1-13], we can reconstruct the north-west corner of the North Tower and the north-west corner of WTC 7 in Figure 32. These are the green and white triangles in the lower part of the images. The thick green line indicates the line following the direction of the north facade of WTC 7.
Therefore the blue line in Figure 32 measures the distance from the NBC camera position to WTC 7. This length is . The distance of the north-west corner of WTC 7 and the north east corner of the top floor of 101 Barclay Street (the short black line) is measured to be . These length measurements have a precision of .
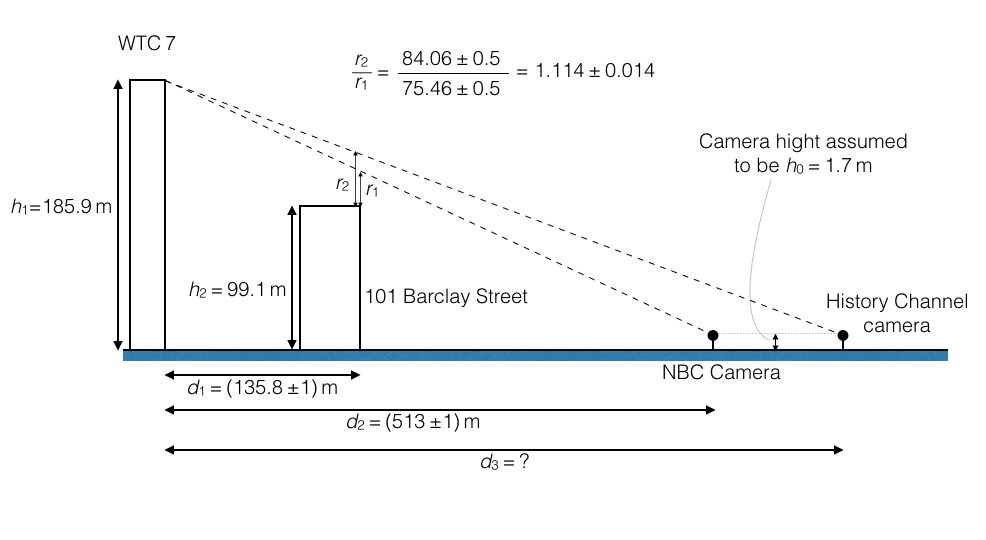
Now we are ready to determine the History Channel camera position by comparison. Compare Figure 35 with Figure 36. Figure 35 shows a cropped part of the NBC camera image four seconds later (and less blurred) than Figure 27). Figure 36 is a cropped part of frame 328 of the footage used by History Channel. We see that the camera positions are similar but little different. There is a tiny displacement of the History Channel record to the west and a clear displacement to the north, which is recognisable by comparing the indicated vertical measurements. The horizontal (black/white) calibration lines are set to 100 reference units. Note that the quotient of the two measured vertical distances is independent of the length of the reference unit. The measurements of the vertical lengths have an error of less than 0.5 reference units.
Because we know the height of WTC 7 ( [NIST, 2008, p. 5]) and the height of 101 Barclay Street ( [Emporis, 2016]), we are in the situation illustrated in Figure 11. This enables us to determine the distance by the two geometric equations
| (21) |
which gives
With this length the position of the History Channel camera is found at the north end of the violett line in Figure 32. The distance to the north-west corner of the North Tower (the yellow line in Figure 32) is then
| (23) |
A.2. CBS
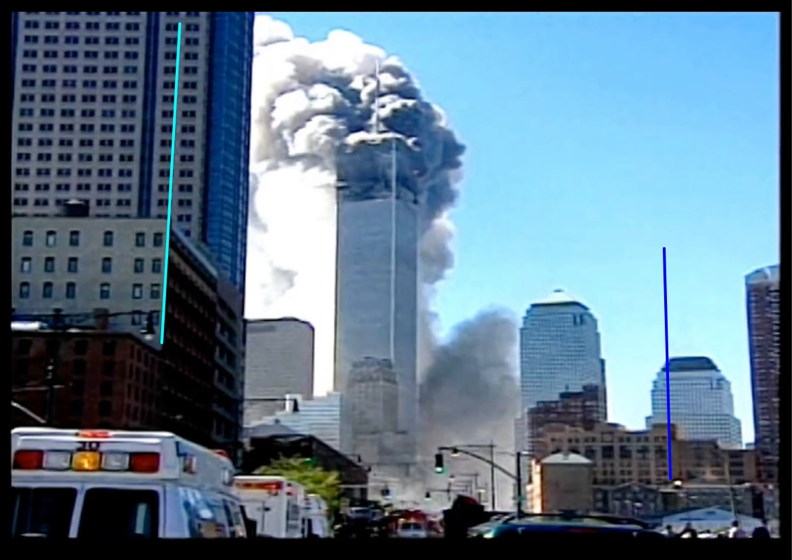
The position of the CBS camera can be determined by frame 400 as shown in Figure 46 up to an ambiguity of . It is located on West Street between the two intersections Desbrosses Street and Vestry Street. For comparison Figure 47 shows the same position. A distance from the camera to the north-west corner of the North Tower of is measured in Figure 48.
Appendix B Synchronising the Video Clips
B.1. History Channel
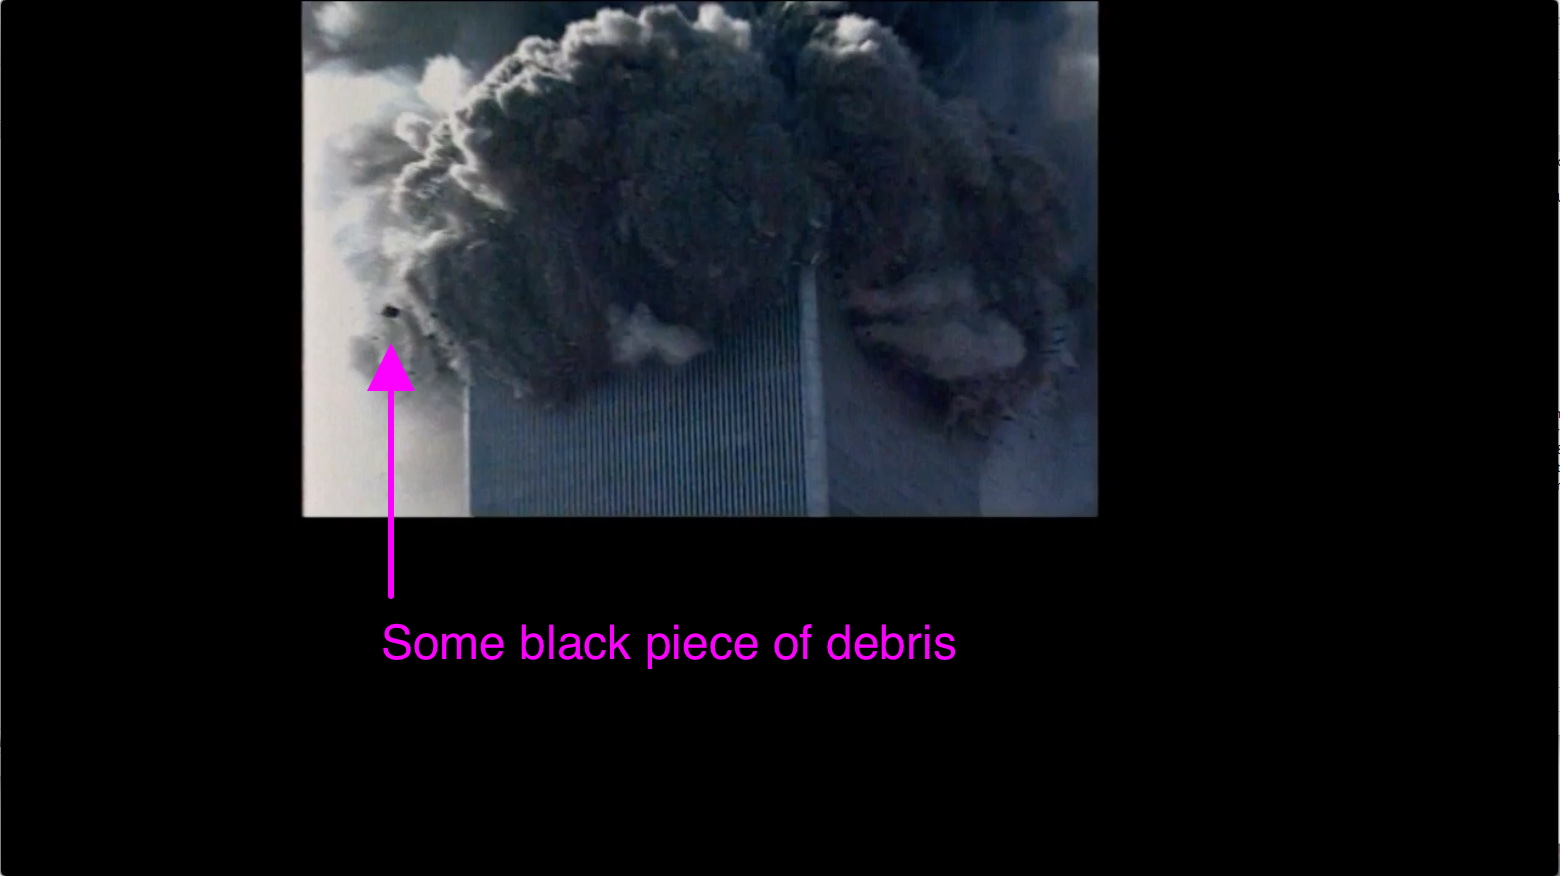
There are some rough methods to pre-adjust the Sauret clips and the History Channel clip up to a third of a second. E. g. there is a clearly recognisable black part of debris falling left (east) to the tower, which is on the first frame of the History Channel video (Fig. 12). In the Sauret Video this very same piece of debris is visible from approximately to in the lower left (Fig. 25).
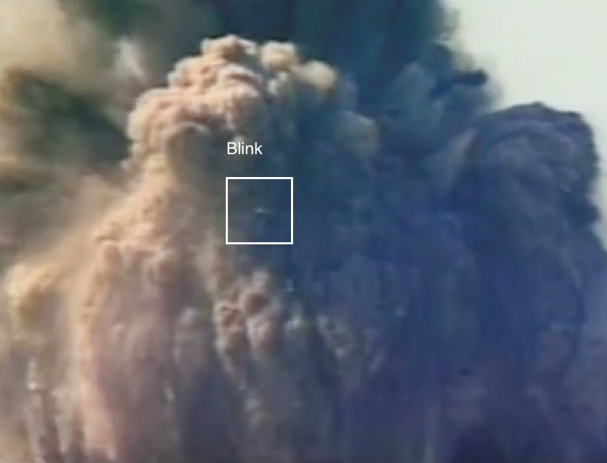
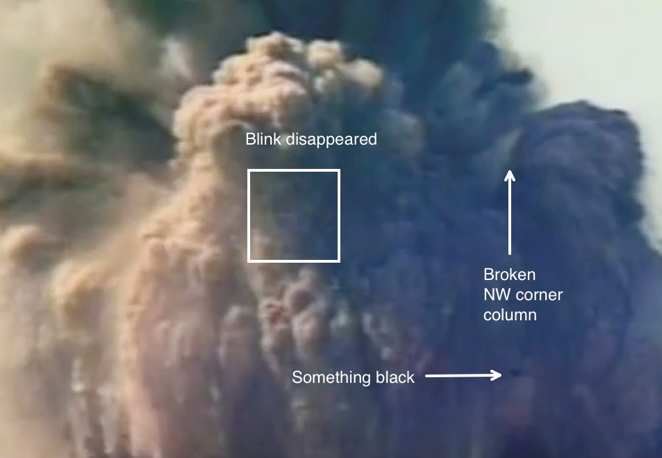
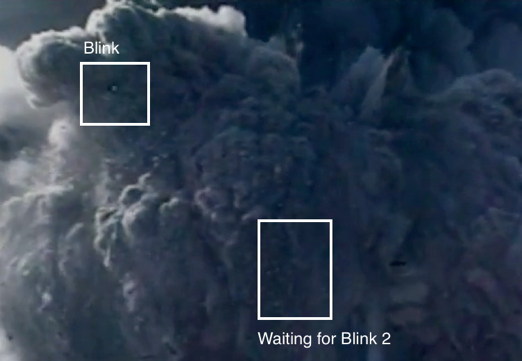
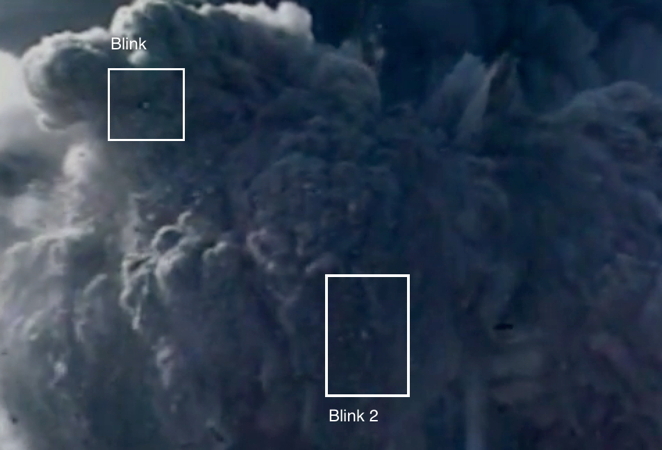
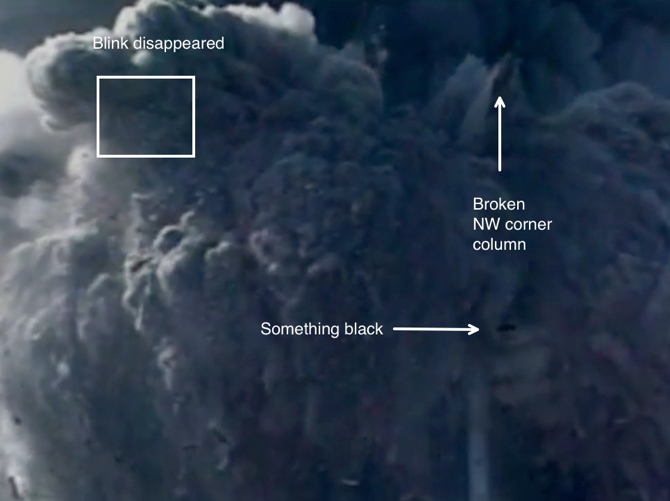
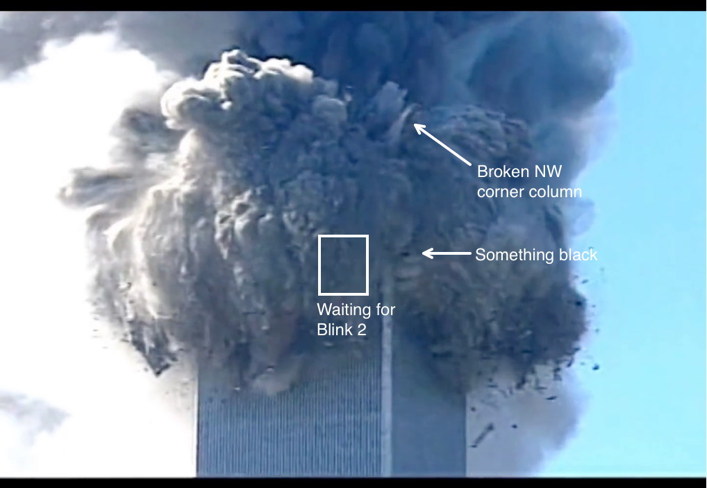
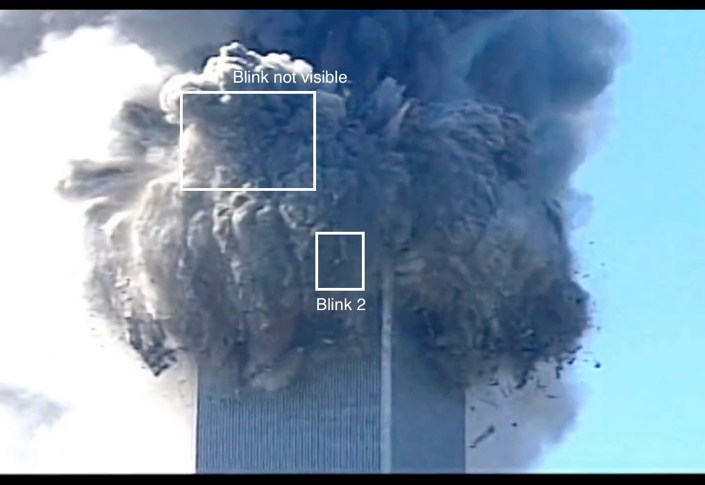
Once a rough calibration is done we are looking for an event that can be used to a synchronisation up to one frame. There are plenty of those: In the dust there are numerous and well localisable ‘blinks’ appearing. Some of them are only visible for one frame.
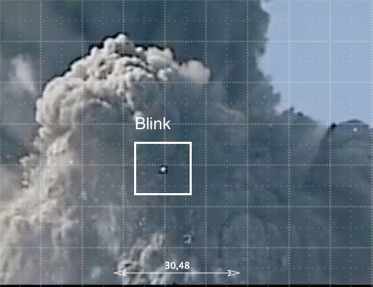
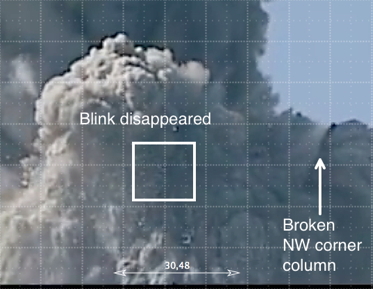
Not all of the blinks are visible in all camera perspectives, but we use such one for synchronisation that is visible in at least three records. The third record we use is taken from a CNN documentary [CNN] and gives an intermediate perspective between Sauret’s camera and the camera on West Street. Figureres 37 to 43 show the disappearance of the same blink in the three perspectives from one frame to the next. This is 1089 to 1090 in Sauret’s video, 110 to 111 in the History Channel video and 127 to 128 in the CNN video. We therefore identify the timeline of these videos at this step. For controlling reasons we have verified this synchronisation with other blinks and found confirmation up to one frame. This is as good as it can possibly be. Note the History Channel clip has the double frame rate of Sauret’s video.
Consequently, the time of frame of the History Channel clip is given by the time of frame in Sauret’s video. This time is after collapse initiation (at frame 934).
B.2. CBS
The blink that has been used to synchronise the Sauret video and the History Channel clip is not clearly visible in the CBS clip. But the appearance of another blink (Blink 2) in Figures 41 to 44 can be used to synchronise the History Channel clip and the CBS clip: The step from frame 636 to 637 (CBS) corresponds to 109 to 110 (History Channel), which happens at time .
The frame rate of the CBS clip is 25 frames per second. Therefore fame 739 of the CBS clip is after frame 637. This is after collapse initiation.
Appendix C Computing Numerical Solutions with Maxima
The following is the source code which we have used to compute the solutions of the Crush-Down Equation with Maxima [Maxi]. The variable z_1 corresponds to . v_0:0 sets the initial velocity to zero. Note for the computation that the mass density , the parameter and the energy absorption capacity of the columns miss a factor in the source code. However, this factor cancels out in the coefficients and , so the solution is not effected by this simplification.
/* [wxMaxima: input start] */
/* [Define the constants] */
mu_0:0.6; g:9.8; H:417; h:3.8; z_0:46; z_1:110;v_0:0;
/* [We compute 4 soltuions so we give the following parameters fourfold] */
lambda_1:0.15;kappa_1:0.25;
lambda_2:0.15;kappa_2:0.25;
lambda_3:0.15;kappa_3:0.25;
lambda_4:0.15;kappa_4:0.25;
alpha_1:0.1*kappa_1*(1-lambda_1)^2; beta_1:0.05;
alpha_2:0.1*kappa_2*(1-lambda_2)^2; beta_2:0.05;
alpha_3:0.1*kappa_3*(1-lambda_3)^2; beta_3:0.05;
alpha_4:0.1*kappa_4*(1-lambda_4)^2; beta_4:0.05;
W_1:250;
W_2:250;
W_3:250;
W_4:250;
/* [The measured data] */
t_1:1.64; a_1:408; error_1:2;
t_2:3.20; a_2:383; error_2:2;
t_3:4.57; a_3:349; error_3:4;
t_4:7.71; a_4:248; error_4:2;
t_5:9.25; a_5:216; error_5:1.5;
/* [The Heaviside step function] */
theta(z):=if z<0 then 0 else 1;
/* [The damage function] */
chi(z):=(0.5+0.4*theta(z-z_0-h)+0.1*theta(z-z_0-4*h));
/* [The mass density and the mass function] */
mu(z):= mu_0*(1+theta(z-z_1)*(0.43*(z-z_1)/(H-z_1)));
m_1(z):= mu_0*z_0+ (1-kappa_1)*mu_0*(z-z_0+ theta(z-z_1)*0.215*(z-z_1)^2/(H-z_1));
m_2(z):= mu_0*z_0+ (1-kappa_2)*mu_0*(z-z_0+ theta(z-z_1)*0.215*(z-z_1)^2/(H-z_1));
m_3(z):= mu_0*z_0+ (1-kappa_3)*mu_0*(z-z_0+ theta(z-z_1)*0.215*(z-z_1)^2/(H-z_1));
m_4(z):= mu_0*z_0+ (1-kappa_4)*mu_0*(z-z_0+ theta(z-z_1)*0.215*(z-z_1)^2/(H-z_1));
/* [The amount of extra energy dissipation] */
W_extra_1:1000;
W_extra_2:1500;
W_extra_3:2000;
/* [Turning the forces On and Off] */
on:a_3+error_3+10;
off:a_4-error_4+z_0+lambda_1*(H-z_0-(a_4-error_4) );
On_1(z):=theta(z-(z_0+(H-on)/(1-lambda_1))); Off_1(z):=-theta(z-(z_0+(H-off)/(1-lambda_1)));
On_2(z):=theta(z-(z_0+(H-on)/(1-lambda_2))); Off_2(z):=-theta(z-(z_0+(H-off)/(1-lambda_2)));
On_3(z):=theta(z-(z_0+(H-on)/(1-lambda_3))); Off_3(z):=-theta(z-(z_0+(H-off)/(1-lambda_3)));
/* [The extra forces] */
Extra_1(z):= W_extra_1/h * (On_1(z)+Off_1(z));
Extra_2(z):= W_extra_2/h * (On_2(z)+Off_2(z));
Extra_3(z):= W_extra_3/h * (On_3(z)+Off_3(z));
/* [The total upward column force] */
F_1(z):= (Extra_1(z)+W_1/h)*(1+theta(z-z_1)*(6*(z-z_1)/(H-z_1)));
F_2(z):= (Extra_2(z)+W_2/h)*(1+theta(z-z_1)*(6*(z-z_1)/(H-z_1)));
F_3(z):= (Extra_3(z)+W_3/h)*(1+theta(z-z_1)*(6*(z-z_1)/(H-z_1)));
F_4(z):= (W_4/h)*(1+theta(z-z_1)*(6*(z-z_1)/(H-z_1)));
/* [The coefficients of the Crush-Down Equation] */
phi_1(z):=g/(1-lambda_1)-chi(z)*F_1(z)/((1-lambda_1)*m_1(z));
phi_2(z):=g/(1-lambda_2)-chi(z)*F_2(z)/((1-lambda_2)*m_2(z));
phi_3(z):=g/(1-lambda_3)-chi(z)*F_3(z)/((1-lambda_3)*m_3(z));
phi_4(z):=g/(1-lambda_4)-chi(z)*F_4(z)/((1-lambda_3)*m_4(z));
psi_1(z):=(1-kappa_1)*mu(z)/m_1(z) + (alpha_1*mu(z)+beta_1)/((1-lambda_1)*m_1(z));
psi_2(z):=(1-kappa_2)*mu(z)/m_2(z) + (alpha_2*mu(z)+beta_2)/((1-lambda_2)*m_2(z));
psi_3(z):=(1-kappa_3)*mu(z)/m_3(z) + (alpha_3*mu(z)+beta_3)/((1-lambda_3)*m_3(z));
psi_4(z):=(1-kappa_4)*mu(z)/m_4(z) + (alpha_4*mu(z)+beta_4)/((1-lambda_4)*m_4(z));
/* [Compute the solutions with Runge-Kutta] */
/* [Using the Heaviside function the solutions arrest at negative velocities] */
time:12;stepwidth:0.01;
solution_1:rk ( [u* theta(u), phi_1(z)-u^2*psi_1(z)], [z, u], [z_0,v_0], [t,0,time,stepwidth])$
solution_2:rk ( [u* theta(u), phi_2(z)-u^2*psi_2(z)], [z, u], [z_0,v_0], [t,0,time,stepwidth])$
solution_3:rk ( [u* theta(u), phi_3(z)-u^2*psi_3(z)], [z, u], [z_0,v_0], [t,0,time,stepwidth])$
solution_4:rk ( [u* theta(u), phi_4(z)-u^2*psi_4(z)], [z, u], [z_0,v_0], [t,0,time,stepwidth])$
/* [Turn the solutions into the height of the roof] */
height_1:makelist([solution_1[i][1],H-(1-lambda_1)*(solution_1[i][2]-z_0)],i,1,length(solution_1))$
height_2:makelist([solution_2[i][1],H-(1-lambda_2)*(solution_2[i][2]-z_0)],i,1,length(solution_2))$
height_3:makelist([solution_3[i][1],H-(1-lambda_3)*(solution_3[i][2]-z_0)],i,1,length(solution_3))$
height_4:makelist([solution_4[i][1],H-(1-lambda_4)*(solution_4[i][2]-z_0)],i,1,length(solution_4))$
/* [Plot the solutions and the empirical data] */
wxplot2d( [
[discrete,height_1], [discrete,height_2],
[discrete,height_3], [discrete,height_4],
[parametric, t_1, t, [t, 0, a_1]],
[parametric,t, a_1+error_1, [t, 0,t_1]],
[parametric,t, a_1-error_2, [t, 0,t_1]],
[parametric, t_2, t, [t, 0, a_2]],
[parametric,t, a_2+error_2, [t, 0,t_2]],
[parametric,t, a_2-error_2, [t, 0,t_2]],
[parametric, t_3, t, [t, 0, a_3]],
[parametric,t, a_3+error_3, [t, 0,t_3]],
[parametric,t, a_3-error_3, [t, 0,t_3]],
[parametric, t_4, t, [t, 0, a_4+z_0+lambda_1*(H-z_0-a_4)]],
[parametric,t, a_4-error_4+z_0+lambda_1*(H-z_0-(a_4-error_4)),[t, 0,t_4]],
[parametric,t, a_4+error_4+z_0+lambda_1*(H-z_0-(a_4+error_4)),[t, 0,t_4]],
[parametric, t_5, t, [t, 0, a_5+z_0+lambda_1*(H-z_0-a_5)]],
[parametric,t, a_5-error_5+z_0+lambda_1*(H-z_0-(a_5-error_5)),[t, 0,t_5]],
[parametric,t, a_5+error_5+z_0+lambda_1*(H-z_0-(a_5+error_5)),[t, 0,t_5]]
],
[x,0,time], [y,260,420],
[style,[lines,1,orange],
[lines,1,cyan],
[lines,1,black],
[lines,1,red],
[dots,black],
[lines,1,black],
[lines,1,black],
[dots,black],
[lines,1,black],
[lines,1,black],
[dots,black],
[lines,1,black],
[lines,1,black],
[dots,black],
[lines,1,black],
[dots,black],
[dots,black],
[lines,1,black],
[dots,black],
[lines,1,black]
],
[ylabel,"Height of tower top / m "], [xlabel,"Time / sec"],
[title,concat("Extra Force On: ", string(on)," m, Off: ", string(off)," m" ) ],
[legend,
concat("W_+=",string(W_extra_1)," MJ"),
concat("W_+=",string(W_extra_2)," MJ"),
concat("W_+=",string(W_extra_3)," MJ"),
concat("W=",string(W_4)," MJ"),
"","","","","","","","","","","","","","","",""]
)$
/* [wxMaxima: input end] */
References
- [Bažant and Le, 2008] Bažant ZP and Le JL (2008) Closure to ‘Mechanics of progressive collapse: Learning from World Trade Center and building demolitions’ by Zdeněk P. Bažant and Mathieu Verdure, Journal of Engineering Mechanics, Vol. 134, No. 10 , 917–923, http://www.civil.northwestern.edu/people/bazant/PDFs/Papers/D25.pdf
- [Bažant and Le, 2011] Bažant ZP and Le JL (2011) Why the Observed Motion History of World Trade Center Towers Is Smooth, Journal of Engineering Mechanics, Vol. 137, No. 1, http://www.civil.northwestern.edu/people/bazant/PDFs/Papers/499.pdf
- [Bažant and Le, 2016] Bažant ZP and Le J.-L (2016) Mechanics of Collapse of WTC Towers Clarified by Recent Column Buckling Tests of Korol and Sivakumaran, Northwestern University, Report SEGIM No. 16-08c, http://www.civil.northwestern.edu/people/bazant/PDFs/Papers/00-WTC-2016-buckling.pdf
- [Bažant and Verdure, 2007] Bažant ZP and Verdure M (2007) Mechanics of Progressive Collapse: Learning from World Trade Center and Building Demolitions, Journal of Engineering Mechanics, Vol. 133, No. 3, http://www.civil.northwestern.edu/people/bazant/PDFs/Papers/466.pdf
- [Bažant and Zhou, 2002] Bažant ZP and Zhou Y (2002) Why Did the World Trade Center Collapse?—Simple Analysis, Journal of Engineering Mechanics, Vol. 128, No. 1, http://www.civil.northwestern.edu/people/bazant/PDFs/Papers/405.pdf
- [Bažant et al., 2008] Bažant, ZP, Le JL, Greening FR and Benson DB (2008) What Did and Did Not Cause Collapse of World Trade Center Twin Towers in New York? Journal of Engineering Mechanics, Vol. 134, No. 10, http://www.civil.northwestern.edu/people/bazant/PDFs/Papers/476.pdf
- [CBS] CBS video record of the collapse of the North Tower. We use a copy of the video that has been uploaded by the Youtube user Health Plan to https://www.youtube.com/watch?v=lKYW89xEYg0. It has a frame rate of 25.00 per second. A slightly shorter and stabilised version of this video with a frame rate of 59.94 per second has been uploaded by Nathan Flach to https://www.youtube.com/watch?v=OfVMOIUBnso.
- [Chandler, 2010] Chandler D (2010) Destruction of the World Trade Center North Tower and Fundamental Physics, Journal of 9/11 Studies, http://www.journalof911studies.com/volume/2010/ChandlerDownwardAccelerationOfWTC1.pdf
- [CNN] CNN: America Remembers, documentary. We use a copy of the video that has been uploaded by Nathan Flach to https://www.youtube.com/watch?v=m_wOO9vBMrk.
- [Emporis, 2016] Emporis GmbH (2016) Data Sheet for 101 Barclay Street, https://www.emporis.com/buildings/114274/101-barclay-street-new-york-city-ny-usa?pdf=.
- [FEMA, 2002] Fedaral Emergency Management Agency (2002) FEMA 403, World Trade Center Building Performance Study, https://www.fema.gov/media-library/assets/documents/3544
- [Google, 2013] Screen shot (taken in August 2017) from Google Street View showing West Street in January 2013, https://www.google.de/maps/@40.7182055,-74.012601,3a,90y,225.26h,89.82t/data=!3m6!1e1!3m4!1sK0hCgzGCdLOnATt93LdMEg!2e0!7i13312!8i6656.
- [Google, 2016] Screen shot (taken in October 2017) from Google Street View showing West Street in October 2016, https://www.google.de/maps/@40.7234147,-74.0116492,3a,33.2y,189.91h,101.91t/data=!3m6!1e1!3m4!1sBlcfZJ_dHWwWqY66lANbTA!2e0!7i13312!8i6656
- [Google, 2017] Screen shot (taken in September 2017) from Google Street View showing 101 and 145 Avenue of the Americas in 2017, https://www.google.de/maps/@40.7242671,-74.0034805,179a,35y,270h,44.96t/data=!3m1!1e3?hl=en.
- [History Channel] History Channel (2002) The 9/11 Conspiracies: Fact Or Fiction. We use a segment of the film uploaded by Nathan Flach to https://www.youtube.com/watch?v=rozNBjAuGs4. It consists of two replays of the same scene.
- [Korol and Sivakumaran, 2014] Korol KM, Sivakumaran KS (2014) Reassessing the Plastic Hinge Model for Energy Dissipation of Axially Loaded Columns , Journal of Structures, Article ID 795257, https://www.hindawi.com/journals/jstruc/2014/795257/
- [MacQueen and Szamboti 09] MacQueen G, Szamboti T (2009) The Missing Jolt, Journal of 9/11 Studies, http://www.journalof911studies.com/volume/2008/TheMissingJolt7.pdf
- [Maxi] Maxima can be downloaded at http://maxima.sourceforge.net/download.html
- [NBC] NBC News: Live coverage on the 11th of September 2001. We use a copy of that coverage that has been uploaded by Nathan Flach to https://www.youtube.com/watch?v=WKaL4eqd_h4.
- [NIST, 2005a] National Institute of Standards and Technology (2005) NCSTAR 1: Federal Building and Fire Safety Investigation of the World Trade Center Disaster: Final Report of the National Construction Safety Team on the Collapses of the World Trade Center Tower, https://www.nist.gov/engineering-laboratory/final-reports-nist-world-trade-center-disaster-investigation
- [NIST, 2005b] National Institute of Standards and Technology (2005) NCSTAR 1-1: Federal Building and Fire Safety Investigation of the World Trade Center Disaster: Design, Construction, and Maintenance of Structural and Life Safety Systems, https://www.nist.gov/engineering-laboratory/final-reports-nist-world-trade-center-disaster-investigation
- [NIST, 2005c] National Institute of Standards and Technology (2005) NCSTAR 1-1: Federal Building and Fire Safety Investigation of the World Trade Center Disaster: Visual Evidence, Damage Estimates, and Timeline Analysis, (2005), https://www.nist.gov/engineering-laboratory/final-reports-nist-world-trade-center-disaster-investigation
- [NIST, 2005d] National Institute of Standards and Technology (2005) NCSTAR 1-6: Structural Fire Response and Probable Collapse Sequence of the World Trade Center Towers, https://www.nist.gov/engineering-laboratory/final-reports-nist-world-trade-center-disaster-investigation
- [NIST, 2008] National Institute of Standards and Technology (2008) NCSTAR 1A: Federal Building and Fire Safety Investigation of the World Trade Center Disaster: Final Report on the Collapse of World Trade Center Building 7, https://www.nist.gov/engineering-laboratory/final-reports-nist-world-trade-center-disaster-investigation
- [NYC, 1996] The City of New York: Building information and aerial photograph of NYC, dated 1996, http://maps.nyc.gov/doitt/nycitymap/
- [NYC, 2006] The City of New York: Aerial photograph of NYC, dated 2006, http://maps.nyc.gov/doitt/nycitymap/
- [Sauret] Sauret E (2002) 24 Hours, Short film documentary about the events of the 11th of September 2001. The full version of the film is available at The https://www.youtube.com/watch?v=UWc2aaLq8PM. The copy of the video we use is the one that has been uploaded by Nathan Flach to URL https://www.youtube.com/watch?v=xGAofwkAOlo. This copy consists of 5,743 frames showing only the first seconds of the collapse with two replays.
- [Schneider, 2017a] Schneider A (2017a) Energy Estimates of Progressive Floor Collapses, preprint available at http://front.math.ucdavis.edu/search?a=ansgar+schneider
- [Schneider, 2017b] Schneider A (2017b) The Crush-Down Equation for Non-Constant Velocity Profiles, preprint available at http://front.math.ucdavis.edu/search?a=ansgar+schneider
- [Szulandziński et al., 2013] Szulandziński G, Szamboti A, Johns R (2013) Some Misunderstandings Related to WTC Collapse Analysis, International Journal of Protective Structures, Volume 4, Number 2, http://911speakout.org/wp-content/uploads/Some-Misunderstandings-Related-to-WTC-Collapse-Analysis.pdf
- [Trac] Tracker is available under the URL http://www.physlets.org/tracker/.
- [Turn] http://www.turncenturypictures.com/
- [Urich, 2007] Urich GH (2007) Analysis of the Mass and Potential Energy of World Trade Center Tower 1, Journal of 9/11 Studies, http://www.journalof911studies.com/letters/wtc_mass_and_energy.pdf

