Thermal runaway in two-dimensional complex plasma crystals
Abstract
The full melting of a two-dimensional plasma crystal was induced in a principally stable monolayer by localized laser stimulation. Two distinct behaviors of the crystal after laser stimulation were observed depending on the amount of injected energy: (i) below a well-defined threshold, the laser melted area recrystallized; (ii) above the threshold, it expanded outwards in a similar fashion to mode-coupling instability induced melting, rapidly destroying the crystalline order of the whole complex plasma monolayer. The reported experimental observations are due to the fluid mode-coupling instability which can pump energy into the particle monolayer at a rate surpassing the heat transport and damping rates in the energetic localized melted spot, resulting in its further growth. This behavior exhibits remarkable similarities with impulsive spot heating and thermal runaway (explosion) in ordinary reactive matter.
pacs:
52.27.LwI Introduction
Complex (or dusty) plasmas are weakly ionized gases containing solid micro- or nanoparticles (often referred to as dust particles). Due to interactions with electrons and ions in the ambient plasma, dust accumulates a net electric charge Bouchoule (1999); Shukla and Mamun (2002); Morfill and Ivlev (2009). In laboratory low-pressure gas discharges, this charge is negative due to the high mobility of the electrons. By injecting monosized spherical microparticles in the sheath of a capacitively coupled radio-frequency (cc-rf) discharge, it is possible for particles to form a monolayer. This is a result of all the microparticles levitating at the same height in the sheath region above the lower electrode where the electric field is strong enough to balance gravity and ensure stiff confinement Brattli and Havnes (1996); Samarian and James (2001). Under specific conditions, they form strongly coupled ordered structures known as two-dimensional (2D) complex plasma crystals Dubin (2000); Melzer et al. (2000a); Nunomura et al. (2000); Samsonov et al. (2000); Chu and I (1994); Thomas et al. (1994).
2D complex plasmas are often used as model systems for studies of generic phenomena occurring in liquids and crystals at the kinetic (particle) level Morfill and Ivlev (2009). In such systems, it is indeed possible to obtain complete information about the state of the whole system of particles in the kinetic -space. This offers an important advantage for the investigation of collective processes occurring in strongly coupled media including melting and recrystallization Schweigert et al. (1998); Melzer et al. (1996a, b); Thomas and Morfill (1996), mass and heat diffusion Nosenko et al. (2008), solitons and shocks Samsonov et al. (2005).
In 2D complex plasmas, as in any strongly coupled 2D system, two in-plane wave modes can be sustained. In crystals, one of these modes is longitudinal, while the other is transverse, with both having an acoustic dispersion Qiao and Hyde (2003). Since the strength of the vertical confinement due to the sheath electric field is finite, there is a third fundamental wave mode with negative optical dispersion associated with the out-of-plane oscillations Liu et al. (2003a); Couëdel et al. (2009). The propagation of dust-lattice (DL) waves in these 2D lattices is often used as a diagnostic tool to determine parameters of the plasma crystal since the wave dispersion depends directly on them Nunomura et al. (2002, 2000, 2003, 2005).
In the sheath of a cc-rf discharge, the ion stream coming from the bulk plasma and directed toward the electrode is focused downstream of each negatively charged particle of the monolayer and creates a perturbed region called the “ion (or plasma) wake”. Ion wakes exert an attractive force on the neighboring particles. They can thus be considered as an (external) “third body” in the interparticle interaction resulting in non-reciprocal particle pair interactions Ishihara and Vladimirov (1997); Nunomura et al. (1999); Melzer et al. (2000b); Hebner and Riley (2004). Under certain conditions, this can lead to the formation of an unstable hybrid mode and the melting of the crystalline monolayer when the out-of-plane mode crosses the in-plane compressional mode: the mode coupling instability (MCI) Ivlev and Morfill (2000); Zhdanov et al. (2009); Couëdel et al. (2011); Ivlev et al. (2014); Röcker et al. (2014). The hybrid mode has clear fingerprints: critical angular dependence, a mixed polarization, distinct thresholds Couëdel et al. (2011), and synchronization of the particle motion Couëdel et al. (2014).
Wake-induced mode coupling is also possible in liquid complex plasma monolayers Ivlev et al. (2014). Remarkably, in such cases, the confinement and dust particle density thresholds, which are important features of the MCI in 2D complex plasma crystals, disappear and the instability has a higher growth rate. Consequently, conditions exist for which both the crystalline and the fluid states are viable, meaning no crossing of the modes in the crystal state and MCI growth rate high enough in the fluid state to prevent crystallization. This explains why, in many experiments, the crystallization of a monolayer is achieved only by increasing the gas pressure and/or the rf power (confinement strength is an increasing function of the discharge power Steinberg et al. (2001)). In addition, it is in principle possible to trigger sporadic melting of a stable crystal which is not too far from the crystalline MCI threshold by applying a sufficiently strong mechanical perturbation.
In this article, we demonstrate experimentally that wake-mediated resonant mode coupling can be induced in a principally stable 2D plasma crystal (no crossing of the modes) levitating in the sheath of a cc-rf discharge through an external excitation mechanism. Localized laser stimulation of the monolayer can trigger MCI-induced melting of the stable crystal if the injected energy is sufficient to create a melted spot in which the excess energy due to the fluid MCI is high enough to overcome neutral damping and heat conduction in the rest of the crystal. This causes a further increase in temperature leading to the extension of the melted area over the whole monolayer in a kind of uncontrolled positive feedback. This “explosive behavior” exhibits similarities with impulsive spot heating and thermal runaway in ordinary matter.
II Experimental setup
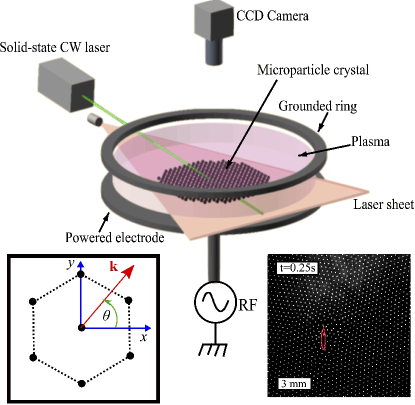
The experiments were carried out in a cc-rf glow discharge at 13.56 MHz (modified GEC chamber). A sketch of the setup is presented in Fig. 1. The argon pressure was between 0.6 Pa and 1 Pa, and the forward rf power was between 10 W and 20 W. In the bulk discharge, the electron temperature was eV and the electron density was cm-3 at 0.66 Pa and =20 W Nosenko et al. (2009). Melamine-formaldehyde spherical particles with a diameter of m were levitated in the plasma sheath above the lower rf electrode and formed a horizontal monolayer, up to 60 mm in diameter. The dust particle suspension was illuminated by a horizontal laser sheet. The particles were imaged through a window at the top of the chamber by a 4 Megapixel Photron FASTCAM Mini WX100 camera at a speed of 250 frames per second. The particle horizontal coordinates, and , and velocities, and , were then extracted with sub-pixel resolution in each frame. An additional side-view camera (Basler Ace ACA640-100GM) was used to confirm that we were indeed working with a single layer of particles. More details can be found in previous publications Couëdel et al. (2011, 2012); Röcker et al. (2014).
A SpectraPhysics Millennia PRO 15sJ solid-state 532-nm laser with a continuous-wave (cw) output power of 0.30-2 W was focused for a short period of time on the crystal. Particles in the laser spot were accelerated and the crystal was melted locally. At the crystal surface, the laser spot had an elliptical shape with its major axis in the direction of propagation and the illuminated area was mm2. The duration of the laser pulse was varied from 0.05 s to 0.65 s.
III Results
III.1 Characterization of the stable crystal
Prior to laser excitation, a stable 2D crystal with respect to the mode coupling instability (no crossing of the eigenmodes Couëdel et al. (2011)) was levitated above the rf electrode. In the set of experiments presented in this article, the following discharge conditions were chosen: Pa and W. For each run, the same microparticles were used and, in case of melting induced by the laser excitation, the monolayer was recrystallized by increasing argon pressure and rf power. The discharge conditions were then restored to the chosen values and the crystalline monolayer was allowed to relax a few minutes before the next laser pulse.
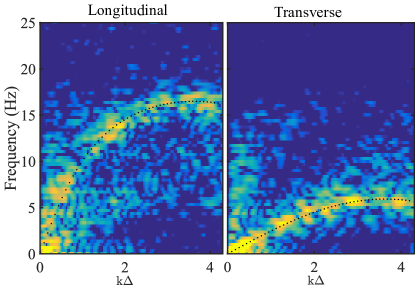
From the particle positions, the mean interparticle distance m (number density cm-2) was obtained by calculating the pair correlation function and measuring the position of the first peak. Using particle velocities, the in-plane compressional and shear particle current fluctuation spectra of the crystalline monolayer were computed. In Fig. 2, the spectra are shown for a propagation angle (see inset of Fig. 1). No fingerprints of the unstable hybrid mode could be detected and only the eigenmodes were present. By fitting simultaneously the in-plane compressional and shear current fluctuation spectra by the theoretical curves of a 2D Yukawa crystal Zhdanov et al. (2009), the microparticle charge , where is the elementary charge, the screening length m and the screening parameter were obtained. The vertical confinement frequency was Hz which is in perfect agreement with a crystal far from the MCI threshold.
III.2 Propagation of the melting front: a threshold behavior
| Exp. | , | ||||
|---|---|---|---|---|---|
| # | (W) | (s) | (keV) | (keV) | (s) |
| 1 | 0.3 | 0.50 | 6.220.5 | 3.10.1 | - |
| 2 | 0.35 | 0.50 | 7.650.5 | 3.60.1 | - |
| 3 | 0.40 | 0.50 | 11.31.0 | 4.80.2 | - |
| 4 | 0.45 | 0.50 | 13.01.4 | 7.70.5 | - |
| 5 | 0.50 | 0.50 | 18.22.0 | 8.30.2 | - |
| 6 | 0.55 | 0.50 | 23.02.1 | 14.60.5 | - |
| 7 | 0.60 | 0.50 | 21.93.0 | 15.80.2 | - |
| 8 | 0.65 | 0.50 | 25.51.5 | 21.00.4 | 0.590.03 |
| 9 | 0.70 | 0.50 | 28.52.4 | 20.91.2 | - |
| 10 | 0.75 | 0.50 | 33.13.5 | 23.01.0 | - |
| 11 | 0.80 | 0.50 | 40.11.3 | 37.11.1 | 0.950.03 |
| 12 | 0.85 | 0.30 | 14.41.3 | 9.70.4 | - |
| 13 | 0.85 | 0.40 | 42.83.5 | 30.70.6 | 0.530.02 |
| 14 | 0.85 | 0.50 | 48.14.1 | 45.70.7 | 0.920.02 |
| 15 | 0.85 | 0.50 | 34.31.1 | 37.10.5 | 1.860.03 |
| 16 | 0.85 | 0.50 | 43.43.2 | 35.01.5 | 2.600.10 |
| 17 | 0.85 | 0.55 | 43.32.7 | 40.91.1 | 0.870.04 |
| 18 | 0.85 | 0.55 | 52.42.1 | 63.01.8 | 1.260.01 |
| 19 | 0.85 | 0.55 | 42.63.9 | 40.01.3 | 3.130.03 |
| 20 | 0.85 | 0.55 | 49.91.9 | 51.91.2 | 0.970.01 |
| 21 | 0.85 | 0.60 | 60.61.3 | 62.21.2 | 1.210.01 |
| 22 | 0.85 | 0.65 | 64.114.3 | 58.310.2 | 1.210.01 |
| 23 | 2.00 | 0.05 | 12.07.4 | 8.00.2 | - |
| 24 | 2.00 | 0.20 | 40.93.6 | 41.02.0 | 1.230.01 |
The laser beam was focused on the crystal so that only a few particles were accelerated during the pulse (). It created, at a few in front of the laser spot position in the direction of laser light propagation, a small melted spot ( mm in diameter) containing particles having high velocities. Depending on the pulse duration and the laser power, the melted area recrystallized or expanded over the whole crystalline monolayer. By tracking the particles during and after the laser pulse, the evolution of the particle kinetic energies was measured, and the energy injected by the laser into the crystal was estimated. At the end of the laser pulse, the total kinetic energy of the particles in the camera field of view (FoV) was at its maximum. However, the particles in the melted spot had trajectories directed along the direction of the laser beam. By looking at the first and second moments of the velocity distribution function in and , thermalization due to collisions with other particles was completed after s (similar Maxwellian velocity distribution centered on 0 in and 111 slightly depends on the laser pulse duration and the laser power; the chosen corresponds to the value at which the microparticles are thermalized in all experiments.).
In Table 1, the sum of the kinetic energies of the particles (total energy) in the camera FoV at the end of the laser pulse () and after thermalization () are listed for the different runs. As expected, at a given laser power, the total energy increased with the pulse duration. The energy after thermalization was slightly smaller due to damping by the neutral background and heat transport in the whole crystalline suspension (which was not entirely comprised in the FoV). Before the laser pulse, the average kinetic temperature of the particles was estimated at eV, giving a total energy in the field of view eV. Thus the measured total energy just after the laser pulse corresponds roughly to the energy injected by the pulse into the crystal since it was always much higher than a few keV.
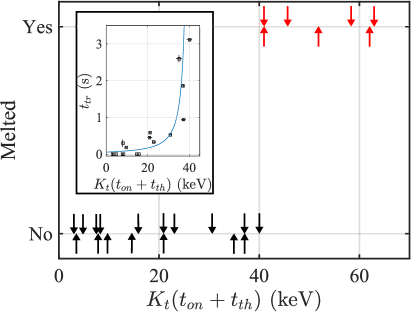
In Fig. 3, the state of the monolayer at the end of the experiment (recrystallized or fully melted) is plotted as a function of the total energy after thermalization. As can be seen, when reached keV (corresponding to ms at W), the crystalline monolayer fully melted. The observed step function is a clear sign of a threshold phenomenon.
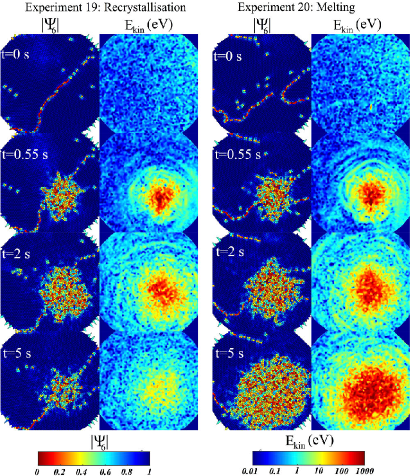
In Figs. 4 and 5, we illustrate the difference between two experiments showing either recrystallization or melting (Exps. 19 and 20, respectively; see Table 1). In Fig. 4, the monolayer Voronoi map (colored according to ) and the kinetic energy map are presented for two experiments using the same laser pulse setting. Here, , where is the number of closest neighbors and is the angle of vector linking the th to the th particle with respect to the -axis. This order parameter represents the deformation of a hexagonal cell from a perfect hexagon (). As can be seen, before the laser pulse ( s), the crystalline monolayer was cold in both cases with eV and the crystals were almost perfect with only a few dislocations and a few grain boundaries. At the end of the laser pulse ( s), a melted spot (high kinetic energy and low values of ) could be seen in the center of the frame. In both cases, compressional waves traveled preferentially in the direction of the laser beam (positive direction) due to the non-thermalized motion of the excited particles. At s , the particles were thermalized and compressional waves emerged from the hot spot isotropically. It was observed that, in both cases, the melted spot became slightly larger than at s due to heat transport in the crystalline monolayer. However, the spot in experiment 20 showed a slightly larger melted spot and the particle kinetic energies were slightly higher.
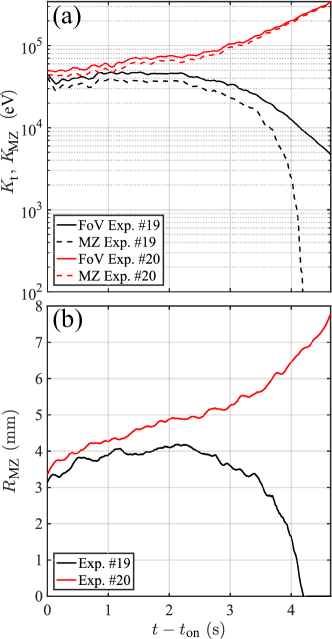
This observation is confirmed in Fig. 5, in which the time evolution (after the laser pulse) of the radius of the melted zone (MZ) and the evolution of the total kinetic energy in the MZ and the camera FoV are plotted. In this article, the MZ is defined as the area in which the mean kinetic energy is greater than 30 eV 222For the measured crystal parameters, the melting occurs when the microparticle mean kinetic energy is around 10-20 eV Hartmann et al. (2005); Kryuchkov et al. (2017). It slightly underestimates the size of the MZ but catches the main features of its evolution without including particles in the crystalline state. As can be seen in both experiments, most of the kinetic energy in the FoV is carried by the particles in the MZ, though in experiment 19, the injected energy and the radius of the MZ were slightly smaller. In both cases the kinetic energy and MZ radius initially increased, but in experiment 19 the total energy inside the MZ became stable, meaning that the kinetic energy began to decrease. On the contrary, continued to grow in the case of experiment 20. After s, the MZ started to shrink in experiment 19 and the total energy started to decrease while both parameters kept growing in the case of experiment 20 (the energy growth seemed exponential). Finally, in the case of experiment 19, after s, the total energy exhibited an exponential decay while the MZ was rapidly shrinking, denoting recrystallization. In experiment 20, the energy kept growing and the MZ eventually extended to the whole monolayer. After 3.5 s, the radius of the MZ grew quasi linearly with a velocity mm/s. A snapshot of the monolayer during the final stage of both experiments can be seen in Fig. 4 ( s).
Another interesting observation is the existence of a transition period before the recrystallization sets in for injected energy below the melting threshold. For the purpose of analysis, the transition time is defined as the time before exhibits a clear exponential decay after the end of the laser pulse 333In logarithmic scale, is the time at which the straight line with a negative slope fitting the exponential decay of the energy at large crossed the line defined by . In experiment 19, the transition time was 3.13 s (see Fig. 5a). As can be seen in the inset of Fig. 3, the transition time gets longer as the input energy gets closer to the induced-melting energy threshold (experimental values are listed in Table 1). For the experiments with injected energy above the threshold the energy growth looked nearly exponential. In Table 1, the measured growth times are listed 444 is obtained by fitting the following function to the total energy: where is a positive constant. The average measured value was s.
IV Discussion
As reported in the previous section, the laser-induced melting of the crystal exhibited a clear energy threshold: above a well-defined amount of energy injected by the laser, the full melting of the crystalline monolayer was triggered. The mechanism by which the monolayer melted can be understood when taking into account the existence of the MCI in fluid monolayers. It was indeed shown by Ivlev et al. Ivlev et al. (2014) that the wake-induced coupling of wave modes always occurs in 2D fluid complex plasmas and, contrary to MCI onset in 2D complex plasma crystals, there is no confinement-density threshold. This means that for sufficiently low damping rates the energy input from the fluid MCI (i.e. energy transferred by the ion flow to the crystal) can prevent crystallisation of the monolayer. Moreover, if a large enough melted spot is induced in the crystalline monolayer, the energy input from the localized fluid MCI will not be dissipated rapidly enough (through neutral damping and heat conduction in the crystal), causing a further increase in temperature triggering the expansion of the melted area in an uncontrolled positive feedback (thermal runaway). This mechanism will lead to the total destruction of the crystalline monolayer as observed for regular MCI-induced melting of 2D complex plasma crystals Couëdel et al. (2011); Ivlev et al. (2014); Röcker et al. (2014); Williams et al. (2012); Yurchenko et al. (2017). Such an “explosive melting” of a 2D complex plasma crystal has been recently studied in detail by Yurchenko et al. Yurchenko et al. (2017) and was found to be similar to impulsive spot heating and thermal explosion (thermal runaway) in ordinary matter Ivlev et al. (2015).
In the presented experiments, the laser pulse created a localized melted spot in the crystal where the fluid MCI exists. The spatial temperature distribution in a continuous reactive medium, including damping, can be described by the following heat equation Ivlev et al. (2015); Yurchenko et al. (2017)
| (1) |
with the initial condition
| (2) |
where is the energy injected by the laser pulse, is the width of the melted zone, is the heat capacity per particle, is the Epstein damping rate (for our experimental conditions, s-1 Liu et al. (2003b)), and is the thermal diffusivity.
In Eq. (1), the first term in the r.h.s. is the heat input due to the fluid MCI. Since fluid MCI essentially develops when the correlations between the particles are largely destroyed (so that a horizontal layer, uniform and of infinite extent, can be considered Ivlev et al. (2014)), it supposes a significant overheating compared to the melting temperature of a 2D complex plasma crystal ( eV in our condition Hartmann et al. (2005); Kryuchkov et al. (2017)). Consequently, the MCI heat source term requires the introduction of an activation temperature well above . It was indeed demonstrated that pair correlations are destroyed when the monolayer temperature is well above the melting temperature Fortov et al. (2005); Sheridan (2009). Accordingly, the fluid MCI heat source can be roughly modeled as a reaction rate governed by the Arrhenius law
| (3) |
which can be approximated by Yurchenko et al. (2017)
| (4) |
where is the saturated fluid MCI heat source with the fluid MCI growth rate and the saturation temperature keV. In a recent study on the melting front propagation in MCI-induced 2D crystal melting, the activation temperature was found to be eV Yurchenko et al. (2017). The saturation temperature arises from the thermal spreading of the monolayer which inhibits the mode crossing and consequently the fluid MCI growth rate Ivlev et al. (2014).
Since , we can neglect . Eq. (1) can be then written in a dimensionless manner
| (5) |
where , with , with . The initial condition becomes
| (6) |
with . The normalization determines the characteristic length scale. Thus, in its dimensionless form, the problem is characterized by two numbers
| (7) |
and
| (8) |
Eq. (5) is similar to the one describing impulsive spot heating and thermal explosion in ordinary matter with the addition of a dimensionless damping coefficient Ivlev et al. (2015); Yurchenko et al. (2017). When there is no damping and the heating of a reactive medium occurs within a sufficiently localized spot (so it can be accurately described with a Dirac distribution), the subsequent thermal evolution is characterized only by which identifies a bifurcation between two distinct regimes. When exceeding a critical threshold, the heat equation exhibits the explosive solution, i.e., a thermal runaway is triggered. For a 2D system, the critical value is Ivlev et al. (2015). The damping term increases the critical value: numerical estimates are, for example, and . In our experimental conditions, we assume that the thermal diffusivity of the crystal was mms Nosenko et al. (2008) and s-1. By fitting the temperature distribution after laser excitation with a 2D Gaussian for experiments near threshold, the width of the melted zone was mm 555According to Fig. 5, the area defined by includes of the energy, giving which is in agreement with the measured values, which is noticeably smaller than the characteristic length mm. These experimental parameters yield the value of and, at threshold energy, , in remarkable agreement with the theoretical estimate. Note that the width of the MZ has a significant effect on the energy threshold since at a given injected energy a wider spot results in a significant portion of the energy being distributed over particles with a kinetic temperature below the activation temperature. Moreover, for large melted spots (), the problem is no longer characterized by a single dimensionless number and the threshold depends on the temperature of the melted spot and its size Ivlev et al. (2015); Merzhanov (1966).
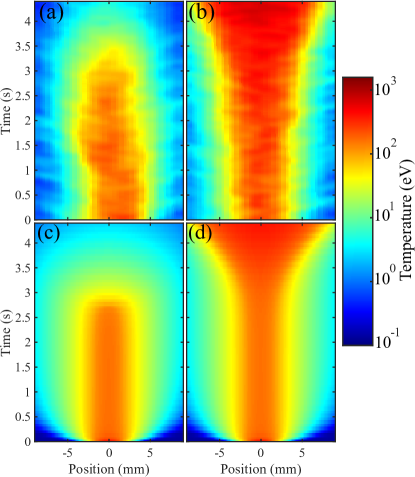
In Fig. 6, the evolution of the temperature profile is presented for experiments 19 and 20 and the numerical solution of Eqs. (1) and (4). The input parameters have been chosen to reproduce qualitatively the experimental observations. As can be seen in all cases, the energy is transported from the MZ to the rest of the crystalline suspension. The instability provided energy to the microparticle suspension inside the fluid region which is partially transported in the crystal through heat conduction and partially dissipated through neutral damping. For these reasons, the size of the melted area can slightly increase even if the total input energy is below the required melting threshold. As reported in the previous section, when increasing the amount of injected energy while staying below threshold (for example, increasing the duration of the laser pulse), the crystallization is delayed. This behavior was also observed in the numerical solutions and can be explained by the amount of energy pumped by the fluid MCI into the melted spot which depends directly on its size. Indeed, crystallization can occur only after enough energy has been removed from the MZ. Consequently, this suppresses the fluid MCI heat flux (Fig. 6a and c). This transition period is longer for larger spots since a significantly larger amount of energy has to be removed due to the fluid MCI energy input. When the injected energy is slightly above the threshold, fluid MCI delivers more energy to the monolayer than what can be extracted away from the MZ which grows as a result (Fig. 6b and d). The melting pattern is then similar to the one observed in the regular (crystal) MCI induced melting of a crystal Couëdel et al. (2011); Ivlev et al. (2014); Röcker et al. (2014); Zhdanov et al. (2009); Yurchenko et al. (2017).
In all experiments in which the melting was successfully induced, the MZ radius grew at a constant velocity. For large enough in Eq. (5), the last term of the r.h.s. tends asymptotically towards , reducing the problem to one dimension. The reaction model (3) or (4) in the evolution equation (1) defines a bistable system, with two uniform stationary solutions (in the reduced version with and the rate equation (4), these states are 0 and ). With inhomogeneous boundary conditions, the front profile is a heteroclinic connection between these two states, propagating at constant velocity . As the MZ radius grows linearly, a self-similar solution , with , where is the dimensionless velocity of the melting front, can be obtained analytically using the approximation (4) Yurchenko et al. (2017)
| (9) |
with and . The boundary conditions are and . The position of the melting front is given by and its velocity is . It exists only if the two partial derivatives are continuous, giving the condition
| (10) |
The velocity of the melting front is then straightforwardly obtained
| (11) |
For (viz. ), the front velocity is positive, which corresponds to the melting of the monolayer, due to the fact that the final temperature is further away from the threshold than the cold crystal is (). For (viz. ), the front velocity is negative, corresponding to recrystallization due to the fact that the melted state equilibrium temperature is closer to the activation threshold than the cold crystal is. The case is the bifurcation case, for which the front would be stationary. It would be interesting to further investigate this range, recalling that model (4) is very crude and does not yield accurate values for the actual front velocity, though being qualitatively relevant. Under our experimental conditions, or mm/s, which is in agreement with our measured value. This velocity yields the spatial decay exponents for the front, and . The slope of the front and the temperature difference yield an estimate for its width. Given the experimental ranges of and , the front width is or in physical units mm. This value is close to the one observed in Figs. 4 and 6.
Finally, in the frame of our model, the evolution of the total kinetic energy in the monolayer can be obtained
| (12) |
Multiplying Eq. (1) by and integrating over space, one obtains
| (13) |
where the heat source due to the fluid mode-coupling instability is (using the reaction model (4))
| (14) | |||||
where is the front radius, such that . The solution of Eq. (13) is trivial and one immediately sees that, in the limit , . This result cannot be confirmed at the present time by experimental observations since the video recordings of the laser-induced melting were not long enough. In addition, using the reaction model (4), the stage of exponential growth reported in the experiments is lost. It has indeed been reported that, during MCI-induced melting in crystals, the microparticles kinetic temperature in the MZ grows exponentially until it saturates Röcker et al. (2014). Moreover, in the present study, the total kinetic energy growth in the FoV seems to be nearly exponential (even though the videos were not long enough to recover the kinetic energy evolution over a significant energy interval to draw a firm conclusion). However, using the reaction model (3), the stage of exponential growth can be recovered. Indeed, the “source term” in (5) is
| (15) |
For (which is always the case for ), the source term has two nonzero real roots: the unstable one and the stable one where is the branch of the Lambert W function. The maximum of occurs at such that . Since , the stage of exponential growth can be explained by the lower, unstable root. In the early stage of the instability, the dimensionless heat equation can be approximated by
| (16) |
Given the experimental ranges of and , the unstable root is and the instability growth rate is . Using our experimental parameters, the time scale is s giving a growth rate . This range slightly overestimates the reported experimental value but, given the simplicity of our reaction rate model, it is in remarkable agreement. It nevertheless calls for more investigations and better modeling of the fluid MCI heat source in order to obtain the full physical picture of the energy input due to the fluid MCI.
V Conclusion
To conclude, we have experimentally demonstrated that wake-mediated resonant mode coupling can be induced in a 2D plasma crystal through a localized laser heating. This heating can trigger a thermal runaway resulting in the full melting of the crystalline monolayer. In a stable crystal (with respect to crystalline MCI), an energy threshold was observed. Below the threshold, recrystallization was always observed with a transition period which grew longer when approaching the threshold. The localized fluid MCI could not pump enough energy to the microparticle suspension to maintain the fluid state and propagate through the crystal. Above the threshold, the full melting of the crystal was observed due to the activated fluid MCI (i.e. the crystalline order of the whole complex plasma monolayer was rapidly destroyed). Remarkable similarities with impulsive spot heating and thermal runaway in ordinary reactive matter were reported.
In future investigations, detailed studies of the threshold for various crystal parameters and laser spot sizes will be performed. The influence of the temperature of the fluid state on the MCI growth rate will be of particular interest.
Acknowledgements.
This work was partially supported by the French-German PHC PROCOPE Program (Project No. 35325NA/57211784). The authors would like to thank Prof. E. Thomas Jr and Dr I. Laut for fruitful discussions and suggestions.References
- Bouchoule (1999) A. Bouchoule, Dusty Plasmas: Physics, Chemistry and Technological impacts in Plasma Processing (Wiley, New York, 1999).
- Shukla and Mamun (2002) P. K. Shukla and A. A. Mamun, Introduction to dusty plasma (IOP Publishing, Bristol, 2002).
- Morfill and Ivlev (2009) G. E. Morfill and A. V. Ivlev, Rev. Mod. Phys. 81, 1353 (2009).
- Brattli and Havnes (1996) A. Brattli and O. Havnes, Journal of Vacuum Science & Technology A 14, 644 (1996).
- Samarian and James (2001) A. A. Samarian and B. W. James, Phys. Lett. A 287, 125 (2001).
- Dubin (2000) D. H. E. Dubin, Phys. Plasmas 7, 3895 (2000).
- Melzer et al. (2000a) A. Melzer, S. Nunomura, D. Samsonov, Z. W. Ma, and J. Goree, Phys. Rev. E 62, 4162 (2000a).
- Nunomura et al. (2000) S. Nunomura, D. Samsonov, and J. Goree, Phys. Rev. Lett. 84, 5141 (2000).
- Samsonov et al. (2000) D. Samsonov, J. Goree, H. M. Thomas, and G. E. Morfill, Phys. Rev. E 61, 5557 (2000).
- Chu and I (1994) J. H. Chu and L. I, Phys. Rev. Lett. 72, 4009 (1994).
- Thomas et al. (1994) H. Thomas, G. E. Morfill, V. Demmel, J. Goree, B. Feuerbacher, and D. Möhlmann, Phys. Rev. Lett. 73, 652 (1994).
- Schweigert et al. (1998) V. A. Schweigert, I. V. Schweigert, A. Melzer, A. Homann, and A. Piel, Phys. Rev. Lett. 80, 5345 (1998).
- Melzer et al. (1996a) A. Melzer, A. Homann, and A. Piel, Phys. Rev. E 53, 2757 (1996a).
- Melzer et al. (1996b) A. Melzer, V. A. Schweigert, I. V. Schweigert, A. Homann, S. Peters, and A. Piel, Phys. Rev. E 54, R46 (1996b).
- Thomas and Morfill (1996) H. M. Thomas and G. E. Morfill, Nature 379, 806 (1996).
- Nosenko et al. (2008) V. Nosenko, S. Zhdanov, A. V. Ivlev, G. Morfill, J. Goree, and A. Piel, Phys. Rev. Lett. 100, 025003 (2008).
- Samsonov et al. (2005) D. Samsonov, S. Zhdanov, and G. Morfill, Physical Review E (Statistical, Nonlinear, and Soft Matter Physics) 71, 026410 (2005).
- Qiao and Hyde (2003) K. Qiao and T. W. Hyde, Phys. Rev. E 68, 046403 (2003).
- Liu et al. (2003a) B. Liu, K. Avinash, and J. Goree, Phys. Rev. Lett. 91, 255003 (2003a).
- Couëdel et al. (2009) L. Couëdel, V. Nosenko, S. K. Zhdanov, A. V. Ivlev, H. M. Thomas, and G. E. Morfill, Physical Review Letters 103, 215001 (2009).
- Nunomura et al. (2002) S. Nunomura, J. Goree, S. Hu, X. Wang, A. Bhattacharjee, and K. Avinash, Phys. Rev. Lett. 89, 035001 (2002).
- Nunomura et al. (2003) S. Nunomura, S. Zhdanov, G. E. Morfill, and J. Goree, Phys. Rev. E 68, 026407 (2003).
- Nunomura et al. (2005) S. Nunomura, S. Zhdanov, D. Samsonov, and G. Morfill, Phys. Rev. Lett. 94, 045001 (2005).
- Ishihara and Vladimirov (1997) O. Ishihara and S. V. Vladimirov, Physics of Plasmas 4, 69 (1997).
- Nunomura et al. (1999) S. Nunomura, T. Misawa, N. Ohno, and S. Takamura, Phys. Rev. Lett. 83, 1970 (1999).
- Melzer et al. (2000b) A. Melzer, V. A. Schweigert, and A. Piel, Physica Scripta 61, 494 (2000b).
- Hebner and Riley (2004) G. A. Hebner and M. E. Riley, Phys. Rev. E 69, 026405 (2004).
- Ivlev and Morfill (2000) A. V. Ivlev and G. Morfill, Phys. Rev. E 63, 016409 (2000).
- Zhdanov et al. (2009) S. K. Zhdanov, A. V. Ivlev, and G. E. Morfill, Phys. Plasmas 16, 083706 (2009).
- Couëdel et al. (2011) L. Couëdel, S. K. Zhdanov, A. V. Ivlev, V. Nosenko, H. M. Thomas, and G. E. Morfill, Phys. Plasmas 18, 083707 (2011).
- Ivlev et al. (2014) A. V. Ivlev, S. K. Zhdanov, M. Lampe, and G. E. Morfill, Phys. Rev. Lett. 113, 135002 (2014).
- Röcker et al. (2014) T. B. Röcker, L. Couëdel, S. K. Zhdanov, V. Nosenko, A. V. Ivlev, H. M. Thomas, and G. E. Morfill, EPL (Europhysics Letters) 106, 45001 (2014).
- Couëdel et al. (2014) L. Couëdel, S. Zhdanov, V. Nosenko, A. V. Ivlev, H. M. Thomas, and G. E. Morfill, Phys. Rev. E 89, 053108 (2014).
- Steinberg et al. (2001) V. Steinberg, R. Sütterlin, A. V. Ivlev, and G. Morfill, Phys. Rev. Lett. 86, 4540 (2001).
- Nosenko et al. (2009) V. Nosenko, A. V. Ivlev, S. K. Zhdanov, M. Fink, and G. E. Morfill, Physics of Plasmas 16, 083708 (2009).
- Couëdel et al. (2012) L. Couëdel, D. Samsonov, C. Durniak, S. Zhdanov, H. M. Thomas, G. E. Morfill, and C. Arnas, Phys. Rev. Lett. 109, 175001 (2012).
- Note (1) slightly depends on the laser pulse duration and the laser power; the chosen corresponds to the value at which the microparticles are thermalized in all experiments.
- Note (2) For the measured crystal parameters, the melting occurs when the microparticle mean kinetic energy is around 10-20 eV Hartmann et al. (2005); Kryuchkov et al. (2017). It slightly underestimates the size of the MZ but catches the main features of its evolution without including particles in the crystalline state.
- Note (3) In logarithmic scale, is the time at which the straight line with a negative slope fitting the exponential decay of the energy at large crossed the line defined by .
- Note (4) is obtained by fitting the following function to the total energy: where is a positive constant.
- Williams et al. (2012) J. D. Williams, E. Thomas, L. Couëdel, A. V. Ivlev, S. K. Zhdanov, V. Nosenko, H. M. Thomas, and G. E. Morfill, Phys. Rev. E 86, 046401 (2012).
- Yurchenko et al. (2017) S. O. Yurchenko, E. V. Yakovlev, L. Couëdel, N. P. Kryuchkov, A. M. Lipaev, V. N. Naumkin, A. Y. Kislov, P. V. Ovcharov, K. I. Zaytsev, E. V. Vorob’ev, G. E. Morfill, and A. V. Ivlev, Phys. Rev. E 96, 043201 (2017).
- Ivlev et al. (2015) A. Ivlev, T. Röcker, A. Vasyunin, and P. Caselli, The Astrophysical Journal 805, 59 (2015).
- Liu et al. (2003b) B. Liu, J. Goree, V. Nosenko, and L. Boufendi, Phys. Plasmas 10, 9 (2003b).
- Hartmann et al. (2005) P. Hartmann, G. J. Kalman, Z. Donkó, and K. Kutasi, Phys. Rev. E 72, 026409 (2005).
- Kryuchkov et al. (2017) N. P. Kryuchkov, S. A. Khrapak, and S. O. Yurchenko, J. Chem. Phys. 146, 134702 (2017).
- Fortov et al. (2005) V. E. Fortov, O. S. Vaulina, and O. F. Petrov, Plasma physics and controlled fusion 47, B551 (2005).
- Sheridan (2009) T. E. Sheridan, Physics of Plasmas 16, 083705 (2009).
- Note (5) According to Fig. 5, the area defined by includes of the energy, giving which is in agreement with the measured values.
- Merzhanov (1966) A. Merzhanov, Combustion and Flame 10, 341 (1966).