Symbol detection in online handwritten graphics
using Faster R-CNN
Abstract
Symbol detection techniques in online handwritten graphics (e.g. diagrams and mathematical expressions) consist of methods specifically designed for a single graphic type. In this work, we evaluate the Faster R-CNN object detection algorithm as a general method for detection of symbols in handwritten graphics. We evaluate different configurations of the Faster R-CNN method, and point out issues relative to the handwritten nature of the data. Considering the online recognition context, we evaluate efficiency and accuracy trade-offs of using Deep Neural Networks of different complexities as feature extractors. We evaluate the method on publicly available flowchart and mathematical expression (CROHME-2016) datasets. Results show that Faster R-CNN can be effectively used on both datasets, enabling the possibility of developing general methods for symbol detection, and furthermore, general graphic understanding methods that could be built on top of the algorithm.
Index Terms:
Handwriting recognition; symbol recognition; object detection; Faster R-CNN.I Introduction
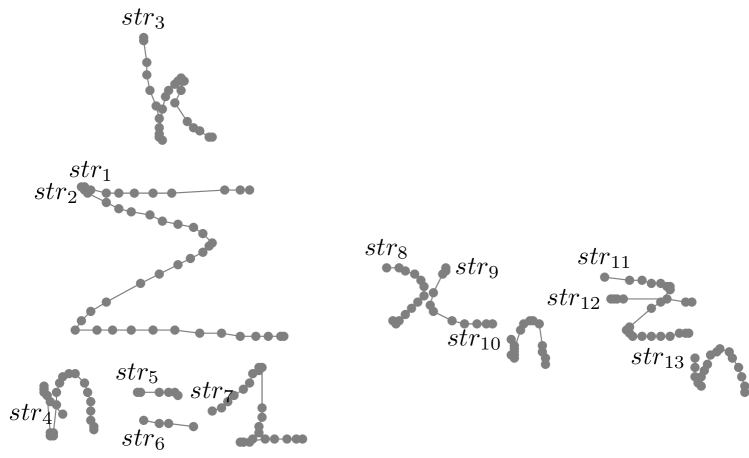
An online handwritten graphic is composed of a set of strokes, where each stroke consists of a set of bidimensional coordinates. The coordinates can be captured, for example, using a device with touch screen and an electronic pen. A symbol consists of a subset of strokes. In these data, in contrast to text, symbols might be placed over vertical or diagonal positions relative to each other. Figure 1 shows an online handwritten mathematical expression example.
Typical symbol detection techniques for online handwritten graphics include stroke grouping and classification processes. The first process selects groups of strokes that are likely to form symbols, and the second applies machine learning methods to classify the stroke groups as symbols, with their corresponding symbol classes, or as false positives. Due to the variance of the placement of symbols, virtually any group of strokes might form a symbol. To avoid the computational complexity of evaluating all possible stroke groups, constraints based on handcrafted rules (e.g. only selecting stroke groups of up to four strokes) are applied. Such constraints do not only limit the accuracy of the methods, but also make difficult the application of a same method to the recognition of different graphic types.
Taking advantage of deep convolutional neural networks (DCNNs), recent algorithms for object detection have obtained outstanding accuracy. Among the different methods, Faster R-CNN has shown to obtain state-of-the-art accuracy and efficiency [1]. Also, Faster R-CNN models are general enough to be applied to a large variety of problems as they can be trained end-to-end using input-output examples.
By converting raw online graphics data to offline (i.e. images), object detection methods based on DCNNs could also be applied to symbol detection. In this work, we evaluate the Faster R-CNN algorithm to detect symbols in handwritten graphics. We make a parallel between traditional symbol detection methods in online data and our methods (Section II). We then describe our pipeline to transform online data to offline, and give an overview of the Faster R-CNN algorithm (Section III). Through experimentation in the detection of symbols in mathematical expressions and flowcharts (Section IV), we show that the Faster R-CNN algorithm provides high accuracy on both problems. Results are encouraging not only for the development of general methods for symbol detection, but also for the development of methods for structure recognition (Section V). The code implemented in this work is available as open source.
II Related work
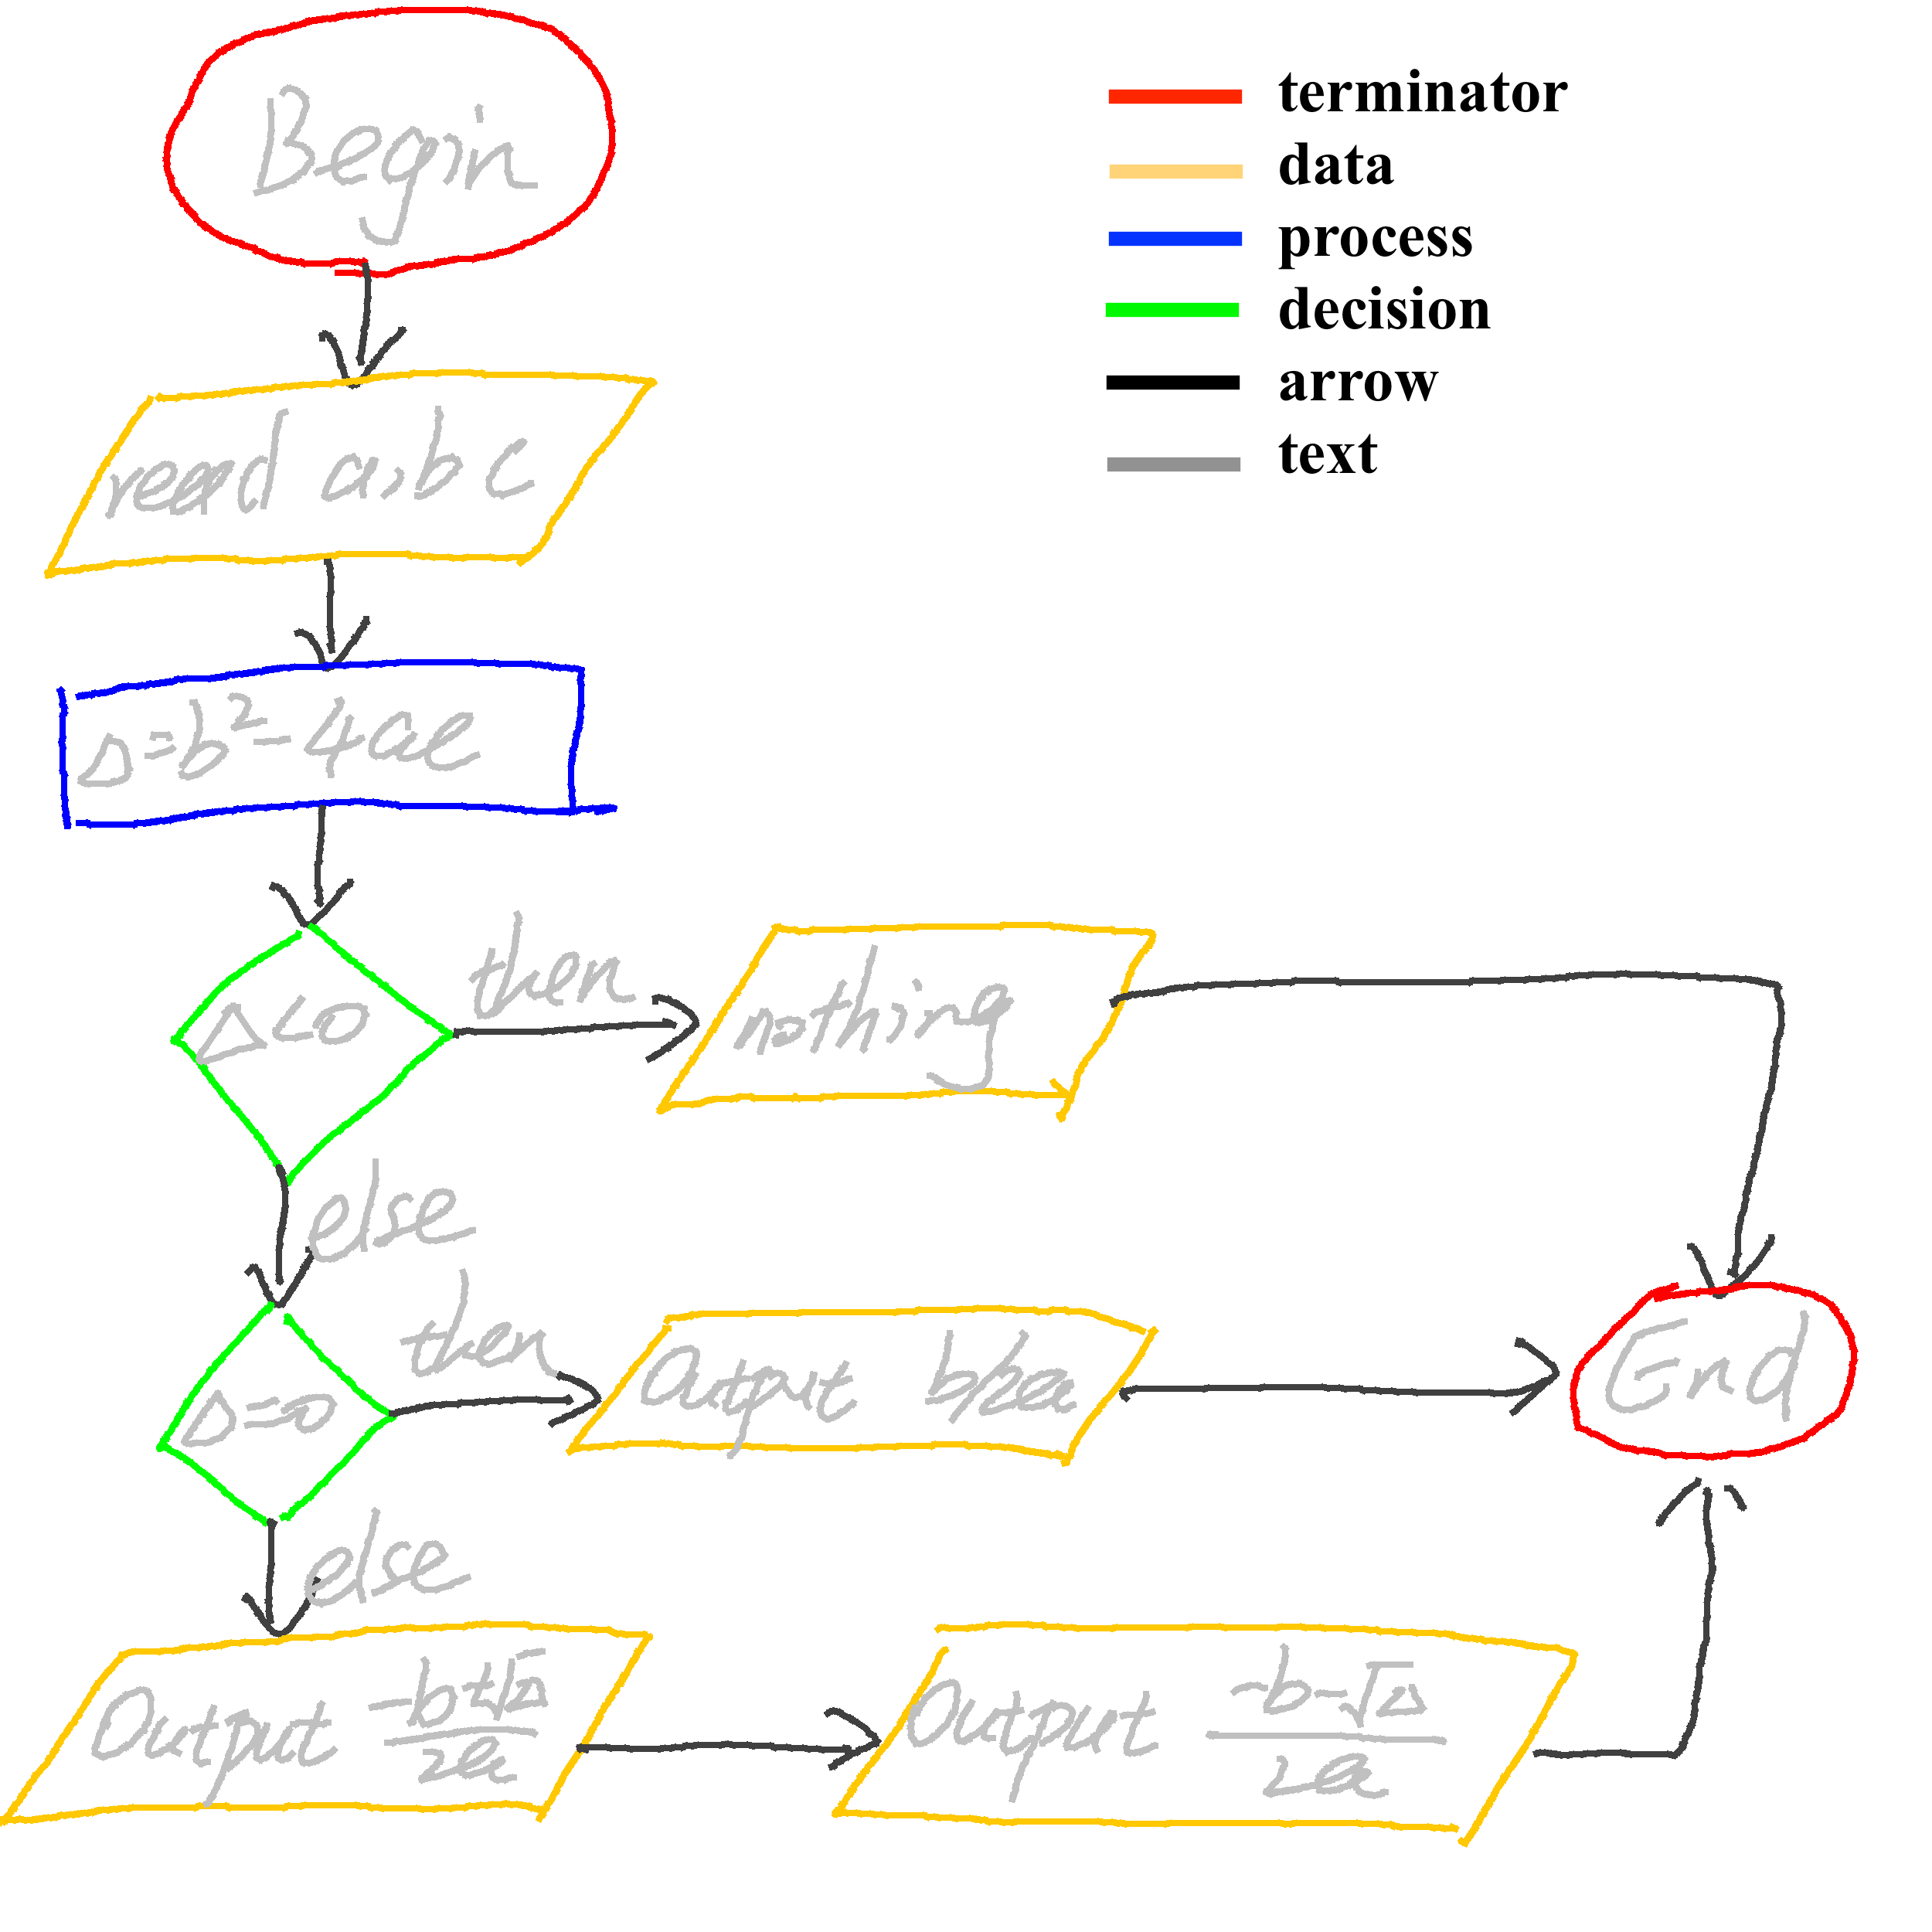
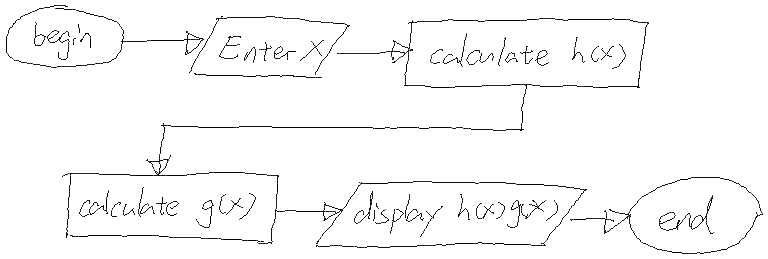
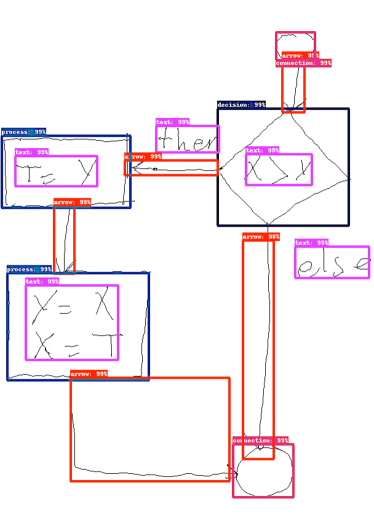
We can find a variety of techniques for detecting symbols in online handwritten graphics. Most techniques introduce constraints based on some characteristics of the graphic type. For instance, in mathematical expression recognition, stroke grouping is often done considering only groups of strokes that have up to four or five strokes [2, 3, 4]. Other common constraints include the assumption that symbols are formed only by strokes consecutive in input time order [5, 6], or strokes that intersect each other [7]. In the recognition of other graphic types, as diagrams, different techniques are designed to detect specific symbol classes [8, 9, 10]. For instance, Bresler et. al. [9] separate the detection of symbols that do not have an specific shape, as text and arrows, from symbols that have well defined shapes, as decision and data [9] (flowchart symbol examples are shown in Figure 2).
Recent works on object detection are mainly based on DCNNs [1]. At a high level, several of those techniques (e.g. [11, 12, 13, 14]) consist of three processes: feature maps generation using a DCNN, selection of object bounding box candidates, and the classification of the bounding box candidates using the feature maps (cropped according to the box dimensions). One of the algorithms that implements the above methods is Faster R-CNN. The algorithm has obtained state-of-the-art accuracy [1] and has the advantage of doing the three processes through a single forward pass of a network.
While methods for symbol detection in online data are usually evaluated at stroke level [15], detection methods are evaluated at bounding box level (e.g. using mean average precision [16]). The evaluating metrics are then not directly comparable.
Although it could be possible to develop algorithms to recover stroke level information from the offline data, to the end of graphics understanding, such process might not be necessary. For instance, to recognize flowcharts structure, once symbol candidates have been identified, relations between symbols can be determined using features from the corresponding bounding box regions over an image.
III Methods
Faster R-CNN is a supervised learning algorithm. The algorithm receives as input an image, and generates as output a list of object bounding box coordinates and the corresponding object class per box. Training the algorithm then requires, in addition to the input images, a list of bounding boxes per image. This section gives details about the methods used to generate training data to evaluate the algorithm in the context of graphics recognition, and gives a brief description of the algorithm.
III-A Training data generation
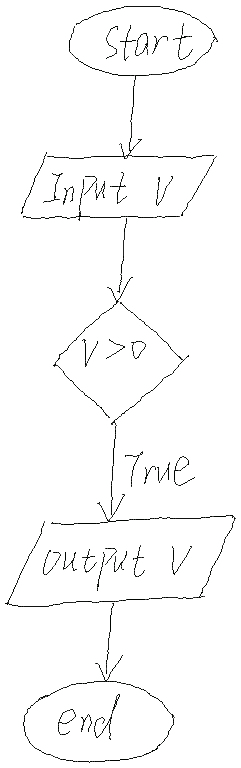
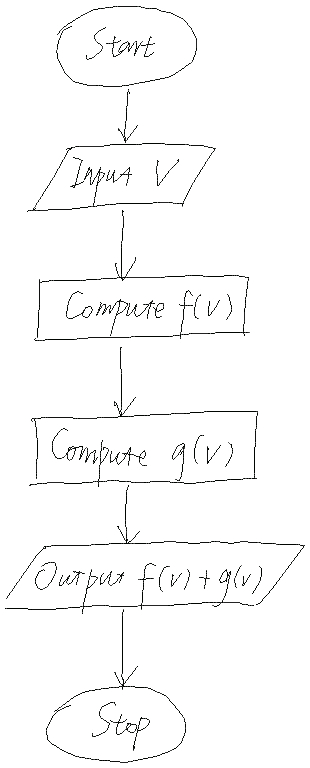
Depending on the input device, the range of the stroke coordinates can have a high variance. In order to deal with such variance, we scale each graphic so that the largest dimension of its bounding box is equal to a fixed parameter (keeping the original aspect ratio). In order to avoid loosing precision, this scaling is done coordinate-wise. Once a graphic is scaled, we draw its traces through linear interpolations between each pair of successive coordinates. The resulting images are gray-scale images, with different aspect ratios (but with their largest dimension equal to ). Figure 3 shows some images generated through this process.
To generate the bounding boxes, we extract the most top-left and bottom-right coordinates of each symbol after applying the scaling process described above. As the bounding box coordinates are measured in terms of pixel units, after scaling, some boxes might end up having zero width or height. In such cases, we update the coordinates so that the boxes have a minimum dimension of three pixels, which is about the width of the drawing traces.
III-B Faster R-CNN
In this section, we describe the main components of the algorithm and highlight parameters of interest regarding our evaluation. A more detailed description can be found in [12].
The algorithm can be seen as a neural network composed of three components: feature extractor, Region Proposal Network (RPN), and region classifier. The first component receives an input image and extracts a feature map, the RPN receives the feature map and generates bounding box coordinates (regions) that might contain an object, and the region classifier classifies the boxes using the features map cropped according to the box coordinates. The whole network can be trained using stochastic gradient descend [1], or using an iterative process (iterations of separated RPN and region classifier training steps) [12].
Next sections give more details about the main components.
III-B1 Feature extractor
The feature extractor is a DCNN, usually without fully connected layers, that maps an input image to a feature map. For instance, in [12] the authors use a VGG-16 [17] network and extract feature maps from the last (13th) convolutional layer. The kind of feature extractors determine a large part of the accuracy and computational cost of the network. For instance, in [1], the authors report that inference time varies from about 100 miliseconds when using small feature extractors (e.g. Inception V2) to almost 1 second when using more complex or deeper DCNNs (e.g. Inception Resnet v2).
The feature extractor allows images with variable width and height, but applies a preprocessing step that consists on scaling the images so that their minimum dimension () is set to a constant value.
III-B2 Region Proposal Network
The regions proposal network is a two layer fully convolutional neural network. The network considers a set of boxes, called anchor boxes, of different aspect ratios and scales. For each feature map position and for each anchor box, the network outputs the probability of the anchor box containing an object. Also, for each anchor box, it calculates the coordinates of the box that contains the object. The network is optimized using a loss function composed of a softmax loss for the probability outputs, and a regression loss for the box coordinates.
An important parameter of the RPN is the number of proposals (bounding boxes) that are sent to the classifier. The larger the number, the higher the probability of finding an object, but also the higher the computational cost (and and so the number of false positives) as each region is later classified by the region classifier. The authors in [12] then apply a non-maximum suppression algorithm to reduce the number of proposals. Experiments have shown that is an adequate number when dealing with the PASCAL VOC 2012 dataset.
III-B3 Region classifier
The proposals generated by the RPN are used to crop the corresponding regions from the features map. The cropped regions are then used as input to a small neural network classifier that determines the class of the object (including a background or false positive class) and a box refinement. Similar to the RPN, this network also uses a softmax and a regression loss for optimization.
IV Experimentation
IV-A Experimental setup
We evaluated the methods in the detection of symbols in online handwritten mathematical expressions and flowcharts. In the first case, we used the CROHME-2016 [15] dataset, and in the second, we used the flowchart dataset proposed in [18]. The CROHME-2016 dataset contains about mathematical expressions, and the flowcharts dataset contains about 400 flowcharts. The datasets contain several challenges for the detection framework. The CROHME-2016 dataset contains a large number of symbol classes (101), including digits, characters, operators (e.g. +, , ). Among all classes, specially difficult ones might be the small symbols (as points and commas), and symbols that have similar shapes (e.g. 1, —, , x, c and C). The flowchart dataset contains seven symbol classes: arrow, text, decision, connection, data, process and terminator. In such dataset, specially difficult ones are texts and arrows, as they do not have a specific shape. For instance, text might consist of a single character, or several words placed over several baselines; arrows might be horizontal, vertical, or curved lines, and extended over a large area of the image. Some examples of both datasets are shown in Section IV-B. The datasets are publicly available.
In both mathematical expression and flowchart datasets, we used a typical training-validation-test split. For the test part, we used the same examples defined by the dataset authors [15, 18]. For the training and validation parts, we randomly selected of the graphics for training and used the rest as validation set.
In our implementations, we used the object detection framework proposed in [1]. As explained in Section III-B, a key component that determines the algorithm efficiency and accuracy is the feature extractor. To measure the impact of feature extractors on handwritten data, we use four DCNNs of different complexities. The considered DCNNs, from the smaller to the largest one, are: Inception V2 [19], Resnet 50 [20], Resnet 101 [20], and Inception Resnet v2 [21]. We run the experiments on a Nvidia GeForce GTX Titan X GPU 12GB card.
To determine adequate hyper parameters, we first experimented with different configurations of the algorithm using Inception V2 (as such networks provide a faster feedback). In such experimentation we used some default parameters from the authors of the algorithm [12], as well as base code from [1]. From that experimentation, we defined the following hyper parameters for all models:
-
•
Generated images size: We set the maximum image dimension () to 768.
-
•
Scaled images size. In flowcharts, we set the minimum image dimension () to 600. In mathematical expressions, we set to 300. Although larger values tend to improve accuracy [1], in mathematical expressions, we have several cases where images have a very large width, but small height. Scaling relative to the height of such images generated images with a resolution larger than the one allowed by the GPU capacity (when training the models with the largest DCNNs).
-
•
Training from pre-trained models. The base code released by [1] includes Faster R-CNN models trained over the MSCOCO dataset. Although our generated images are very different in comparison to the natural images of the MSCOCO dataset, we found that training using the pre-trained models allows for much faster convergence than training from scratch. We then used pre-trained models for the rest of the experiments.
-
•
Number of proposals. Once trained, we evaluated models that extract from 300 (the default value defined in [12]) up to 1000 proposals from the RPN. We did not find considerable improvements when using larger number of proposals. We then fixed the number of proposals to 300.
-
•
Training scheme. We used minibatch training with batch size 1 (due to the variable dimensions of the images). We fixed the number of training steps to for flowcharts and for mathematical expressions.
Additional details about the configuration parameters will be available on the code repository.
We used mean average precision (specifically, mAP@0.5) as evaluation metric [16].
IV-B Results
Flowcharts. Table I shows the detection accuracy of the evaluated models over the validation and test sets. For the validation set, we show the model’s average precision using DCNNs with increasing complexities, with the smallest one on top of the table. We can see a consistent improvement as the feature extractors are deeper. This improvement is mainly due to higher scores in the detection of texts and arrows. For the test set, we show the performance of the best model (Inception resnet v2) considering mAP. We can see that the largest variance in accuracy in comparison to the validation set occurs in the detection of texts and arrows.
| Feature extractor | Average Precision (%) | |||||||
|---|---|---|---|---|---|---|---|---|
| mAP | text | arrow | connection | data | decision | process | terminator | |
| On validation set: | ||||||||
| Inception v2 | 98.6 | 97.3 | 94.7 | 97.9 | 100.0 | 100.0 | 100.0 | 100.0 |
| Resnet 50 | 99.2 | 98.3 | 96.0 | 100.0 | 100.0 | 100.0 | 100.0 | 100.0 |
| Resnet 101 | 99.5 | 99.3 | 97.6 | 99.7 | 100.0 | 100.0 | 100.0 | 100.0 |
| Inception Resnet v2 | 99.6 | 99.4 | 97.9 | 100.0 | 100.0 | 100.0 | 100.0 | 100.0 |
| On test set: | ||||||||
| Inception Resnet v2 | 97.7 | 95.2 | 91.5 | 99.0 | 99.7 | 99.6 | 99.1 | 99.9 |
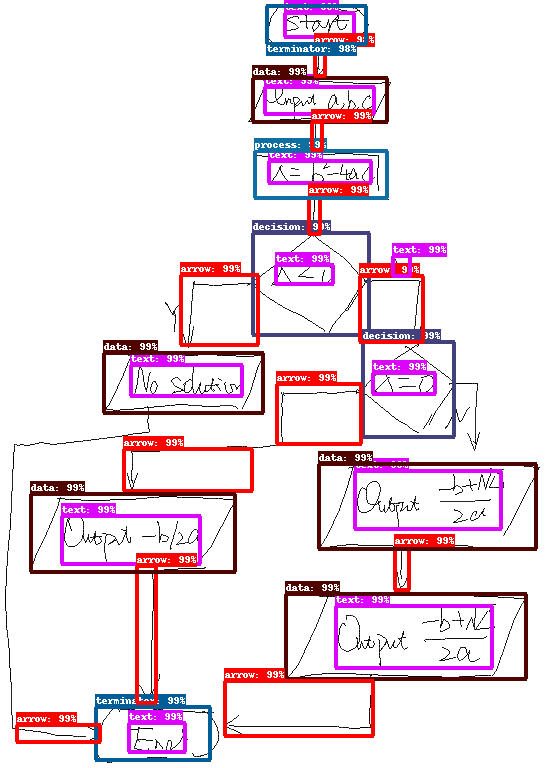
Through visual analysis of the output detections, we found that the most frequent missed symbols are arrows with several curves and small texts. Figure 4 shows two output examples with some miss detection cases.
Mathematical expressions. Table II shows results on the validation and test sets of the CROHME-2016 dataset. We can see higher improvements, in comparison to flowchart results, as the feature extractors are deeper. Also, by analyzing the scores per class, we found that scores for the most frequent classes are considerably higher than the mAP score. In the same table, we illustrate this by showing the scores for the top-10 most frequent classes. These results show that the mAP score is pushed down mainly by the less frequent classes 111Recall that mAP is just the mean of the average precisions per class [16].
| Feature extractor | Average Precision (%) | ||||||||||
|---|---|---|---|---|---|---|---|---|---|---|---|
| mAP | - | 1 | 2 | + | x | ( | ) | = | a | 3 | |
| on validation set: | |||||||||||
| Inception v2 | 83.6 | 84.8 | 80.6 | 97.6 | 98.7 | 95.3 | 95.4 | 97.3 | 98.4 | 97.8 | 97.7 |
| Resnet 50 | 85.4 | 87.5 | 88.5 | 98.2 | 99.3 | 95.9 | 97.3 | 97.9 | 98.7 | 97.9 | 99.0 |
| Resnet 101 | 87.5 | 92.8 | 91.2 | 98.9 | 98.8 | 96.8 | 97.8 | 98.5 | 98.8 | 97.8 | 99.2 |
| Inception resnet v2 | 89.7 | 95.8 | 94.4 | 99.0 | 99.7 | 97.5 | 98.1 | 99.4 | 99.4 | 98.9 | 99.1 |
| On test set: | |||||||||||
| Inception resnet v2 | 86.8 | 96.8 | 92.5 | 99.1 | 99.8 | 98.4 | 99.4 | 99.1 | 99.4 | 95.9 | 99.3 |
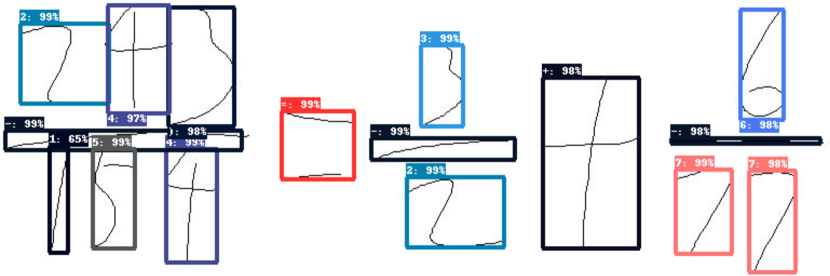
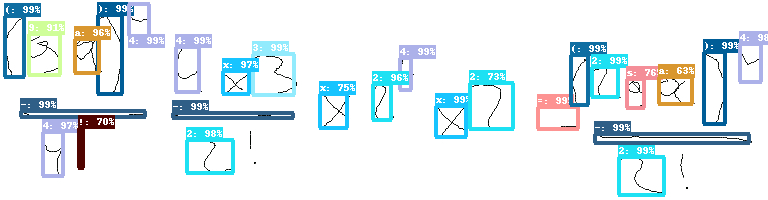
In comparison to flowcharts, mathematical expressions have several symbol types with a really small width or height (e.g. , l, , -, and dot). We found that such symbols are specially difficult to be detected by the models. Such difficulty can also be seen in the results of the most frequent classes in Table II, where the scores of - and are low in comparison to the scores of the other frequent classes. Miss classification between symbols that have similar shape is other frequent type of error of the detector. Figure 5 shows output examples for the best model along with some miss detection cases.

Discussion. It is important to note that although the flowchart training data contains only about examples, the data is enough to achieve high accuracy over all symbol classes. Furthermore, not very deep models, as the Inception v2, already allows us to obtain high mAP scores. The possibility of using effective and small DCNNs enables the use of the method in contexts where computational resources are limited or a fast output is required.
V Conclusions
We showed that the Faster R-CNN algorithm provides effective detection of symbols in online handwritten mathematical expressions and flowcharts. Such results are encouraging in the context of the development of general methods for symbol detection in online handwritten graphics. Furthermore, the integration of the algorithm with structure recognition techniques might also accelerate the development of such techniques.
Our evaluation aimed at measuring and understanding the potential of the Faster R-CNN algorithm and will serve as a baseline for further research. We believe that the algorithm has high potential for improvement through the introduction of online information during the detection pipeline, or by solving ambiguities, e.g. using contextual information, in a postprocessing or structural recognition step.
Acknowledgment
F. D. Julca-Aguilar thanks FAPESP (grant 2016/06020-1). N. S. T. Hirata thanks CNPq (305055/2015-1). This work is supported by FAPESP (grant 2015/17741-9) and CNPq (grant 484572/2013-0).
References
- [1] J. Huang, V. Rathod, C. Sun, M. Zhu, K. A, F. A, I. Fischer, Z. Wojna, Y. Song, S. Guadarrama, and K. Murphy, “Speed/accuracy trade-offs for modern convolutional object detectors,” in Proceedings of the 17th Computer Vision and Pattern Recognition (CVPR), 2017.
- [2] F. Álvaro, J.-A. Sanchez, and J.-M. Benedi, “Offline features for classifying handwritten math symbols with recurrent neural networks,” in 22nd International Conference on Pattern Recognition (ICPR), Aug 2014, pp. 2944–2949.
- [3] F. Julca-Aguilar, C. Viard-Gaudin, H. Mouchère, S. Medjkoune, and N. Hirata, “Integration of shape context and neural networks for symbol recognition,” in Semaine du Document Num rique et de la Recherche d’Information 2014 (SDNRI), 2014.
- [4] A.-M. Awal, H. Mouchère, and C. Viard-Gaudin, “A global learning approach for an online handwritten mathematical expression recognition system,” Pattern Recognition Letters, vol. 35, no. 0, pp. 68 – 77, 2012.
- [5] B. Huang and M.-T. Kechadi, “A structural analysis approach for online handwritten mathematical expressions,” in International Journal of Computer Science and Network Security,, 2007.
- [6] S. Lehmberg, H.-J. Winkler, and M. Lang, “A soft-decision approach for symbol segmentation within handwritten mathematical expressions,” in International Conference on Acoustics, Speech, and Signal Processing (ICASSP), 1996.
- [7] E. Tapia and R. Rojas, “Recognition of on-line handwritten mathematical expressions using a minimum spanning tree construction and symbol dominance,” in Graphics Recognition. Recent Advances and Perspectives, 2004, vol. 3088, pp. 329–340.
- [8] M. Bresler, D. Prùa, and V. Hlavác, “Modeling flowchart structure recognition as a max-sum problem,” in 12th International Conference on Document Analysis and Recognition, Aug 2013, pp. 1215–1219.
- [9] M. Bresler, T. V. Phan, D. Prusa, M. Nakagawa, and V. Hlavác, “Recognition system for on-line sketched diagrams,” in International Conference on Frontiers in Handwriting Recognition (ICFHR), Sept 2014, pp. 563–568.
- [10] C. Carton, A. Lemaitre, and B. Coüasnon, “Fusion of statistical and structural information for flowchart recognition,” in 12th International Conference on Document Analysis and Recognition, Aug 2013, pp. 1210–1214.
- [11] W. Liu, D. Anguelov, D. Erhan, C. Szegedy, S. Reed, C.-Y. Fu, and A. C. Berg, “SSD: Single shot multibox detector,” in ECCV, 2016.
- [12] S. Ren, K. He, R. Girshick, and J. Sun, “Faster R-CNN: Towards real-time object detection with region proposal networks,” in Advances in Neural Information Processing Systems 28, C. Cortes, N. D. Lawrence, D. D. Lee, M. Sugiyama, and R. Garnett, Eds. Curran Associates, Inc., 2015, pp. 91–99.
- [13] R. Girshick, J. Donahue, T. Darrell, and J. Malik, “Rich feature hierarchies for accurate object detection and semantic segmentation,” in Proceedings of the 2014 IEEE Conference on Computer Vision and Pattern Recognition, 2014, pp. 580–587.
- [14] R. Girshick, “Fast R-CNN,” in 2015 IEEE International Conference on Computer Vision (ICCV), Dec 2015, pp. 1440–1448.
- [15] H. Mouchère, C. Viard-Gaudin, R. Zanibbi, and U. Garain, “ICFHR 2016 CROHME: Competition on recognition of online handwritten mathematical expressions,” 2016, pp. 607–612.
- [16] M. Everingham, L. Van Gool, C. K. I. Williams, J. Winn, and A. Zisserman, “The Pascal Visual Object Classes (VOC) challenge,” International Journal of Computer Vision, Jun 2010.
- [17] K. Simonyan and A. Zisserman, “Very deep convolutional networks for large-scale image recognition,” International Conference on Learning Representation, 2015.
- [18] A.-M. Awal, G. Feng, H. Mouch re, and C. Viard-Gaudin, “First experiments on a new online handwritten flowchart database,” in Document Recognition and Retrieval XVIII, San Fransisco, United States, Jan 2011, pp. 7874 – 78 740A.
- [19] S. Ioffe and C. Szegedy, “Batch normalization: Accelerating deep network training by reducing internal covariate shift,” in Proceedings of the 32d International Conference on on Machine Learning - Volume 37, ser. ICML’15, 2015, pp. 448–456.
- [20] K. He, X. Zhang, S. Ren, and J. Sun, “Deep residual learning for image recognition,” in 2016 IEEE Conference on Computer Vision and Pattern Recognition (CVPR), 2016.
- [21] C. Szegedy, S. Ioffe, and V. Vanhoucke, “Inception-v4, inception-resnet and the impact of residual connections on learning,” CoRR, 2016. [Online]. Available: http://arxiv.org/abs/1602.07261
- [22] C. Wang, H. Mouchère, C. Viard-Gaudin, and L. Jin, “Combined Segmentation and Recognition of Online Handwritten Diagrams with High Order Markov Random Field,” in International Conference on Frontiers in Handwriting Recognition (ICFHR), 2016, pp. 252–257.