Thermal decoherence in a strongly correlated Bose liquid
Abstract
We compute the single particle spectral function of a Bose liquid on a lattice, at integer filling, close to the superfluid-Mott transition. We use a ‘static path approximation’ that retains all the classical thermal fluctuations in the problem, and a real space implementation of the random phase approximation (RPA) for the Green’s functions on the thermally fluctuating backgrounds. This leads to the standard RPA answers in the ground state but captures the progressive damping of the excitations with increasing temperature. We focus on the momentum resolved lineshape across the superfluid to Bose liquid thermal transition. In the superfluid regime we observe gapped ‘amplitude’ modes, and gapless ‘phase’ modes of positive and negative energy. The dispersion and weight of these modes changes with interaction but are almost temperature independent, even into the normal state, except near critical coupling. The damping of the modes varies roughly as , where is the temperature and the momentum, with and being weakly momentum dependent. The Mott phase has gapped dispersive spectra. Near critical coupling the thermal Bose ‘liquid’ is gapped, with progressive widening of the gap with increasing temperature, a feature that it shares with the Mott insulator.
I Introduction
The homogeneous Bose gas with weak repulsive interactions nozieres-qlig has a dispersion , where is the momentum of the excitation, , and is the critical superfluid (SF) velocity. This result differs from the that one expects for free particles, and is responsible for supporting ‘superflow’ upto a velocity in the system. The result was arrived at by using a method suggested by Bogoliubov bog-ref . In the presence of a potential (a trap, say) the order parameter profile is described by the Gross-Pitaevskii equation gp-eqn , and excitations are obtained by using a Gaussian expansion stringari-rmp on this background.
The presence of a lattice, as in ultracold atomic systems ultracold-genl , has two effects, (i) it affords tunability of the interaction to kinetic energy ratio (for a given atomic species), and (ii) it breaks galilean invariance. At integer density, increasing the lattice depth drives a transition from the superfluid to a Mott insulator jaksch ; bloch-rev . The weak coupling superfluid, as in the continuum, has a low energy linearly dispersing mode, while the Mott insulator - a phase specific to the lattice - has a gapped excitation spectrum. Increasing interaction in the superfluid leads to the appearance of a ‘negative energy’ gapless mode - which dictates the broadening of the momentum distribution from the simple peak, and gapped ‘amplitude’ modes of both positive and negative energy As the system heads towards the Mott transition the weight shifts from the traditional Bogoliubov mode to the negative energy phase mode and the amplitude modes.
The realization of a superfluid to Mott transition Bloch ; Immanuel Bloch ; Zwerger in optical lattices has allowed access to some of the dynamical properties of correlated bosons. The excitation spectra can be probed via Bragg spectroscopy Fort ; Ernst ; Klaus , which accesses the dynamic structure factor, and lattice spectroscopy Endres , which probes the kinetic energy correlator. The measurements have revealed the existence of of the sound (Bogoliubov) mode and also the more exotic amplitude mode.
There have been efforts in calculating the single particle and two particle spectral properties. At zero temperature, the methods employed include a strong coupling approach Sen , Schwinger-boson mean field theory Huber , the random phase approximation Menotti , the quantum rotor approachTA1 and a variational cluster method Knap1 ; Knap2 ; Knap3 ; Knap4 . Their main result is that the superfluid spectrum consists of two gapless modes and a gapped mode. The weight in the gapped mode increases as one moves toward the transition, while the ‘gap’ itself reduces. There have also been attempts to go beyond the RPA formalism within the Mott phaseBlatter ; Pelster .
The effect of thermal fluctuations on the single particle spectrum seem to have seen much less of an effort. This is a fascinating question in the vicinity of a Mott transition since results on the fermionic problem indicate that the coherence temperature of a Fermi liquid vanishes georges-krauth-prb ; dmft-rmp as it approaches the Mott transition. For bosons in one dimension quantum Monte Carlo (QMC) results Peter indicate strong broadening of the particle band and suppressed spectral weight for hole excitations. The broadened positive branch has no clear linear behaviour at small momentum. Recent QMC studies in higher dimension are more focused on calculating two particle response functionsLiu ; Kun ; Pollet . Other approaches to thermal properties are slave bosons stoof , the quantum rotor approach TA2 in 2D and 3D and bosonic dynamical mean field theory Panas (BDMFT) in 3D. The slave rotor approach indicates an increase in the gap with rising temperature with the tip of the Mott lobe moving to smaller interaction.
We provide an alternate approach to compute single particle quantities via a two step process: (i) we ‘solve’ the Bose Hubbard model via an auxiliary field decomposition of the kinetic term and a static (but spatially fluctuating) approximation for the auxiliary field, and (ii) on the equilibrium configurations of this theory, which capture quite well bhm-thermal , we use a real space generalisation of the ‘random phase approximation’ (RPA) for the boson Green’s function. The method has no analytic continuation problems and directly computes real frequency correlation functions as we will explain later. Both (i) and (ii) above readily generalise to the presence of a trap, background disorder, and effects like spin-orbit coupling. Our main results are the following:
-
1.
Nature of the spectral function: At a general coupling, , and temperature , the spectral weight in the single particle Green’s function in the superfluid resides primarily in two gapless ‘phase modes’ and two gapped ‘amplitude modes’, each with a positive and negative energy branch. The lineshape can be characterised by a ‘four peak’ structure indexed by their mean excitation energy , the weight (or residue) , and the width (or damping) . The integer indexes the four peaks at a given momentum.
-
2.
Temperature dependence: While the all depend on , the and are essentially temperature independent in the superfluid, except near . , within our scheme, is zero at and can be approximated by , with and the are weakly momentum dependent.
-
3.
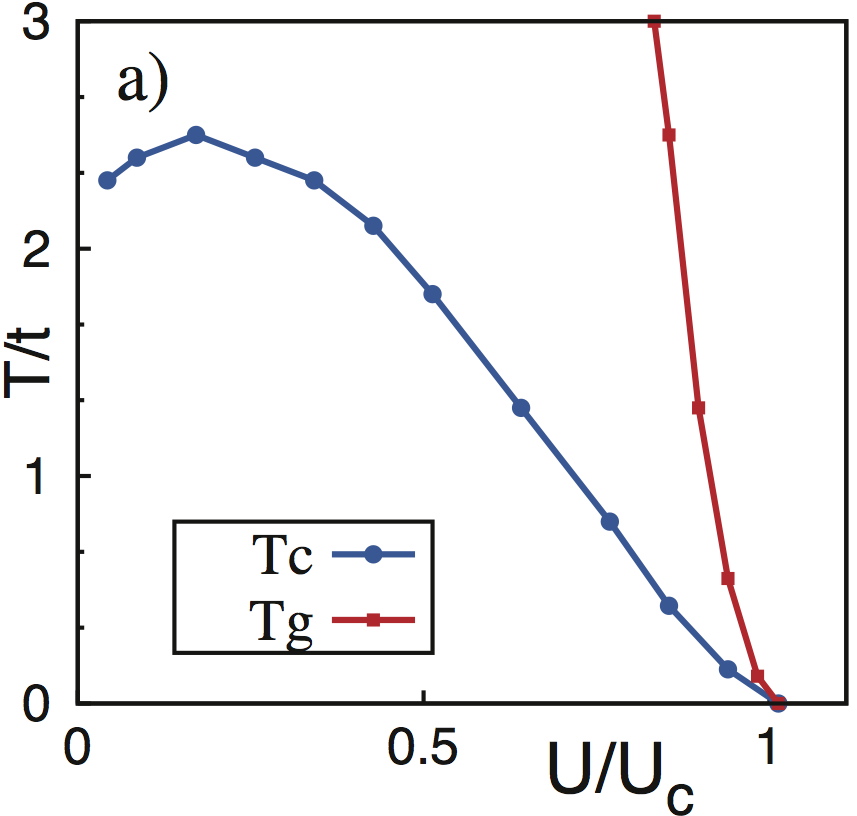
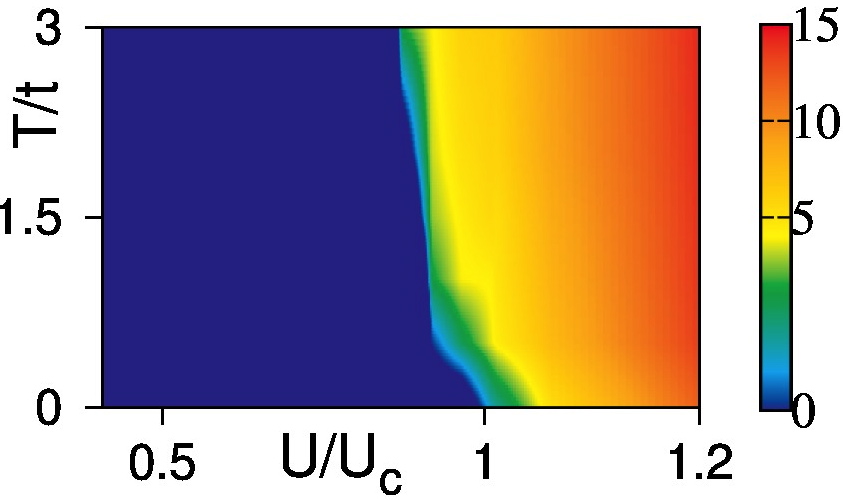
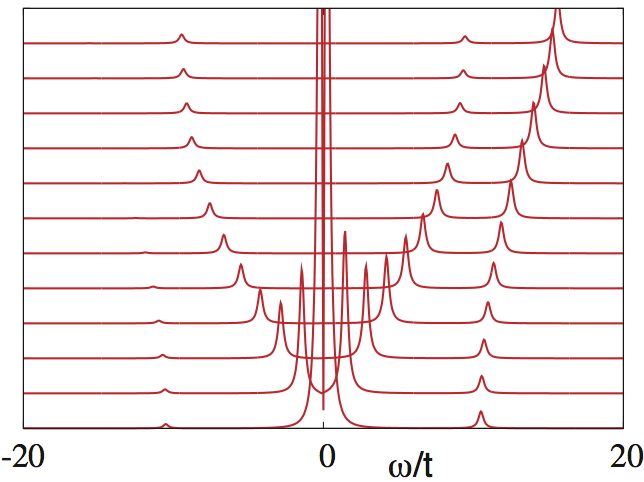
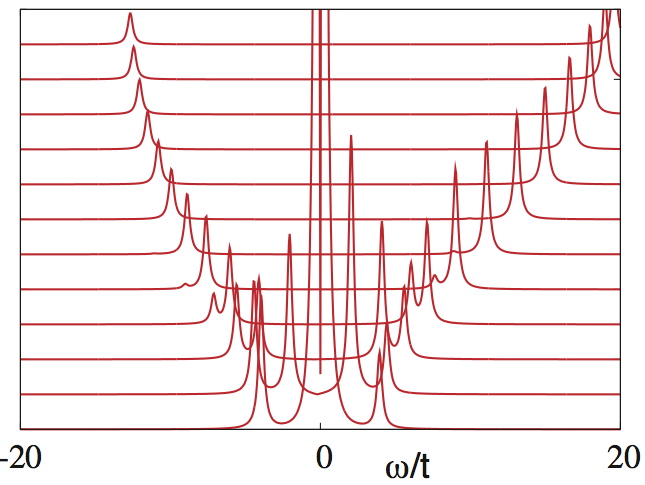
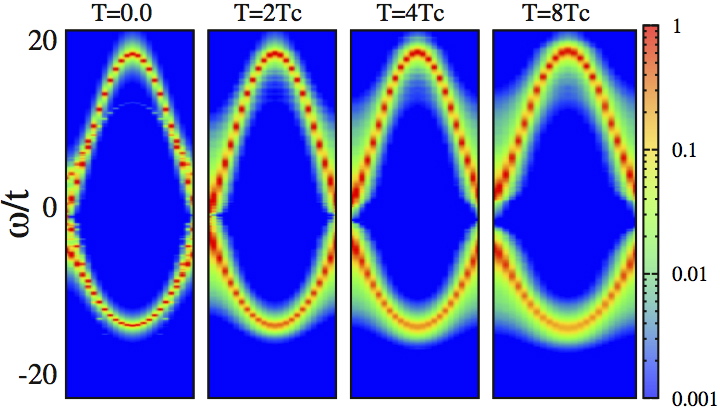
Vicinity of the Mott transition: In the vicinity of critical coupling, , the normal ‘Bose liquid’ is gapped, with progressive widening of the gap with increasing temperature, Fig.1. This is a feature that it shares with the finite temperature Mott insulator.
-
4.
Interaction effects in the normal Bose liquid: In the high temperature normal state a two band description suffices. The dispersion is gapped once beyond an interaction . While the bandwidth increases monotonically as increases towards , the damping, roughly momentum independent, peaks at a scale (around where also peaks) and reduces as .
The paper is organized as follows: in Section II we discuss the model, our method, and its numerical implementation. Section III discusses our results for the ground state, Section IV discusses thermal effects in different interaction regimes, while Section V highlights the effect of increasing interaction on the high temperature normal Bose liquid. We conclude in Section VI.
II Model and method
The Bose Hubbard model (BHM) is given by.
where is the nearest neighbour hopping, the interaction strength and the chemical potential. In an earlier paper bhm-thermal we have discussed in detail the method for obtaining the thermal phase diagram of the model above by using an auxiliary field decomposition of the kinetic term and then either (i) a classical (time independent) approximation for the auxiliary field - called the static path approximation (SPA), or (ii) retaining Gaussian quantum fluctuations about the SPA result, the so called perturbed SPA (or PSPA) scheme. We quickly recapitulate the SPA scheme below. Once the equilibrium distribution for the auxiliary field is obtained, via a Monte Carlo strategy, we can compute the boson Green’s function through a real space implementation of the random phase approximation (RPA). The RPA, although not exact, has been shown to yield qualitatively correct results in the ground state.
The BHM in path integral formalism can be written as
| (1) | |||||
where represents the original bosonic fields.
This can be rewritten as
| (2) | |||||
| (3) | |||||
| (4) | |||||
with and
where
We have to compute
| (5) | |||||
| (6) | |||||
| (7) | |||||


We compute the Green’s function via the ‘self avoiding walk’ method proposed in the context of the strong coupling expansion. On the mean field state it leads to the same answers as standard RPA but there are no answers yet on the finite temperature backgrounds. The detailed method is discussed in the Appendix, we only quote the final answer here.
where is the Green’s function of the atomic problem and is the hopping matrix. We analytically continue to obtain the retarded Green function. This is the RPA result averaged over thermal configurations of the field. Now, and .
We solve the SPA hamiltonian for each background configuration. Then we construct atomic Green’s function matrix whose expressions are given in the Appendix. is the block diagonal matrix of size . is the hopping matrix of size whose expressions are also given in the Appendix. To compute the corrected Green’s function for each background we subtract the hopping matrix from the inverted the atomic Green’s function and take its inverse for every value of . To compute we multiply the above matrix by row matrix of size and its hermitian conjugate. We repeat the above procedure for each thermal configuration and take the average. All our results are on size .
Finally, given the observed ‘four peak’ structure of the spectral function (with higher bands having negligible weight) we tried a four Lorentzian fit to the spectral data. These involve twelve parameters, 4 residues, 4 ‘center frequencies’ and 4 broadenings, with the sum of the 4 residues being acting as a sum rule check. This is a scheme that we applied at all in the window, while for a two Lorentzian fit is more appropriate. Specifically, we tried:
Much of the analysis in this paper is based on the estimated parameter set for varying and .
III Results at zero temperature
All the results we discuss are at fixed such that particle density is fixed to unity. We first discuss the zero temperature results, in terms of two regimes: (i) the superfluid phase, all the way from weak coupling to the transition point, and (ii) the Mott phase. The finite temperature results are discussed in a similar spirit.
III.1 The superfluid ground state
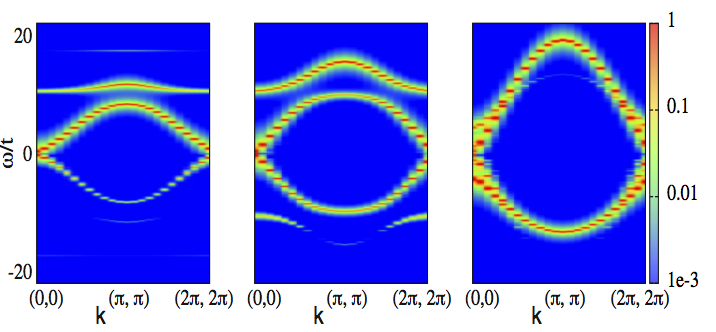
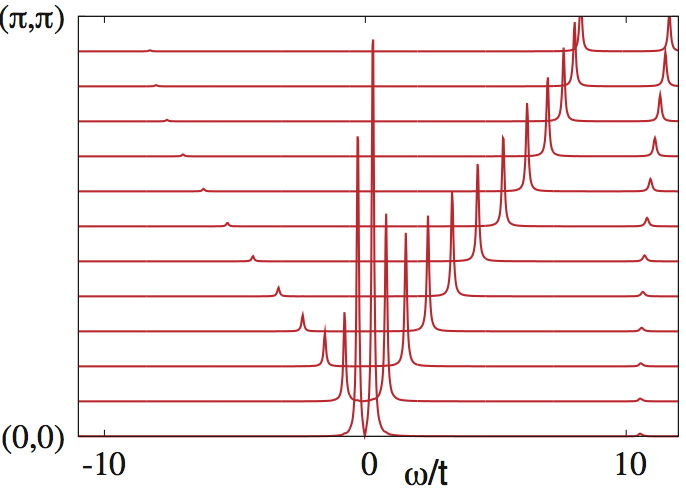
Fig.2 shows the evolution of the spectrum in the superfluid phase from weak interaction, , to intermediate, , and then to . The critical coupling is in the problem. The first row shows a map of , for varying from . The second row shows the lineshape of , since some features are not clear in the spectral map, while the third shows the DOS . We note that
therefore contains the same information as .
In the weak coupling superfluid at the only mode that has substantial weight is the positive energy gapless mode. This is the Bogoliubov mode associated with the broken symmetry - the Goldstone mode in this problem. When the dominant occupancy is still that of , the negative energy spectra has very small residue at all since and we assume that for all .


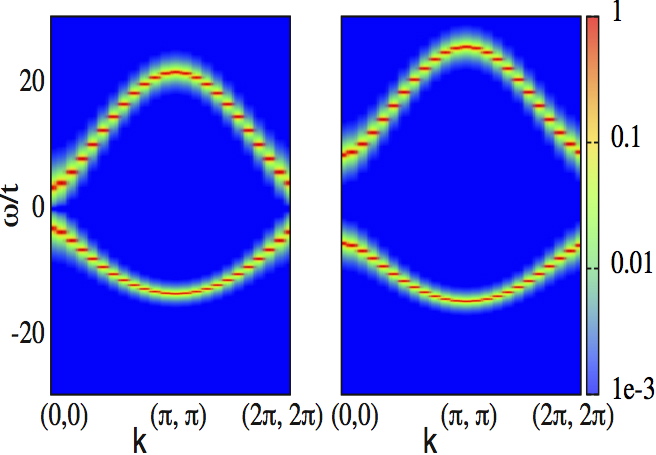


Looking at the spectral map, top row in Fig.2, already at (left panel) one sees three more bands in additional to the traditional gapless Bogoliubov band. These include a negative energy gapless mode, with linear dispersion, and gapped amplitude bands of positive and negative energy. The negative energy gapped band has very small weight and is visible only near . Increasing interaction, middle panel, , makes the weight in the negative energy gapless mode visibly larger, signifying a broader distribution, as well as more prominent amplitude modes. At , right panel, the gap in the amplitude modes has almost vanished. This signifies that in “amplitude-phase” space the potential energy function is essentially flat and low momentum fluctuations in either sector, or both, are of very low energy.
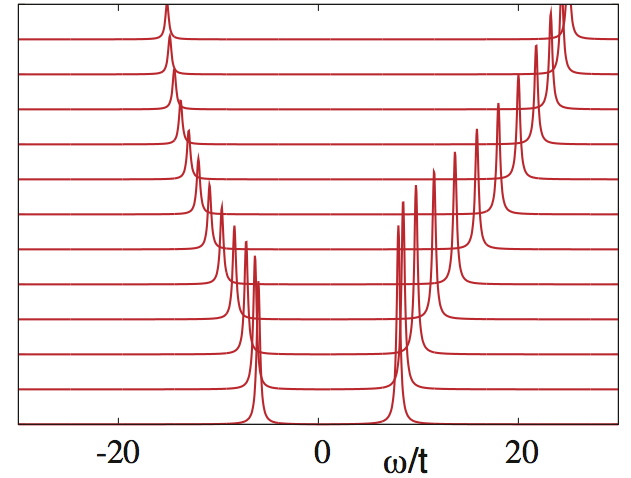
The middle row in Fig.2 shows the lines associated with , which are essentially resolution limited at . The momenta values in these panels increase from for the line in the front to for the line at the back. The patterns reveal the relatively large ‘mass gap’ of the amplitude mode at and its progressive reduction as increases to (where it is still visibly finite). It also shows that at low and low the only relevant mode is continuum like, since weak interaction and low are equivalent to the Nozieres-Leggett theory. However, increasing momentum even at leads to a sizeable residue in the amplitude mode, while increasing interaction takes one farther away from the weak coupling continuum picture.
The third row in Fig.2 shows the evolution of DOS as a function of interaction strength in the superfluid phase. We find the slope of DOS around increasing as a function of interaction strength. This is the mark of increasing superfluid velocity with . On the negative frequency axis the DOS increases with interaction strength. This is related to the condensate depletion as we argued for the spectral function. At positive frequency and small we see a dip in density of states and then again a rise. This arises from the separation of the amplitude and phase bands at small . This dip is not visible at large . due to the overlap of the bands.
In Fig.3 we plot some indicators extracted from the and dependence of the spectral functions at more values than we have shown in Fig.2. The superfluid velocity, panel (a), is calculated as the slope of the dispersion of the positive energy gapless mode as . The slope increases with . The superfluid velocity almost doubles from to to . Panel (b) shows the separation between the positive energy amplitude and phase modes at (blue) and (red). The phase mode is anyway zero energy at so the blue curve basically shows the collapse of the mass gap of the amplitude mode as . Panel (c) shows the variation of the small residue with for the positive amplitude and phase bands. The amplitude residue is vanishingly small as , where the phase mode dominates, but overcomes the phase residue as . At , however, the amplitude residue is much larger than the phase residue for the window .
III.2 The Mott ground state
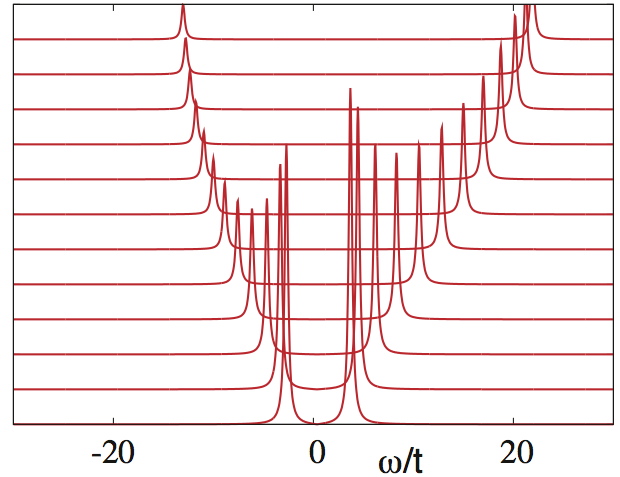
In Fig.4 the first row shows the map of , the second row shows the lineshape and the third row the DOS for a ‘weak’ Mott insulator, and a ‘deep’ Mott state, .
In the Mott phase there are only two modes - termed as particle mode at positive frequency and hole mode at negative frequency. At the transition point both the mode are gapless if one is at the tip of the Mott lobe otherwise if one approaches the transition point from other points on lobes only one of the mode is gapless. As one moves into the Mott phase both the modes are gapped and the gap between them at increases with . The weight of the both the modes for fixed interaction strength decreases as one goes to larger momentum. The depletion of weight with increasing momentum becomes slower as one goes higher up in interaction strength. If we compare the absolute weight of modes at fixed momentum for different values we see a small decrease with increase in .
Fig.4 third row shows the plot of density of states inside Mott phase at and . The gap in DOS grows increases with . The DOS at a fixed interaction strength inside Mott phase has a free particle like shape with van hove like feature on both side of the frequency axis. The band width of the DOS decreases with .
IV Thermal behaviour in different interaction regimes
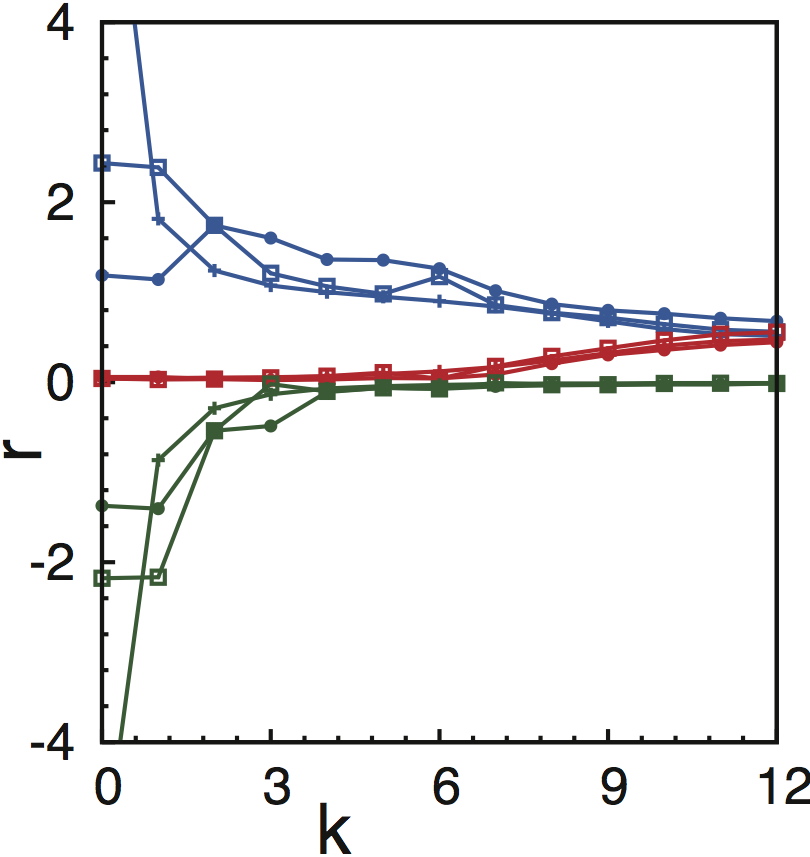
As one heats the superfluid we see two distinct types of transition from superfluid to normal phase. The normal state can be gapless or gapped. We show the gap opening temperature and dependence of magnitude of gap on interaction and temperature in Fig.1.




IV.1 The superfluid at finite temperature
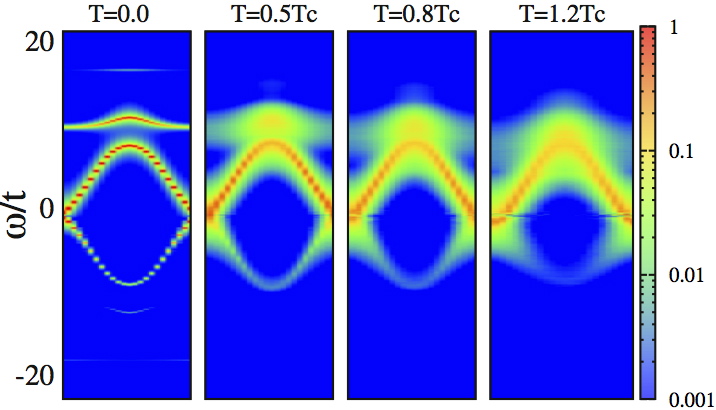
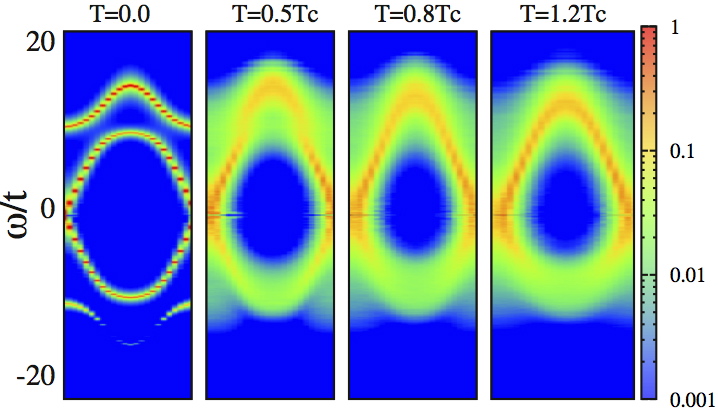
Fig.5 shows the plot of for and varying . First we discuss the results for and . At zero temperature the gapless and gapped modes are sharply peaked function of for each wave vector. The increase in temperature leads to reduction in weight and broadening of modes. There is a huge reduction in weight for small momenta, while the residue at large momenta remain largely independent. We find that for beyond there is not much reduction in weight. In general the reduction is more prominent on the negative frequency axis.
At low temperature only small momenta have large non-zero weight close to . This changes with temperature rise as other wave vectors now have large non zero weight at frequency close to zero and with a long tail at large . This gets more pronounced as one goes up in temperature and more prominent for the small superfluid. For it is possible to distinguish between gapless and gapped band for temperatures less than Tc but for even above this distinction is hard to make due to thermal broadening. This feature gets worse as one goes higher up in interaction strength since at zero temperature gapless and gapped bands are close to one another. Above a temperature it is difficult to discuss in terms of multiple band but the single band picture emerges due to band overlapping.
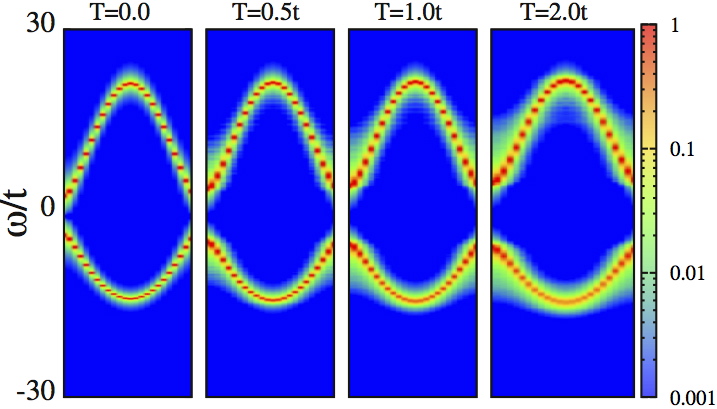
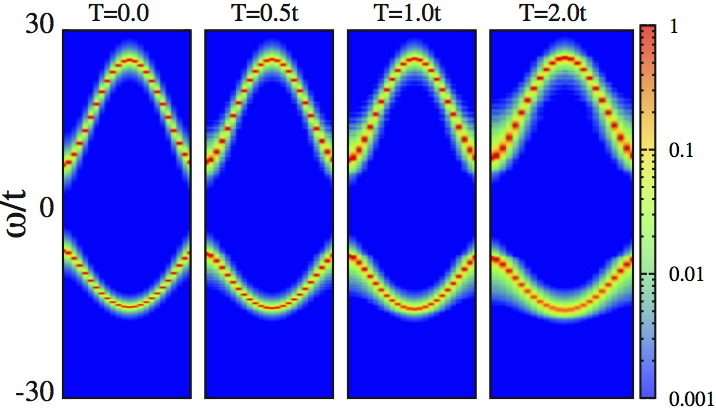
Now we discuss superfluid close to the transition, . At zero temperature excitation spectra consists of gapless and gapped mode. The temperature rise leads to broadened spectra with reduction in weight ultimately to creation of gap in the excitation spectra which keeps increasing with temperature. With rising temperature the suppression and shifting of peak to large frequency is seen for small momentum.


The broadening is visible and two peak structure at small temperature is converted to single peak structure at finite large temperature. For large momentum only thermal effect is suppression of peak with its position remaining unchanged.The percentage suppression is large for small momentum as compared to large momentum. At large finite temperature the peak in has non monotonic dependence on momentum. Below it is difficult to distinguish between the phonon and amplitude band but above only single band is visible so we show data for temperature greater or equal to 0.5t.


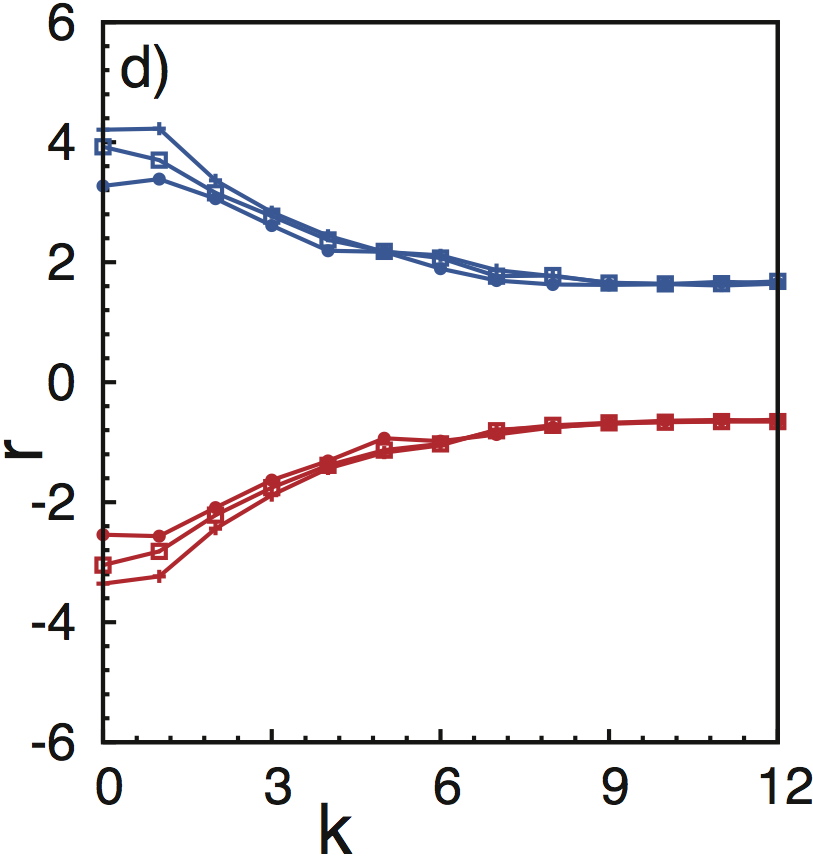
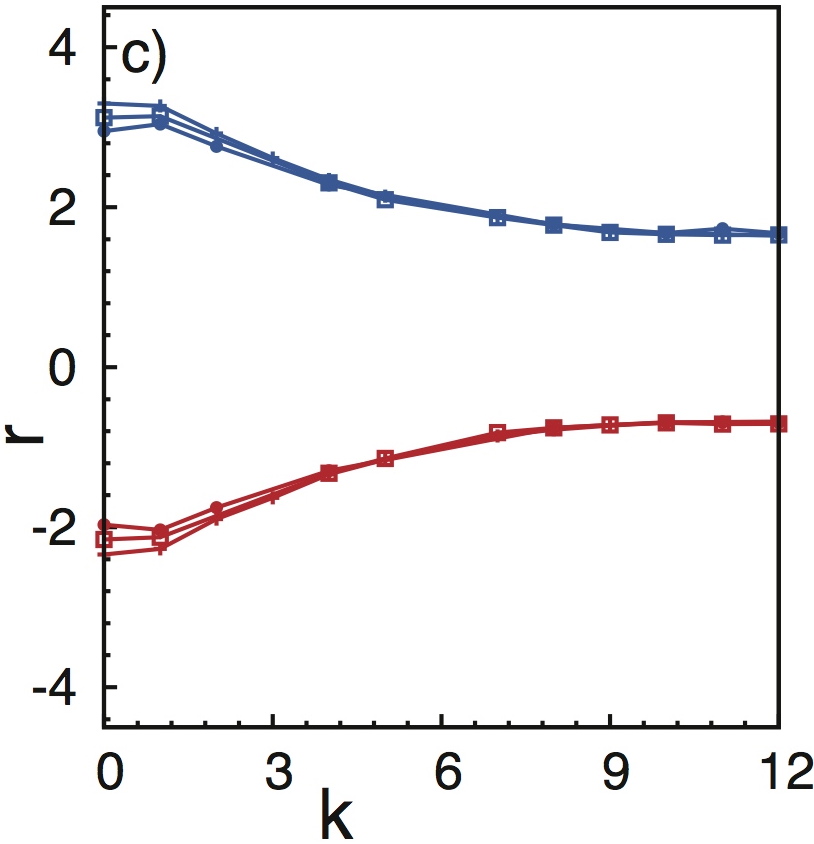


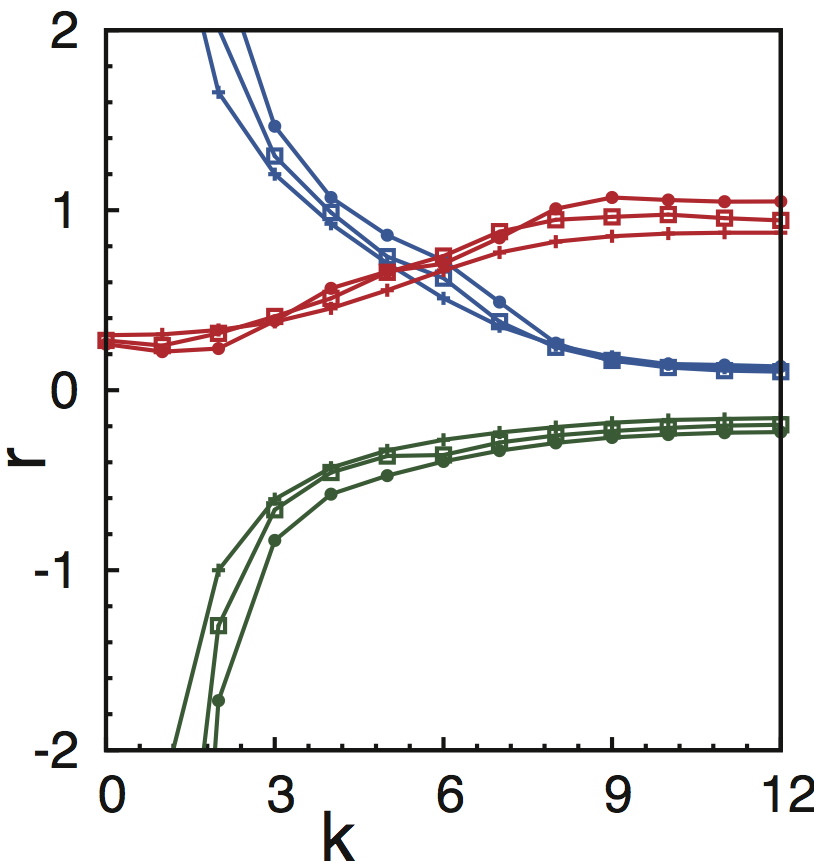
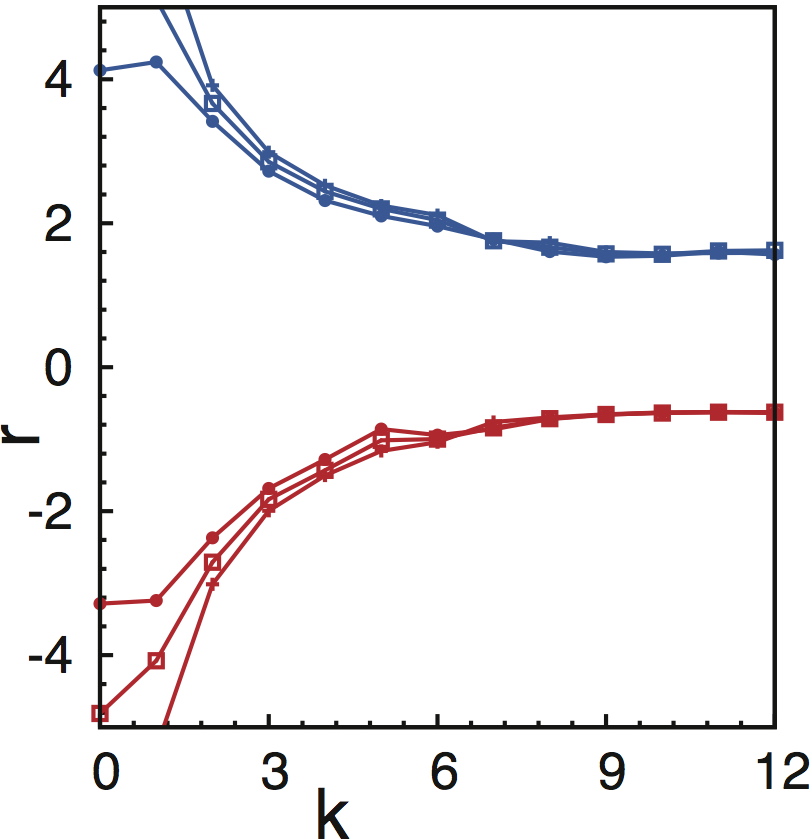
We track the average dispersion and broadening of the bands by fitting the data to four peak lorentzian shown in Fig.7. The average dispersion does not show any temperature dependence with mode structure remaining same except for superfluid near critical point.The residue decreases with temperature for all momentum values and the bands.The effect of temperature on residue is stronger at small momentum values. For and we show broadening scales for only gapless band. The broadening increases with temperature for all of the bands and interaction strength. The broadening scales are larger for the gapless band on the negative frequency axis as compared to one on the frequency axis. The broadening shows momentum dependence and has a non monotonic dependence on interaction strength first increasing and then decreasing with interaction strength.


Fig.6 shows the plot of DOS for and . For the temperature dependence of DOS is small. There is not much change in density of states on the negative frequency side with temperature. On the positive frequency the dip in the density of states at larger seen at T=0t is reduced due to mixing of amplitude and gapless mode with rise in temperature. Overall there is small suppression of DOS on positive frequency side.But near around the rise in DOS can be seen with temperature. The loss of superfluidity is due to decoherence. Similar features are seen for except that small increase in DOS peak and shrinking of width with temperature is visible. The similar trends in DOS can also be seen for other values away from the transition point. We find that even above Tc for most part of the phase diagram DOS is not gapped around . This trend changes for the superfluid near critical interaction strength. At zero temperature density of states are gapless for . With rising temperature low energy peak gets suppressed and formation of gap in DOS is visible. At high frequency not much temperature dependence is seen both for positive and negative frequency.
IV.2 Thermal effects in the Mott regime
Fig.8 shows the plot of for and . The excitation spectra consists of two modes. Overall weight on the hole and particle mode is seen decreasing with temperature rise. The gap increases with temperature. We fit the data to the two peak lorentzian and obtain residue,mean dispersion and broadening scales shown in Fig.10. The average dispersion again show not much temperature dependence.The residue depletes with temperature but the depletion is small. The broadening is seen increasing with temperature and has small momentum dependence. The broadening scales roughly increases by twofold at as compared to value. The broadening scales are similar for the hole band as well as particle band.
Fig.9 shows the plot of for and . The effect of temperature on N() is sharp reduction of van-hove like peak, increase in gap with both and , but, overall DOS retains its feature at all temperature.
V Effect of increasing interaction in the normal state
Fig.11 shows the plot of , lineshapes and density of states for increasing interaction at At for and the gapless and gapped bands merge together and only single band is visible.The bandwidth increases with interaction. Increasing interactions drives the normal bose liquid to gapped bose liquid. The gap increases with increase in interaction strength. This can be clearly seen from spectral map and density of states. The asymmetry in density of states between positive and frequency axis reduces with increasing interaction.We fit the spectral data using two peak lorentzian.We find that broadening behave non-monotonically with increasing interaction with a maximum at U=4t.The mean dispersions roughly agrees with zero temperature dispersion except for the gapped bose liquid.The suppression in residue is more for small interactions as compared to large interactions.
VI Conclusions
We have presented results on the single particle spectral function of the Bose Hubbard model at integer filling as the interaction drives the system from the superfluid to the Mott state. Our generalisation of the standard mean field theory brings in all the classical thermal fluctuations in the problem, in terms of the auxiliary field that decouples the kinetic energy term. This, as we have discussed elsewhere, is an excellent method for computing the thermal transition scale in the problem. In the thermally fluctuating backgrounds we implement a real space ‘RPA’, equivalent to the ‘self avoiding walk’ method of strong coupling theory. We present the momentum resolved lineshape across the superfluid to Bose liquid thermal transition, tracking the mean dispersion, weight and damping of the four primary modes in the problem. The dispersion and weight of these modes changes with interaction but are almost temperature independent, even into the normal state, except near critical coupling. The damping varies roughly as , where is the temperature, the momentum, , and is weakly momentum dependent. Near critical coupling the thermal Bose ‘liquid’ is gapped, with progressive widening of the gap with increasing temperature.
Acknowledgement: We acknowledge use of the High Performance Cluster Facility at HRI. Abhishek Joshi was partially supported by an Infosys student award. AJ acknowledges fruitful discussions with Sauri Bhattacharyya, Arijit Dutta and Samrat Kadge.
VII Appendix
We have to compute
Now,
We approximate G by adding all self avoiding walk process.We drop corrections due to higher order loop diagrams which are important to go beyond SPA.We do not include corrections due to Bij part of Sb.
The summation of self avoiding walk leads to the RPA corrected Green’s function.The series can be more compactly written in a matrix notation
where is given by
and is the hopping matrix.
We analytically continue to obtain the retarded Green function. This is the RPA result averaged over thermal configurations of the field.
where is the row matrix
To compute the corrected GRPA we have to calculate atomic Green’s function. The atomic Green’s functions are computed using thermal backgrounds obtained from SPA on lattice.
References
- (1) P. Nozieres and D. Pines, The theory of quantum liquids: superfluid Bose liquids, Westview Press.
- (2) N. N. Bogoliubov, (1947), J. Phys. USSR 11, 23 (1947).
- (3) E. P. Gross, Il Nuovo Cimento. 20, (3) 454 (1961), L. P. Pitaevskii, Sov. Phys. JETP. 13, (2) 451 (1961).
- (4) F. Dalfovo, S. Giorgini, L. P. Pitaevskii and Sandro Stringari, Rev. Mod. Phys. 71, 463 (1999).
- (5) T. Esslinger, Annu. Rev. Condens. Matter Phys. 1, 129 (2010).
- (6) D. Jaksch, C. Bruder, J. I. Cirac, C. W. Gardiner and P. Zoller, Phys. Rev. Lett. 81, 3108 (1998).
- (7) I. Bloch, Nature Physics, 1, 23 (2005).
- (8) M. Greiner, O. Mandel, T. Esslinger, T. W. Hänsch, and I. Bloch, Nature (London) 415, 39 (2002).
- (9) I. Bloch, Nature Physics 1, 23 (2005).
- (10) I. Bloch, J. Dalibard, and W. Zwerger Rev. Mod. Phys. 80, 885 (2008).
- (11) D. Clèment, N. Fabbri, L. Fallani, C. Fort, and M. Inguscio, Phys. Rev. Lett. 102, 155301 (2009).
- (12) P. T. Ernst, S. Götze, J. S. Krauser, K. Pyka, D. Lühmann, D. Pfannkuche and K. Sengstock, Nature Physics 6, 56 (2010).
- (13) U. Bissbort, S. Götze, Y. Li, J. Heinze, J. S. Krauser, M. Weinberg, C. Becker, K. Sengstock, and W. Hofstetter, Phys. Rev. Lett. 106, 205303 (2011).
- (14) Endres, T. Fukuhara, D. Pekker, M. Cheneau, P. Schauupbeta, C. Gross, E. Demler, S. Kuhr, and I. Bloch, Nature 487, 454 (2012).
- (15) K. Sengupta and N. Dupuis, Phys. Rev. A 71, 033629 (2005).
- (16) D. Huber, E. Altman, H. P. Büchler, and G. Blatter Phys. Rev. B 75, 085106 (2007).
- (17) C. Menotti and N. Trivedi, Phys. Rev. B 77 , 235120 (2008).
- (18) T. A. Zaleski, Phys. Rev. A 85, 043611 (2012).
- (19) M. Knap, E. Arrigoni, and W. von der Linden, Phys. Rev. B 83, 134507 (2011).
- (20) S. Ejima, H. Fehske, F. Gebhard, K. zu Münster , M. Knap, E. Arrigoni, and W. von der Linden, Phys. Rev. A 85, 053644 (2012).
- (21) M. Knap, E. Arrigoni, and W. von der Linden, Phys. Rev. B 81, 024301 (2010).
- (22) M. Knap, E. Arrigoni, and W. von der Linden, Phys. Rev. B 81, 235122 (2010).
- (23) S. Schmidt and G. Blatter, Phys. Rev. Lett. 103, 086403 (2009).
- (24) M. Ohliger, A. Pelster, World Journal of Condensed Matter Physics 3, 125-130 (2013)
- (25) A. Georges and W. Krauth, Phys. Rev. B 48, 7167 (1993).
- (26) A. Georges, G. Kotliar, W. Krauth, and M. J. Rozenberg, Rev. Mod. Phys. 68, 13 (1996).
- (27) P. Pippan, H. G. Evertz, and M. Hohenadler Phys. Rev. A 80, 033612
- (28) L. Liu, K. Chen, Y. Deng, M. Endres, L. Pollet, N. Prokof’ev, Phys. Rev. B 92, 174521 (2015).
- (29) K. Chen, L. Liu, Y. Deng, L. Pollet, and N. Prokof’ev, Phys. Rev. Lett. 110, 170403 (2013).
- (30) L. Pollet and N. Prokof’ev, Phys. Rev. Lett. 109, 010401 (2012)
- (31) D. B. M. Dickerscheid, D. van Oosten, P. J. H. Denteneer, and H. T. C. Stoof Phys. Rev. A 68, 043623 (2003)
- (32) T. A. Zaleski and T. K. Kopeć, Physica B 433, 37 (2014).
- (33) Panas, A. Kauch, J. Kuneš, D. Vollhardt and K. Byczuk, Phys. Rev. B 92 , 045102 (2015).
- (34) A. Joshi and P. Majumdar, arXiv:1711.01572.