A Striking Confluence Between Theory and Observations of High-Mass X-ray Binary Pulsars
Abstract
We analyse the most powerful X-ray outbursts from neutron stars in ten Magellanic high-mass X-ray binaries and three pulsating ultraluminous X-ray sources. Most of the outbursts rise to which is about the level of the Eddington luminosity, while the rest and more powerful outbursts also appear to recognize that limit when their emissions are assumed to be anisotropic and beamed toward our direction. We use the measurements of pulsar spin periods and their derivatives to calculate the X-ray luminosities in their faintest accreting (“propeller”) states. In four cases with unknown , we use the lowest observed X-ray luminosities, which only adds to the heterogeneity of the sample. Then we calculate the ratios and we obtain an outstanding confluence of theory and observations from which we conclude that work done on both fronts is accurate and the results are trustworthy: sources known to reside on the lowest Magellanic propeller line are all located on/near that line, whereas other sources jump higher and reach higher-lying propeller lines. These jumps can be interpreted in only one way, higher-lying pulsars have stronger surface magnetic fields in agreement with empirical results in which and values were not used.
keywords:
accretion, accretion discs—stars: magnetic fields—stars: neutron—X-rays: binaries1 Introduction
We are in the process of collecting and analysing X-ray observations of Magellanic high-mass X-ray binaries (HMXBs) obtained by Chandra, XMM-Newton, and RXTE over the past 15-20 years (Yang et al., 2017; Cappallo et al., 2017; Paper II, ; Paper IV, ; Paper V, ). The data that we have compiled from the published literature and the XMM-Newton archive show that a fair number of Magellanic pulsars (10) were caught jumping up to about the Eddington limit during their brightest type I and type II (Coe et al., 2010) outbursts (Figures 2 and 4 in Paper IV, ). This is an indication that the power output from these sources accreting from discs is somehow limited to the Eddington rate despite the fact that this limiting luminosity was derived for the case of spherical wind accretion. Hence, we hypothesized that ultraluminous X-ray (ULX) sources harboring neutron stars (NSs) may also recognize the Eddington limit and in Paper III we studied their properties in their minimum accreting (“propeller”) states (Illarionov & Sunyaev, 1975) assuming that their X-ray emissions are strongly anisotropic (an assumption supported by the recent results of Dauser et al., 2017; Kawashima et al., 2016). We found that the propeller states of the three NS ULX sources are quite similar to the lowest propeller states of Magellanic Be/X-ray pulsars, implying that all of these sources share common physical properties and evolutions, except for the amount of anisotropy in their X-ray emissions.
| Observed | Observed | Calculated | |||||||
|---|---|---|---|---|---|---|---|---|---|
| No. | Source | Error | |||||||
| (s) | (s s-1) | (s s-1) | (erg s-1) | (erg s-1) | (%) | (erg s-1) | (%) | ||
| 1 | NGC7793 P13 | 0.417 | 7.1 | ||||||
| 2 | SMC X-1 | 0.72 | 26 | ||||||
| 3 | NGC5907 ULX-1 | 1.137 | 1.1 | ||||||
| 4 | M82 X-2 | 1.3725 | 0.90 | ||||||
| 5 | SMC X-2 | 2.372 | 8.5 | ||||||
| 6 | LXP4.10 | 4.0635 | 0.21 | ||||||
| 7 | SXP4.78 | 4.782 | 1.7 | ||||||
| 8 | SXP5.05 | 5.05 | 5.6 | ||||||
| 9 | SXP6.85 | 6.85 | 1.0 | ||||||
| 10 | SMC X-3(a) | 7.78 | 0.92 | ||||||
| 11 | LXP8.04 | 8.035 | (b) | 0.0063 | |||||
| 12 | LMC X-4(c) | 13.50 | 0.0073 | ||||||
| 13 | SXP15.3 | 15.239 | 0.0079 | ||||||
Thus it is reasonable to study a combined sample of the above sources and, in particular, their state transitions between the highest () and lowest () accreting states. This is now viable because we have measurements of the spin periods and their time derivatives for Magellanic HMXB pulsars (Yang et al., 2017) and for the NS ULX sources (Bachetti et al., 2014; Fürst et al., 2016; Israel et al., 2017a, b).
The sample that we have compiled for this analysis is shown in Table 1. It consists of ten Magellanic sources and three NS ULX sources, all of which have been observed to emit near or above during their most powerful X-ray outbursts. In § 2, we calculate their propeller luminosities and surface dipolar magnetic fields based on the measured values of and and for canonical pulsar parameters (a mass of 1.4 and a radius of 10 km). We find that this is a homogeneous data set in which the pulsars share similar states and state transitions and they can be distinguished only by their values. But the values have been determined independently without using or values (Paper V, ), and the agreement between the two determinations is outstanding. This, in turn, demonstrates that both the measurements and the theoretical calculations are accurate and trustworthy. In § 3, we discuss these results.
2 X-ray Data and Analysis
Table 1 summarises the observations and the results of our calculations. The measurements of NS ULX sources were obtained from Bachetti et al. (2014), Fürst et al. (2016), and Israel et al. (2017a, b); the measurements of Magellanic HMXB sources were obtained from Yang et al. (2017), Paper IV , and the latest observations listed in the notes to the table. The column shows the observed X-ray luminosities that have reached near or above erg s-1 (for a mass of 1.4). The column shows the existing measurements of and the next column shows the published error bars. For the ULX sources, SMC X-3, and LMC X-4, the values were obtained during outbursts, whereas for the remaining sources they are long-term averages obtained over a period of 15 years. The column shows the calculated values of (see below). For those pulsars with no measurements, we adopted the observed minimum X-ray luminosities determined in Paper IV to lie near and above the lowest Magellanic propeller line with magnetic field TG.
| No. | Source | (TG) | |
|---|---|---|---|
| Lowest Propeller Line, TG | |||
| 1 | NGC7793 P13 | 1 | 0.29 |
| 3 | NGC5907 ULX-1 | 1.5 | 0.37 |
| 4 | M82 X-2 | 2 | 0.41 |
| 6 | LXP4.10 | 6(b) | 0.32 |
| 11 | LXP8.04 | 1 | 0.27 |
| Second Propeller Line, TG | |||
| 2 | SMC X-1 | 13 | 0.53 |
| 12 | LMC X-4 | 3.5 | 0.53 |
| 13 | SXP15.3 | 5 | 0.44 |
| Third Propeller Line, TG | |||
| 5 | SMC X-2(c) | 68 | 2.4 |
| Fourth Propeller Line, TG | |||
| 8 | SXP5.05 | 262 | 2.5 |
| 10 | SMC X-3 | 118 | 3.1 |
| Highest Propeller Line, TG | |||
| 7 | SXP4.78 | 70 | 1.5 |
| 9 | SXP6.85 | 95 | 1.0 |
The dimensionless ratios are defined by and and they are expressed in percentage form. For all sources with measured values, the values were calculated from the equation (Paper I, ; Paper III, )
| (1) |
where is the efficiency of converting accretion power to X-rays ( taken here to be 0.5), is the NS moment of inertia, is the gravitational constant, and and are the canonical values of the NS mass and radius, respectively. The introduction of also implies that we assume that minimum accretion takes place at a reduced torque compared to the observed maximum values during outbursts. The overall value of is uncertain; in general, we choose for NSs and for black holes, based in part on the work of Körding et al. (2006). Our choice of for NSs is also supported by the observations of M82 X-2: assuming isotropic emission, eq. (1) gives erg s-1 and this value agrees well with the value determined by Tsygankov et al. (2016). From 15 years of Chandra observations and assuming isotropic emission, Tsygankov et al. (2016) found that M82 X-2 has repeatedly switched between its high state and a low state with erg s-1 (see also Dall’Osso et al., 2016, who obtained the same value as an upper limit in quiescence).
In this seemingly heterogeneous data set, we finally define the dimensionless ratio with no distinction between and or and . The reason for using this ratio rather than propeller values is that uncertainties about the distances and beaming characteristics of these sources, especially the ULX sources, are removed. The ratio for observed quantities is equal to the ratio of the observed X-ray fluxes.
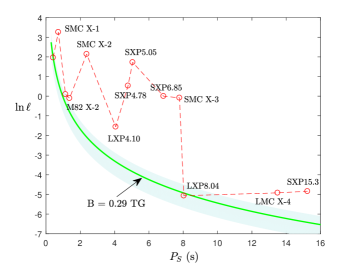
We plot in Fig. 1 the natural logarithms of versus . The individual points are connected by a dashed line. We also plot for reference the lowest Magellanic propeller line scaled to (solid line). Its ratio is defined for canonical pulsar parameters ( and km) by the equation (Stella et al., 1986; Paper III, )
| (2) |
where is given by eq. (5) of Paper III with magnetic moment and TG (Paper V, ).
At first glance, the result depicted in Fig. 1 is surprising. The ratio is expected to decrease steadily with spin period, just as the theoretical (solid) line does. Instead, the pulsars show a sawtooth distribution of vs. . Some of them appear to stay near the theoretical propeller line (the ULX sources, LXP4.10,111LXP4.10 did not have a type II outburst (Schmidtke et al., 1995) and its is considerably lower than , which pushes the point higher in Fig. 1. Nevertheless it belongs to the lowest propeller line, as its value in Table 2 indicates. and LXP8.04), but others jump consistently higher above that line. The jumps are pronounced and they cannot be explained as a result from observational errors, uncertainties surrounding and and their influence on eq. (1), or concerns about the validity of the equations themselves.
The characteristic behaviour of values seen in Fig. 1 and Table 1 can be explained as follows: the past observations of low-power states of Magellanic pulsars indicate that not all of them reach the lowest propeller line with TG (Paper V, ). In fact, we have discovered five different propeller lines each characterized by a progressively higher value of the magnetic field. The sources that jump in Fig. 1 have all been predicted to belong to higher propeller lines. Thus, the surprising element in this analysis is not the sawtooth behaviour, but the agreement between the present results and the empirical conclusions of Christodoulou et al. (see Table 1 in Paper V ) who did not use or in their determination of multiple propeller lines.
In Table 2, we quantify the degree of agreement in the determination of magnetic fields between this work and the results in Paper III and Paper V . The headings show the five empirical propeller lines from Paper V and the tight ranges of the segregated magnetic fields of Magellanic pulsars that defined them. These magnetic fields were calculated from the equation for minimum accretion of Stella et al. (1986) using only the lowest observed X-ray luminosities at progressively higher luminosity levels. The body of Table 2 lists our new determinations of the magnetic fields using data from Table 1, most of which depend on the measured values of . The sources have been regrouped according to the predictions of Paper V for Magellanic HMXB sources. Beaming has been taken into account for the sources whose brightest outbursts have registered significantly higher than the Eddington limit (the NS ULX sources, SMC X-2, SMC X-3, LXP8.04, and LMC X-4; for details, see Paper III, ). The agreement on the lower four propeller lines is precise. The difference for SMC X-2 may be explained due to the large error bar in the determination of (66% in Table 1); but see also note (c) in Table 2 for a counterargument that places SMC X-2 on the fourth propeller line.222In Paper V , SMC X-2 was placed on the third propeller line based on a single very faint ASCA detection ( erg s-1; Yokogawa et al., 2003).
The results differ substantially only in the fifth (highest) propeller line and the difference cannot be explained due to the error bars in the determination of . But this is the only line that is highly uncertain in the classification of Paper V , and the two sources involved could very well belong to the third propeller line since their jump factors are only and 95 (Table 2); additionally, only one observation was available for each source in our database and these single observations played a big role in defining the highest (and uncertain) propeller line.
The outstanding agreement between results in the lower four propeller lines supports the confluence between theory and observations in our disparate sample of sources, as well as the hypothesis that ULX NS sources are strongly beamed in the direction of the observer. Despite their apparently extreme power output, these NSs appear to be quite similar to Magellanic pulsars and their surface dipolar magnetic fields (0.3-0.4 TG) take some of the lowest values ever found in studies of HMXBs (see also Fig. 1 in Paper III, ).
3 Discussion
We have studied a sample of NS ULX and Magellanic NS HMXB sources that are known to radiate near the Eddington rate or higher during their brightest outbursts. This sample consists of three NS ULX sources and ten HMXB sources as indicated in Table 1 and their X-ray properties and measurements have been summarised and analysed, among all other Magellanic Be/X-ray sources, by Yang et al. (2017) and in Paper III , Paper IV , and Paper V .
This work was motivated by the realization that we have two independent ways of determining the surface dipolar magnetic fields of these NSs: one method relies on the observed X-ray luminosity at the state of minimum accretion (the propeller state) and the assumption that the magnetospheric radius is equal to the corotation radius (Illarionov & Sunyaev, 1975; Stella et al., 1986); the other method uses the observed value of (which is unjustly believed to be highly uncertain) and canonical pulsar parameters to obtain direct estimates of both and from standard accretion theory (Frank et al., 2002; Paper I, ; Paper III, ). These two methods showed good agreement when they were applied to M82 X-2 (Paper III, ), but that result has gone largely unnoticed.
Thus we set out to investigate whether the agreement between the two methods extends to more HMXB pulsars, specifically to those who have exhibited the most powerful outbursts during their 15-20 year monitoring by X-ray observatories. Our results for the ratios are shown in Fig. 1 and the results for the magnetic field values are summarised in Table 2. We have found oustanding agreement between the two deteminations of in conjunction with past predictions for Magellanic HMXB pulsars (Table 1 in Paper V, ). This agreement indicates that there is a strong confluence between theory and observations of HMXB pulsars, which is very encouraging for future investigations and investments in the field. Furthermore, the recent results of Campana et al. (2017) show that the lowest propeller line determined from theory ( vs. ; Stella et al., 1986) and independently from Magellanic pulsars ( vs. ; Paper IV, ) is applicable to all rotating magnetised stars covering eight orders of magnitude in spin period and ten orders of magnitude in magnetic moment.
We close with an observation pertaining to the data listed in Table 1 that leads to an open issue: the results of Yang et al. (2017) and Paper II on accretion discs in Magellanic HMXBs indicate that about half of them are spinning up and the other half are spinning down. On the other hand, Table 1 shows that all nine sources in our sample with measured values are spinning up. It appears then that major type II outbursts (Coe et al., 2010) do not occur when the accretion discs or inflowing streams orbit in the opposite direction relative to the spins of the NSs. There is no concrete explanation for this phenomenon at this time, although it certainly appears that the spinning down NSs during retrograde accretion () produce lower power output emanating from their accretion columns.
Acknowledgments
DMC and SGTL were supported by NASA grant NNX14-AF77G. DK was supported by a NASA ADAP grant.
References
- Bachetti et al. (2014) Bachetti, M., Harrison, F. A., Waltron, D. J., et al. 2014, Nature, 514, 202
- Campana et al. (2017) Campana, S., Stella, L., Mereghetti, S., & de Martino, D. 2017, A&A, in press
- Cappallo et al. (2017) Cappalo, R., Laycock, S. G. T., Christodoulou, D. M., et al. 2017, PASP, 129, 124201 (11pp)
- (4) Christodoulou, D. M., Kazanas, D., & Laycock, S. G. T. 2016a, arXiv:1606.07096 (Paper I)
- (5) Christodoulou, D. M., Laycock, S. G. T., & Kazanas, D. 2017a, MNRAS, 470, L21 (Paper II)
- (6) Christodoulou, D. M., Laycock, S. G. T., Kazanas, D., Cappallo, R., & Contopoulos, I. 2017b, RAA, 17, 63 (Paper III)
- (7) Christodoulou, D. M., Laycock, S. G. T., Yang, J., & Fingerman, S. 2016, ApJ, 829, 30 (Paper IV)
- (8) Christodoulou, D. M., Laycock, S. G. T., Yang, J., & Fingerman, S. 2017c, RAA, 17, 59 (Paper V)
- Coe et al. (2010) Coe, M. J., McBride, V. A., & Corbet, R. H. D. 2010, MNRAS, 401, 252
- Dall’Osso et al. (2016) Dall’Osso, S., Perna, R., Papitto, A., et al. 2016, MNRAS, 457, 3076
- Dauser et al. (2017) Dauser, T., Middleton, M., & Wilms, J. 2017, MNRAS, 466, 2236
- Frank et al. (2002) Frank J., King A., & Raine D. 2002, Accretion Power in Astrophysics, 3rd Edition, Cambridge: Cambridge University Press
- Fürst et al. (2016) Fürst, F., Walton, D. J., Harrison, F. A., et al., 2016, ApJ, 831, L14
- Illarionov & Sunyaev (1975) Illarionov, A. F., & Sunyaev, R. A. 1975, A&A, 39, 185
- Israel et al. (2017a) Israel, G. L., Belfiore, A., Stella, L., et al., 2017a, Science, 355, 817
- Israel et al. (2017b) Israel, G. L., Papitto, A., Esposito, P., et al., 2017b, MNRAS, 466, L48
- Jaisawal & Naik (2016) Jaisawal, G. K., & Naik, S. 2016, MNRAS, 461, L97
- Kawashima et al. (2016) Kawashima, T., Mineshige, S., Ohsuga, K., & Ogawa, T. 2016, PASJ, 68, 83
- Körding et al. (2006) Körding, E. G., Fender, R. P., & Migliari, S. 2006, MNRAS, 369, 1451
- Kunz et al. (1993) Kunz, M., Gruber, D. E., Kendziorra, E., Kretschmar, P., et al. 1993, A&A, 268, 116
- Levine et al. (2000) Levine, A. M., Rappaport, S. A., & Zojcheski, G. 2000, ApJ, 541, 194
- Schmidtke et al. (1995) Schmidtke, P. C., Cowley, A. P., McGrath, T. K., & Anderson, A. L. 1995, PASP, 107, 450
- Shtykovsky et al. (2018) Shtykovsky, A. E., Arefiev, V. A., Lutovinov, A. A., & Molkov, S. V. 2018, Astron. Lett., 44 (3), in press
- Stella et al. (1986) Stella, L., White, N. E., & Rosner, R. 1986, ApJ, 308, 669
- Townsend et al. (2017) Townsend, L. J., Kennea, J. A., Coe, M. J., et al. 2017, MNRAS, 471, 3878
- Tsygankov et al. (2016) Tsygankov, S. S., Mushtukov, A. A., Suleimanov, V. F., & Poutanen, J. 2016, MNRAS, 457, 1101
- Weng et al. (2017) Weng, S.-S., Ge, M.-Y., Zhao, H.-H., et al. 2017, ApJ, 843, 69
- Yang et al. (2017) Yang, J., Laycock, S. G. T., Christodoulou, D. M., et al. 2017, ApJ, 839, 119
- Yokogawa et al. (2003) Yokogawa, J., Imanishi, K., Tsujimoto, M., Koyama, K., & Nishiuchi, M. 2003, PASJ, 55, 161