Gigahertz-peaked spectra pulsars in Pulsar Wind Nebulae
Abstract
We have carried out a detailed study of the spectral nature of six pulsars surrounded by Pulsar wind nebulae (PWN). The pulsar flux density were estimated using the interferometric imaging technique of the Giant Metrewave Radio Telescope at three frequencies 325 MHz, 610 MHz and 1280 MHz. The spectra showed a turnover around gigahertz frequency in four out of six pulsars. It has been suggested that the gigahertz peaked spectra (GPS) in pulsars arises due to thermal absorption of the pulsar emission in surrounding medium like PWN, HII regions, Supernova remnants, etc. The relatively high incidence of GPS behaviour in pulsars surrounded by PWN impart further credence to this view. The pulsar J17472958 associated with the well known Mouse nebula was also observed in our sample and exhibited GPS behaviour. The pulsar was detected as a point source in the high resolution images. However, the pulsed emission was not seen in the phased array mode. It is possible that the pulsed emission was affected by extreme scattering causing considerable smearing of the emission at low radio frequencies. The GPS spectra were modeled using the thermal free-free absorption and the estimated absorber properties were largely consistent with PWN. The spatial resolution of the images made it unlikely that the point source associated with J17472958 was the compact head of the PWN, but the synchrotron self-absorption seen in such sources was a better fit to the estimated spectral shape.
keywords:
pulsars: general - pulsars: individual: J17024128, J17183825, J17472958, J18091917, J1857+0143, J1913+1011.1 Introduction
The radio emission from pulsars are characterized by a steep power law spectrum with typical spectral index around 1.6 (Lorimer et al., 1995; Maron et al., 2000; Jankowski et al., 2017) over a wide frequency range from 0.1 – 10 GHz. A new spectral type in radio pulsars was identified by Kijak et al. (2007) where the pulsar spectra were observed to show a turn over around gigahertz frequencies. These sources are called gigahertz-peaked spectrum (GPS) pulsars and only a handful of such sources are known. A systematic search for GPS pulsars have been conducted since the initial discovery (Kijak et al., 2011a, b, 2013; Dembska et al., 2014, 2015a, 2015b; Basu et al., 2016; Kijak et al., 2017; Jankowski et al., 2017) with seventeen pulsars confirmed to exhibit GPS behaviour. The GPS pulsars are usually associated with young energetic sources which are found in peculiar environments like Pulsar wind nebulae (PWN), HII regions, Supernova remnants (SNR), etc. This motivated Kijak et al. (2011b); Lewandowski et al. (2015a); Rajwade, Lorimer & Anderson (2016) to suggest the thermal absorption model based on the initial ideas of Sieber (1973), where the pulsar emission is absorbed in the specialized environments, as a likely candidate for GPS behaviour in pulsars. The model has been subsequently used by Basu et al. (2016); Kijak et al. (2017) to successfully explain the spectral behaviour in a majority of GPS pulsars. The environmental effect on the pulsar spectrum is further highlighted by the observation that out of seventeen known GPS pulsars four pulsars are associated with PWN. This high incidence of GPS behaviour near PWNs make them likely candidates for potential exploration of GPS behaviour.
The GPS pulsars based on their peculiar environments are usually associated with relatively high dispersion measures with values usually greater than 200 pc cm-3. This further implies that these sources are affected by scattering (Lewandowski et al., 2013; Lewandowski, Kowalińska & Kijak, 2015b). In such cases the standard pulsar observation techniques results in serious underestimation of the pulsar flux density due to the presence of long scattering tails. Dembska et al. (2015a) showed that interferometric imaging provides the only possible way to securely measure the flux density in highly scattered pulsar profiles. Additionally, Basu et al. (2016) also demonstrated that the interferometric techniques were vastly superior to the standard pulsar flux density measurements from a phased-array owing to the possibility of self calibration. In this work we attempt to look for GPS behaviour in six pulsars with associated PWN by characterising their spectral nature around gigahertz frequencies. We have employed the interferometric studies to measure the pulsar flux density at each observing frequency. In addition a detailed modeling using the thermal absorption model has been carried in each case where a GPS behaviour is identified.
2 Observing details
The observations were conducted using the Giant Metrewave Radio Telescope (GMRT) located near Pune, India. The observations were primarily carried out using standard interferometric schemes with strategically spaced calibrators interspersed with the sources as detailed in Dembska et al. (2015a). In one pulsar J17472958 we observed simultaneously in the phased-array mode along with the interferometric observations (Basu et al., 2016) to look for pulsed emission. The sources were observed at three different frequencies 325 MHz, 610 MHz and 1280 MHz to characterize the low radio frequency spectra and search for GPS behaviour. The 610 MHz observations were conducted in August 2015, while the 325 MHz and 1280 MHz observations were carried out between November and December 2016. Additionally, the pulsar J17472958 was also observed separately between April to May 2017 at all three frequencies to check the variability in the measured flux density. We observed each pulsar for approximately one hour duration. The flux calibrators 3C286 and 3C48 were observed during each observing run to calibrate the flux density scale. In addition the two phase calibrators 1714252 and 1822096 were observed at regular intervals to correct for the temporal variations as well as fluctuations in the frequency band. The flux scales of 3C48 and 3C286 were set using the estimates of Perley & Butler (2013) and used to calculate the flux density of the different phase calibrators during each observing session as shown in Table 1. The observing mode during each session is also shown in the table with IA corresponding to interferometric array and PA to phased-array observations. The imaging analysis was carried out using the Astronomical Image Processing System (AIPS) similar to Dembska et al. (2015a); Basu et al. (2016). Initially all the six sources were observed at 610 MHz to look for GPS nature. In The subsequent observations at 325 MHz and 1280 MHz we only followed up on the four sources which indicated turnover in the spectra.
| Obs Date | Phase Calibrator | Calibrator Flux | Obs Mode |
|---|---|---|---|
| (Jy) | |||
| 325 MHz | |||
| 12 November, 2016 | 1714252 | 5.1,0.4 | IA |
| 26 November, 2016 | 1714252 | 5.0,0.3 | IA |
| 30 April, 2017 | 1714252 | 5.0,0.3 | IA,PA |
| 27 May, 2017 | 1714252 | 5.0,0.3 | IA,PA |
| 610 MHz | |||
| 15 August, 2015 | 1714252 | 4.7,0.3 | IA |
| 1822096 | 6.1,0.4 | ||
| 29 August, 2015 | 1714252 | 4.5,0.3 | IA |
| 1822096 | 6.0,0.4 | ||
| 10 May, 2017 | 1714252 | 4.8,0.3 | IA,PA |
| 27 May, 2017 | 1714252 | 5.2,0.3 | IA,PA |
| 1280 MHz | |||
| 14 November, 2016 | 1714252 | 2.5,0.2 | IA |
| 11 December, 2016 | 1714252 | 1.7,0.1 | IA |
| 28 April, 2017 | 1714252 | 2.4,0.2 | IA,PA |
3 Results
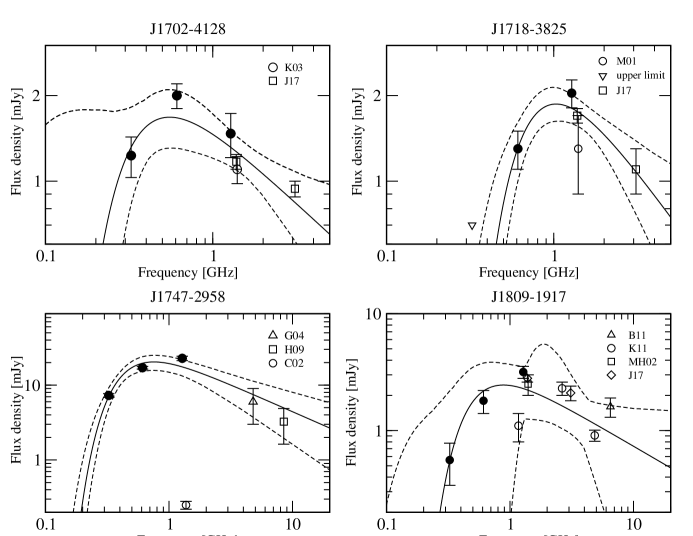
In Table 2 we report the measured flux density of the pulsars at the three frequencies. For two cases J1857+0143 and J1913+1011 the flux density was measured initially at 610 MHz and indicated a typical power law spectra. As a result they were not observed subsequently at the other frequencies. In all pulsars except J17472958 the pulsar were seen as a point source without any indication of the diffuse PWN. The associated PWN in each case were identified in X-ray observations (Kargaltsev & Pavlov, 2010). The pulsar J17472958 is associated with the bow shock nebulae G359.23-0.82 also known as the Mouse nebula (Yusef-Zadeh & Bally, 1987; Camilo et al., 2002). The extended nebula was seen at each of the frequencies. The pulsar was detected as a point source in high resolution images as discussed in the next section. In the four pulsars J17024128, J17183825, J17472958 and J18091917 the low frequency flux density showed a turnover in the spectra indicating GPS behaviour. A detailed spectral fit in each of these four cases was estimated using the thermal absorption model as described below. The spectral nature of each pulsar is shown in figure 1.
| Flux (mJy) | |||
|---|---|---|---|
| Pulsar | 325 MHz | 610 MHz | 1280 MHz |
| J17024128 | 1.20.2 | 2.00.2 | 1.50.3 |
| J17183825 | 0.7 | 1.30.2 | 2.00.2 |
| J17472958 | 7.40.6 | 17.81.0 | 25.21.7 |
| 6.70.5 | 15.30.9 | 16.51.2 | |
| 7.30.6 | 15.20.9 | ||
| J18091917 | 0.60.2 | 1.80.4 | 3.20.4 |
| J1857+0143 | — | 2.30.3 | — |
| J1913+1011 | — | 3.40.2 | — |
3.1 Thermal absorption of Pulsar emission
| Pulsar | |||||
|---|---|---|---|---|---|
| K-1.35 pc cm-6 | (GHz) | ||||
| J17024128 | |||||
| J17183825 | |||||
| J17472958 | |||||
| J18091917 |
The thermal free-free absorption has been used to model the GPS behaviour by Lewandowski et al. (2015a). This method was further demonstrated in the subsequent works of Basu et al. (2016); Kijak et al. (2017) to explain the spectral behaviour in a majority of GPS pulsars. The unabsorbed intensity is expressed as a simple power law = with the observed spectrum given as :
| (1) |
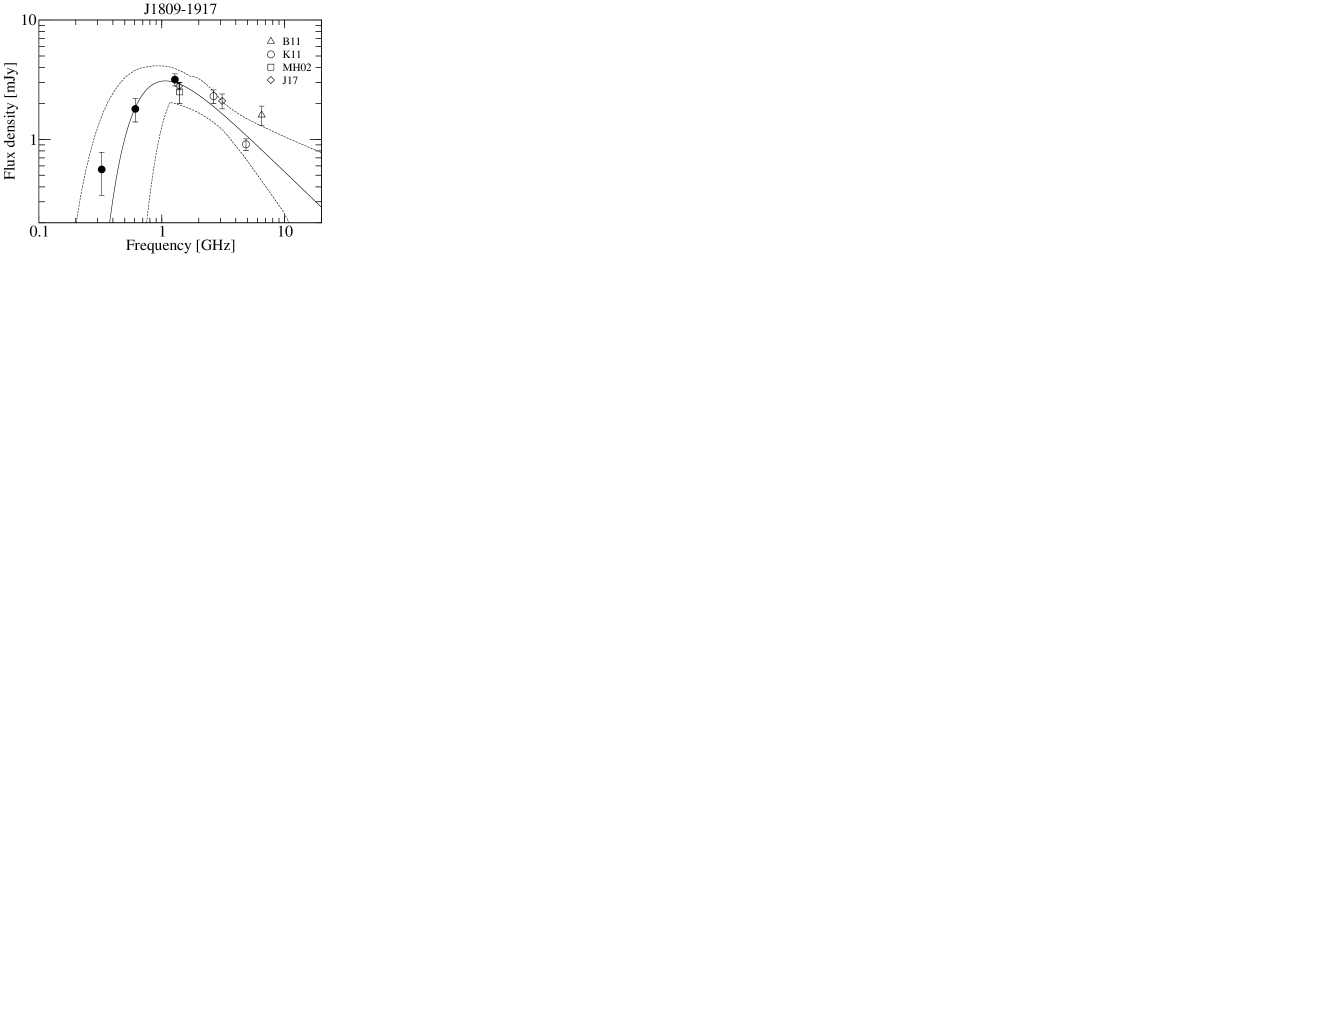
where is the amplitude (i.e. the pulsar intrinsic flux density at 10 GHz), the intrinsic spectral index of the pulsar and EM, EM being the emission measure. The best fit to the measured spectra were obtained using the Levenberg-Marquardt least squares algorithm, with , and as free parameters of the fit. Finally, mapping was used to estimate the errors in the fitting parameters. Table 3 shows the details of the fitting process in the four pulsars. The table also shows the estimated peak frequency, , of the spectra from the fits. In case of PSR J17183825 the source was not detected at 325 MHz (only upper limit established) and there were only three measurements for fitting the three parameter model. We assumed an intrinsic spectral index = , which is the average spectral index in the pulsar population (Lorimer et al., 1995; Maron et al., 2000; Jankowski et al., 2017), and estimated the other parameters as shown in Table 3. In Kijak et al. (2017) the spectral nature of the pulsar J18091917 was estimated using only high frequency measurements ( 1 GHz). We have now carried out lower frequency measurements for this pulsar and considerably improved the spectral nature as well as the fitting parameters. The resultant spectral fits along with the 1 envelopes are also shown in figure 1. In the case of PSR J18091917 it was found that the flux measurements at 1.2 GHz (Kijak et al., 2011b) using the phased array mode was from a noisy profile with weak signal (the profile is shown in Appendix of Lewandowski et al., 2013). This resulted in lower values of the flux density and considerably degraded the fitting estimates. Our current interferometric measurements at 1280 MHz provided coverage at this frequency range. In figure 2 we show improved fits to the spectral parameters after excluding the 1.2 GHz values which are reported in the tables.
4 PSR J17472958 associated with Mouse Nebula
 |
 |
|---|---|
 |
 |
 |
 |
As discussed in the previous section the standard imaging schemes revealed the detailed PWN associated with PSR J17472958 as shown in figure 3 (left panel). In order to detect the pulsar we carried out high resolution maps for this source. The interferometric imaging involves measuring correlated signals between antenna pairs recorded in a co-ordinate system known as the -plane. The points in the -plane, also known as baselines, corresponds to projected distances between the antenna pairs and records signals from the sky in the fourier domain. The standard imaging technique involves reconstructing the relevant part of the sky by carrying out properly weighted fourier transforms of the signals recorded in the domain. Hence, the scales of structure in the sky plane are inversely associated with the baselines in the -plane, i.e. the large scale diffuse structures are captured by the short baselines while the point sources are more prominent at longest baselines. The high resolution images involve using only the longest baselines in the -plane to reconstruct the map of the observed sky. This would ensure that the extended sources are resolved out and only the point sources in the sky are seen in the images. The results of the high resolution maps for the pulsar J17472958 are also shown in figure 3 (right panel). The synthesized beam (representing the telescope resolution) is also shown in each case. It is clearly seen that in the high resolution maps the diffuse emission is resolved out leaving behind the pulsar which appear as a point source having the same size as the synthesized beam. It can be argued that some amount of the PWN is left behind in the high resolution maps contaminating the pulsar flux density. It should be noted that the measured flux density of the pulsar is lowest at 325 MHz and highest at 1280 MHz (see Table 2). However, the synthesized beam size is highest at 325 MHz, around 8 arcseconds, and decreases with increasing frequency, around 4 arcseconds at 610 MHz and 2 arcseconds at 1280 MHz. If the diffuse emission contributes to the measured flux density then owing to the largest beam size at 325 MHz the measured flux density should also be highest at this frequency and decrease with increasing frequency which is contrary to observations. This ensures that the measured flux density from the high resolution maps correspond to the pulsar J17472958 which is an unresolved point source. We also tried to carry out high resolution maps from the archival data at 4.8 GHz (Gaensler et al., 2004) and 8.5 GHz (Hales et al., 2009) observed using the Very Large Array (VLA). However, these observations were conducted during the more compact array configurations of VLA (C and D configurations). This implied that the coverage was sparse at the longest baselines making such high resolution studies untenable. For a comparison the maximum baseline length is 0.6 kilometers in the VLA D configuration which corresponds to lengths of 10-15 k at these observing frequencies, while the longest baseline length for GMRT at the L-band is around 125 k. We have used the peak flux density values with a 50% error bar as an approximation for the pulsar flux density to estimate the high frequency spectra for the fitting purpose.
The pulsar J17472958 has been discovered by Camilo et al. (2002) at 1374 MHz using the Parkes radio telescope. They reported the measured flux density to be 0.250.03 mJy. However, they did not detect the pulsar in a pulsar-gated radio imaging with the Australia Telescope Compact Array (ATCA). The flux density measurements are significantly lower than the our estimated values. It is most likely that the pulsar emission is affected by significant scattering. This would modify the pulsar emission and result in an extended scattering tail. As a result the pulsar flux density will be spilled over the profile baseline and considerably reduce the estimated flux density using standard pulsar observations (Dembska et al., 2015a). It should also be noted that gating observations which involve “on-pulse minus off-pulse” images are also not adequate for such studies since the flux density is spilled over in the off-pulse window and gets subtracted. In our later observations carried out between April-May 2017, we simultaneously observed in the phased array mode and the interferometric mode of GMRT (Basu et al., 2016). But the pulsar profile was not detected in the phased array observations. If the pulsar is indeed scattered then this is understandable since the peak flux density would be below our detection levels (noise rms of 0.1-0.2 mJy at 1280 MHz). It should be noted that scattering characteristic decay time () typically scales as with frequency (Lewandowski et al., 2013), which makes lower frequency detections impossible. Higher frequency observations greater than 2 GHz would be necessary to characterize the scattering in this pulsar.
The fact, that we could not detect the pulsed emission from PSR J17472958, and the above mentioned low flux density value of the pulsar measured by Camilo et al. (2002) suggest another possibility. The unresolved point source detected in our maps at the tip of the Mouse nebula might also correspond to a compact emission from the PWN. The minimum size of the emission is 2 arcseconds (at the highest frequency). The estimated distance to the nebulae is between 2-5 kiloparsecs (Camilo et al., 2002; Gaensler et al., 2004). This corresponds to the size of the point source to be around 0.02-0.05 parsec. The typical size of the comet’s head, where the shock is located, in a comet-shaped bow-shock PWNe is of the order of 1 parsec (see for example Bucciantini, 2002), which is well beyond the estimated size of the point source. But at the moment we cannot conclusively exclude the possibility of a very compact PWN, or a “hot spot” inside it, that could be much smaller.
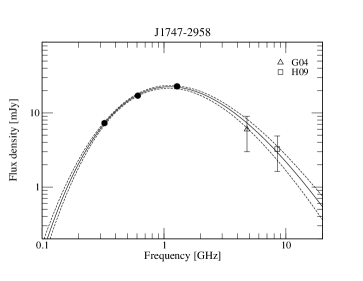
If the emission originates from a compact nebula the synchrotron self-absorption mechanism in the relativistic pulsar wind becomes important. This will also lead to a likely turnover at the low frequency regime. To explore this possibility we modeled the spectra (excluding the measurements of Camilo et al., 2002) using a synchrotron self-absorption spectrum with the functional form (Izvekova et al., 1981):
| (2) |
where GHz similar to the earlier thermal absorption fits, being the synchrotron self absorption critical frequency, is a flux scaling constant, is the synchrotron spectral index and is the turnover smoothness parameter.
The result of the fitting process is shown in Figure 4. The fitting was performed using four free parameters, and the best fit values are: normalized , mJy, GHz, and . The values of and are well within the bounds allowed for the synchrotron self-absorption model. As seen in the figure the spectral nature is better represented by the fits from this model. However, the size of the point source in our maps is much smaller (0.05 parsec) compared to the size of a typical PWN (1 parsec). This makes it more likely that despite the better fits from the synchrotron self absorption model compared to the thermal absorption model, the source is actually the pulsar. With the possibility of strong interstellar scattering discussed above, only the high frequency observations ( 2 GHz) using single dish or phased-array can help us measure the clean pulsar profile and compare with interferometric flux values. This would conclusively resolve the origin of the point source seen in the high resolution maps.
5 The GPS behaviour in PWN
| Pulsar | DM | Age | Size | ne | EM | T |
|---|---|---|---|---|---|---|
| (pc cm-3) | (yr) | (pc) | (cm-3) | ( pc cm-6) | (K) | |
| J17024128 | 5.51 | 0.1 | 1835.53.5 | 33.690.13 | ||
| 1.0 | 183.550.35 | 3.3690.013 | ||||
| 10.0 | 18.3550.035 | 0.33690.0013 | ||||
| J17183825 | 8.95 | 0.1 | ||||
| 1.0 | ||||||
| 10.0 | ||||||
| J17472958 | 2.55 | 0.1 | ||||
| 1.0 | ||||||
| 10.0 | ||||||
| J18091917 | 5.13 | 0.1 | ||||
| 1.0 | ||||||
| 10.0 |
There are around 70 known PWN mostly discovered from X-ray observations. The X-ray from PWN is emitted due to synchrotron radiation from relativistic pulsar winds shocked in the ambient medium (Kargaltsev & Pavlov, 2010; Kargaltsev, Rangelov & Pavlov, 2013). Amongst these there are around 40 sources where the associated radio pulsar has been discovered. We have surveyed these radio pulsars and found around 20 sources which are in the GMRT declination range. The detailed low frequency spectra, around GHz frequencies, using the GMRT have been established in ten pulsars. In this work we have studied six pulsars, additionally the pulsar J1740+1000 is reported in Kijak et al. (2011a); Dembska et al. (2014), B180021 in Basu et al. (2016), B182313 and J1856+0245 in Kijak et al. (2017). PSR J1856+0245 was not detected at 610 MHz, but the upper limits indicate the spectral shape to be much flatter. Only in two pulsars reported here, J1857+0143 and J1913+1011, the spectra resemble a typical power law. The role of the pulsar environment in their GPS behaviour have been highlighted in previous works (Kijak et al., 2011a; Lewandowski et al., 2015a). There are at present twenty confirmed cases of GPS pulsars out of which seven sources are associated with PWN. The preponderance of GPS pulsars associated with PWN provides further evidence for this hypothesis. It has been suggested that the intrinsic flux density of young and energetic pulsars associated with PWN are usually small (Camilo et al., 2002). However, as J17472958 suggests the pulsars in such systems are usually associated with scattering which would result in severe underestimation of the flux density using standard single dish measurements (Dembska et al., 2015b). In addition the GPS nature would imply that the low frequency flux density is much lower than expected from a typical power law spectra. This also makes the detection of pulsars associated with PWN below GHz frequencies much more difficult. The remaining pulsars with associated PWN where the low frequency spectra is not established should provide rich ground for discovering more GPS behaviour, with the interferometric studies being the preferred mode of flux density measurement.
Finally, we investigate the physical properties of the absorbing medium in the four GPS pulsars reported here based on spectral fits of the thermal absorption model. It should be noted that spectral fits reported in this work are affected by the sparse sampling of the low frequency regime. There are only a few flux density measurements below 1 GHz to suitably constrain the parameters of the fit. There is a paucity of the frequency coverage in interferometric arrays like GMRT where observations can be carried out over a short band centered around specific frequencies. This situation will be remedied in the future when newer Telescopes and suitable upgrades to existing ones will allow a continuous frequency coverage. In such cases the model parameters can be constrained to higher accuracy. However, for our present purpose we used the estimated parameters as indications of the nature of the absorbing medium and explore their properties. As explained in Lewandowski et al. (2015a); Rajwade, Lorimer & Anderson (2016) the free electrons present in the ISM and the absorbing medium contribute to both the dispersion and thermal absorption. If we assume an absorber of size and free electron density uniformly distributed, the emission measure is given as EM=. The contribution to the dispersion measure is DM=. As discussed in previous works the different quantities are correlated and would require additional inputs like size of the absorbing region as well as contribution of the electron density of the absorber to the DM.
In the absence of any measurements of the absorber parameters like their size, electron density or free electron temperatures we have carried out some speculative estimates from the known environment of young pulsars using the fitting parameters of the thermal absorption model. We have investigated three primary absorbers found around young pulsar, viz., dense filaments of SNR, PWN and HII regions. In Table 4 we show the requirements of the physical properties of the absorber from the fitting parameters of each pulsar. The top row corresponds to SNR filaments with typical size of 0.1 parsec, the middle row for PWN with sizes of 1 parsec and the bottom row corresponding to HII regions of size 10 parsec. We have assumed that contribution of the DM for each observer to be DM=0.5DM, and using the size = 0.1,1,10 parsec, respectively, the electron densities were calculated in Table 4. We further estimated the EM as explained above using and . We used the fitting parameter (see eq.1, and the discussion below it) to calculate the free electron temperatures () which are also reported in the Table. In case of HII regions the estimated are between 5 and 20 while are between 30 and 450 K. These values make it unlikely for the HII region to be potential absorber. It is possible to have electron densities between 10 - 100 in large HII regions but the corresponding electron temperatures are much higher between 1000 and 10000 K (Tsamis et al., 2003). It should be noted that if we reduce the contribution of DM to be less than 0.5DM the estimates will be even lower. In the case of SNR filaments the required densities are between 500 and 2000 and are between 1000 and 15000 K. These conditions are consistent with previously reported measurements in the SNR filaments (Koo et al., 2007). It should also be noted that for the thermal absorption model to work, the location of the absorber need not be in the immediate vicinity of the source but merely along the line of sight. But one drawback for the SNR filaments to be the likely absorber is that their typical size is very small (0.1 parsec) which reduces the probability of their presence along the line of sight to the pulsar. Finally, the most probable absorber are the PWN since their presence is known around these pulsars. The values for the four pulsars in this case are between 50 and 200 , and the corresponding are between 150 and 2500 K. Lewandowski et al. (2015a) explored a simplified model of the asymmetric bow-shocked PWN, assuming an uniform electron density and temperature across the medium, and showed that the GPS behaviour is affected by the line of sight towards the PWN. For instance the line of sights passing through the tail would cover the maximum absorber size and result in GPS spectra. However, the spectra would likely resemble a typical power law if the line of sight passes towards the head of the bow shock. This is a possible explanation for the two pulsars in our sample which show a typical power law spectra. The typical power law spectra would also be possible if the PWN shape is not asymmetric like in a bow-shock nebula but more spherically symmetric as in the younger Crab pulsar. However, the characteristic age of both pulsars J1857+0143 and J1913+1011 are similar to the other GPS pulsars studied here. In case of the mouse nebulae associated with the pulsar J17472958, the distance to the source has been estimated to be 2-5 kiloparsecs (Camilo et al., 2002; Gaensler et al., 2004). The angular size of the nebula in our maps is 1 arcminute which gives an approximate size of the PWN to be around 1 parsec. In the PWN associated with the pulsar B1951+32 the electron density in front of the shock front was estimated from emission lines to be 50–100 cm-3 (Hester & Kulkarni, 1989; Li et al., 2005). If we assume the above quantities to be typical values of the absorber in PWN then the estimated parameters for the four pulsars in table 4 are largely consistent.
6 Summary
A detailed measurement of the flux density around gigahertz frequencies were carried out for six pulsars associated with PWN using interferometric mode of GMRT. The low frequency spectra indicated the presence of GPS behaviour in four out of six pulsars. There are twenty GPS pulsars know at present out of which seven pulsars are associated with PWN. In the case of the pulsar J17472958 associated with the well known Mouse nebula, high resolution imaging resulted in correct estimation of the pulsar flux density at low frequencies. The previous measurement of the pulsar flux density using standard pulsar mode observations appears to be seriously underestimated as the pulsar is likely to be affected by scattering. However, there is a possibility that the point source is associated with a very compact emission at the head of the PWN, though the size estimates makes this extremely unlikely. The synchrotron self-absorption in this scenario gives an accurate model of the spectral nature. The GPS spectra in each pulsar was modeled using the thermal free-free absorption. The speculative estimation of the absorber properties using the thermal absorption model were largely consistent with known physical conditions in PWN.
Acknowledgments
We thank the anonymous referee for the comments which helped to improve the paper. We thank the staff of the GMRT who have made these observations possible. The GMRT is run by the National Centre for Radio Astrophysics of the Tata Institute of Fundamental Research. This research was partially supported by the grant DEC-2013/09/B/ST9/02177 of the Polish National Science Centre.
References
- Basu et al. (2016) Basu, R., Rożko, K., Lewandowski, W., Kijak, J., Dembska, M., 2016, MNRAS, 458, 2509
- Bates et al. (2011) Bates, S. D., Johnston, S., Lorimer, D. R., et al. 2011, MNRAS, 411, 1575
- Bucciantini (2002) Bucciantini, N. 2002, A&A, 387, 1066
- Camilo et al. (2002) Camilo, F.; Manchester, R. N.; Gaensler, B. M.; Lorimer, D. R. 2002, ApJ, 579, 25
- Dembska et al. (2014) Dembska M., Kijak J., Jessner A., Lewandowski W., Bhattacharyya B., Gupta Y. 2014, MNRAS, 445, 3105
- Dembska et al. (2015a) Dembska M., Kijak J., Koralewska O., Lewandowski W., Melikidze G., Ro˙zko K., 2015a, Ap&SS, 359, 31
- Dembska et al. (2015b) Dembska M., Basu R., Kijak J., Lewandowski W., 2015b, MNRAS, 449, 1869
- Gaensler et al. (2004) Gaensler, B. M.; van der Swaluw, E.; Camilo, F.; Kaspi, V. M.; Baganoff, F. K.; Yusef-Zadeh, F.; Manchester, R. N. 2004, ApJ, 616, 383
- Hales et al. (2009) Hales, C. A., Gaensler, B. M., Chatterjee, S., van der Swaluw, E., Camilo, F., 2009, ApJ, 706, 1316
- Hester & Kulkarni (1989) Hester, J. J., Kulkarni, S. R. 1989, ApJ, 340, 362
- Izvekova et al. (1981) Izvekova V. A., Kuzmin A. D., Malofeev V. M., Shitov I. P., 1981, Ap&SS, 78, 45
- Jankowski et al. (2017) Jankowski, F., van Straten, W., Keane, E.F., Bailes, M., Barr, E., Johnston, S., Kerr, M., 2017, accepted in MNRAS, doi:10.1093/mnras/stx2476
- Kargaltsev & Pavlov (2010) Kargaltsev, O., Pavlov, G. G., 2010, AIPC, 1248, 25
- Kargaltsev, Rangelov & Pavlov (2013) Kargaltsev, O.; Rangelov, B.; Pavlov, G., The Universe Evolution: Astrophysical and Nuclear Aspects. Edited by I. Strakovsky and L. Blokhintsev. Nova Science Publishers, 2013, p. 359-406
- Kijak et al. (2007) Kijak J., Gupta Y., Krzeszowski K. 2007, A&A, 462, 699
- Kijak et al. (2011a) Kijak, J., Dembska, M., Lewandowski, W., Melikidze, G., Sendyk, M. 2011a, MNRAS, 418, L114
- Kijak et al. (2011b) Kijak, J., Lewandowski, W., Maron, O., Gupta, Y., Jessner, A. 2011b, A&A, 531, A16
- Kijak et al. (2013) Kijak, J., Tarczewski, L., Lewandowski, W., Melikidze, G. 2013, ApJ, 772, 29
- Kijak et al. (2017) Kijak, J., Basu, R., Lewandowski, W., Rożko, K., Dembska, M. 2017, ApJ, 772, 29
- Koo et al. (2007) Koo B.-C., Moon D.-S., Lee H.-G., Lee J.-J., Matthews K., 2007, ApJ, 657, 308
- Kramer et al. (2003) Kramer, M., Bell, J. F., Manchester, R. N., et al. 2003, MNRAS, 342, 1299
- Lewandowski et al. (2013) Lewandowski, W., Dembska, M., Kijak, J., Kowalińska, M. 2017, ApJ, 840, 108
- Lewandowski et al. (2015a) Lewandowski, W., Rożko, K., Kijak, J., Melikidze, G.I. 2015a, ApJ, 808, id:18
- Lewandowski, Kowalińska & Kijak (2015b) Lewandowski, W., Kowalińska, M., Kijak, J., 2015b, MNRAS, 449, 1570
- Lewandowski et al. (2015c) Lewandowski, W., Rożko, K., Kijak, J., Bhattacharyya, B., Roy, J., 2015c, MNRAS, 454, 2517
- Li et al. (2005) Li, X. H., Lu, F. J., Li, T. P. 2005, ApJ, 628, 931
- Lorimer et al. (1995) Lorimer, D.R., Yates, J.A., Lyne, A.G., Gould, D.M. 1995, MNRAS, 273, 411
- Manchester et al. (2001) Manchester, R. N., Lyne, A. G., Camilo, F., et al. 2001, MNRAS, 328, 17
- Morris et al. (2002) Morris, D. J., Hobbs, G., Lyne, A. G., et al. 2002, MNRAS, 335, 275
- Maron et al. (2000) Maron O., Kijak J., Kramer M., Wielebinski R., 2000, A&A,147, 195
- Perley & Butler (2013) Perley, R. A., Butler, B. J. 2013, ApJS, 204, 19
- Rajwade, Lorimer & Anderson (2016) Rajwade, K., Lorimer, D.R., Anderson, L.D., 2016, MNRAS, 455, 493
- Sieber (1973) Sieber, W., 1973, A&A, 28, 237
- Tsamis et al. (2003) Tsamis Y. G., Barlow M. J., Liu X.-W., Danziger I. J., Storey P. J., 2003, MNRAS, 338, 687
- Yusef-Zadeh & Bally (1987) Yusef-Zadeh, F.; Bally, J. 1987, Nature, 330, 455