Simultaneous Detection of H and D NMR Signals in a micro-Tesla Field
Abstract
We present NMR spectra of remote-magnetized deuterated water, detected in an unshielded environment by means of a differential atomic magnetometer. The measurements are performed in a T field, while pulsed techniques are applied –following the sample displacement– in a 100 T field, to tip both D and H nuclei by controllable amounts. The broadband nature of the detection system enables simultaneous detection of the two signals and accurate evaluation of their decay times. The outcomes of the experiment demonstrate the potential of ultra-low-field NMR spectroscopy in important applications where the correlation between proton and deuteron spin-spin relaxation rates as a function of external parameters contains significant information.
![[Uncaptioned image]](/html/1712.03858/assets/x1.png)
I Introduction
Experimental NMR relaxation parameters such as spin-lattice relaxation rates, , spin-spin relaxation, , and spin-lattice relaxation in the rotating frame, , show a dependence on the fluctuation of local magnetic fields coupled with the nuclear magnetic moment observed. While proton relaxation in diamagnetic systems is dominated by fluctuations in the dipole-dipole interactions between proton nuclei and its magnetic environment, deuteron relaxation mechanism is dominated by fluctuations in the electric field gradient around the nucleus. Both and of proton and deuteron were used to study the dynamic and structural properties of complex biosystems in solution palmer_cr_04 . relaxation rates for proton and deuteron are both dependent on the spectral densities of the fluctuating dipolar and quadrupolar interaction at and respectively, being the Larmor angular frequency. The spin-spin relaxation, , is also affected by the low-frequency components of the spectral density. This behaviour makes suitable for the investigation of fast and intermediate dynamic processes, while is more sensitive and better suited to studying slow motion processes (where, in the case of high-field conventional NMR, fast means s, intermediate is in the range of s, and slow motion is when s). In the past, the deuteron transverse relaxation rate constant, , was used to analyse the slow motion behaviour of phospholipid bilayer membranes bloom_bc_87 and dendrimer macromolecules metzer_mrm_92 , as well as to discriminate between tissues under physiological and pathological conditions block_mrm_87 ; ababneh_mrm_05 . Similarly, proton spin-spin relaxation has been investigated in the study of slow frequency dynamics in complex systems case_acr_02 ; barbieri_pol_98 ; akke_jac_96 .
Both proton and deuterium spin-spin relaxation rates have been investigated to quantify protein dynamics kay_bcb_98 , pore and collagen-bound water in cortical bone and cartilage ong_jbmr_12 , and water behaviour in mesoporous materials wehrli_jmr_13 , as well as for other scientific and technological applications reiter_mrm_09 ; steiner_jpca_11 ; huang_mrm_13 ; birdwell_ef_15 ; raj_plosone_14 ; cabrales_amr_08 ; meng_bt_13 . A relationship exists between proton and deuteron relaxation rates and is best investigated if both sets of measurements are obtained using the same sample and under the same experimental conditions. In other words, any possible correlation between proton and deuteron spin-spin relaxation rates must result from experiments in which the measurements of of both proton and deuteron can be determined simultaneously.
In the present paper we show a new method for the determination of of both proton and deuteron nuclei, using an apparatus for nuclear magnetic resonance at ultra-low magnetic fields. We take advantage of the potentialities of NMR detection at ultra-low fields to register signals containing both D and H contributions and make use of non-inductive sensors with a flat response over the whole frequency range of interest.
Ultra-low field NMR has been performed using superconducting quantum interference devices (SQUIDs) for almost three decades pines_prl_83 and with atomic optical magnetometers (AOMs) for more than one romalis_prl_05 . Compared to SQUIDs, AOMs have the advantage of not requiring cryogenics, which facilitates the sensor-sample coupling and simplifies the setups. Our efforts have been concentrated on developing robust setups operating in unshielded environments. This choice further simplifies the apparatus, at the expense of sensitivity levels about one order of magnitude worse than achievable with similar AOMs having the same bandwidth but operating in shielded volumes.
This work has been accomplished with an apparatus in which samples are remotely magnetized and pneumatically shuttled to the sensor head. Selective tipping of individual spin species is accomplished reinforcing the bias field for the duration of the tipping pulse. Once rotated by certain amount the spins precess at frequencies as low as few tens of Hz and are detected using a broadband non inductive sensor.
II Magnetometer experimental set-up
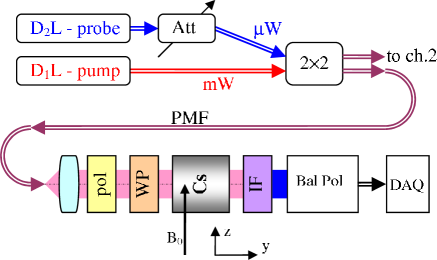
The non-inductive detection is based on an atomic magnetometer using optically pumped Cs vapour bevilacqua_apb_16 . The AOM used has two identical arms enabling the application of a differential technique to reject the ambient noise. Each arm (see Fig. 1) contains a gas buffered Cs cell illuminated by circularly polarized laser light resonant with the line (pump laser) and by weak linearly polarized laser light nearly resonant with the line (probe laser). The two radiations are collimated into a beam –10 mm in diameter– propagating along the direction, while a homogeneous magnetic field in the T range is transversely oriented along .
The AOM consists of a Bell&Bloom bellandbloom61 apparatus where the optically induced magnetization of the atomic vapour precesses around a magnetic field made of a dc bias superimposed on a much weaker field under measurement which is produced by the precessing nuclei (more details are given in Refs.bevilacqua_jmr_16 ; bevilacqua_apb_16 ). The bias field is accurately controlled in terms of intensity, direction and inhomogeneities.
The polarimetric signal consists of a nearly sinusoidal term, whose frequency is the modulation frequency of the pump laser wavelength, and is resonant with the atomic precession frequency. Any change in the bias field results in a slight phase variation of the polarimetric signal, similarly a damped harmonic oscillator driven by a near resonant signal.
The total phase of the polarimetric signal (which corresponds to the atomic Larmor precession angle) is inferred and the phase , which is weakly dependent upon time (), makes it possible to determine the Faraday rotation associated with the time-dependent magnetic field within a bandwidth spanning from dc up to a few hundred Hz.
Common-mode field variations generated by distant noise sources induce equal changes in the phases measured at the two arms, while local sources (C in the inset of Fig. 2) produce difference-mode field variations, which appear with opposite signs. Thus a differential (gradiometric) measurement provides a common-mode free signal driven by the nuclear precession in the sample.
The two arms of the magnetometer are displaced from each other by a baseline of along the direction. The magnetometer resonance line has a linewidth of the order of 30 Hz and ensures a sensitivity of in the frequency range Hz.
III NMR spectroscopy experimental set-up
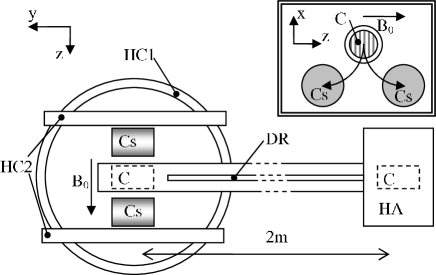
The experimental set-up for nuclear spin polarization, transport and manipulation is represented in Fig.2. The sample to be analyzed is contained in a 5 cm3 cartridge. It is first magnetized in a pre-polarization device based on Nd permanent magnets arranged in a Halbach array providing a 1 T magnetic field in a volume 25 mm in diameter and 50 mm in length. Subsequently, a driving field is turned on and the sample is pneumatically shuttled biancalana_rsi_14 to the AOM head. The travel time is about 140 ms, after which the driving field is switched off, and the tipping pulses are applied. Tipping can be achieved either non-resonantly (non-selectively) by applying a rectangular pulse as a transverse field or resonantly. The measurements shown in this paper are obtained with the resonant technique.
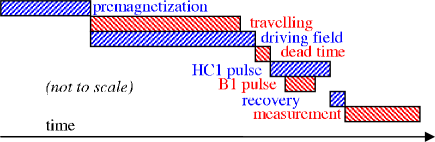
The measurements were performed using an automated cycling procedure, whose timing is sketched in Fig. 3. The magnetic field inhomogeneities along the sample displacement path are small enough so that the proton magnetization follows the field adiabatically. A driving field is necessary to ensure that polarization of the D nuclei is also preserved. This field is switched off adiabatically after the transfer of the sample, so that the magnetization is eventually aligned with the static field.
A webcam detects the actual position reached by the sample with respect to the sensors shot-by-shot, making it possible to automatically disregarding bad shots (of which a small percentage nonetheless remain).

IV Results
The spectrum plotted in Fig. 4 is obtained with a sample containing 2 ml D2O and 2 ml H2O, by averaging over 1000 traces. The difference in amplitude between the two peaks is due to the shorter decay time and the smaller gyromagnetic factor of D. The latter causes a lower initial magnetization level compared to H, although this has no relevance at the detection stage, thanks to the non-inductive nature of the sensor.
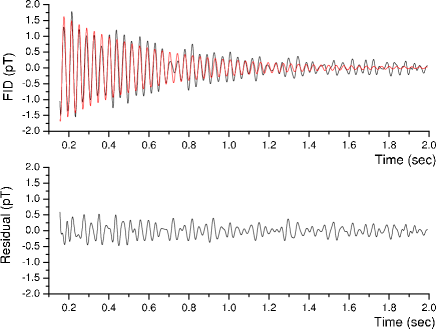
The decay times of both H and D nuclei are estimated from the averaged traces on the basis of discrete Fourier transform methods duda_intech_12 , as well as using non-linear fitting procedures targeted to damped oscillation and in both cases values of 1.2 s and 0.4 s are obtained, respectively. The upper plot in Fig.5 shows the time-domain D trace, as obtained with the application of a band-pass filter, and the corresponding fitting curve. Their difference is shown in the lower plot.
In conclusion, we have demonstrated that a ultra-low field NMR experiment based on a differential optical magnetometer enables the detection of proton and deuteron precession signals in a micro-Tesla field in an unshielded environment. The possibility of detecting H and D signals simultaneously at various intensities of the magnetic field in the ultra-low field range makes this research of interest in the field of biochemistry and in other applications where relaxation mechanisms with correlation frequencies in the sub-kHz range are expected. Such long correlation time measurements render this ultra-low-field magnetometry a complementary method to the conventional high-field NMR.
Acknowledgements.
The authors thank E.Thorley and "Lingo Lingo Sprachdienst" for revising the English of the manuscript.Appendix A Supplemental material
The following appendices contain supplemental material completing the information provided in the letter "Simultaneous Detection of Hydrogen and Deuterium NMR Signal in a micro-Tesla Field". Additional details about the magnetometer sensor (atomic medium preparation and Faraday rotation detection), sample shuttling system, sample premagnetization assembly, data acquisition and analysis are briefly presented.
Appendix B Atomic medium and laser radiations
Atomic magnetometry dates several decades bell_prl_61 or, in some sense, even more than one century macaluso_98 , but it is having a revival in the last two decades, thanks to advances in solid state laser technology. A review in this field can be found in Ref.[budker_nat_07 ].
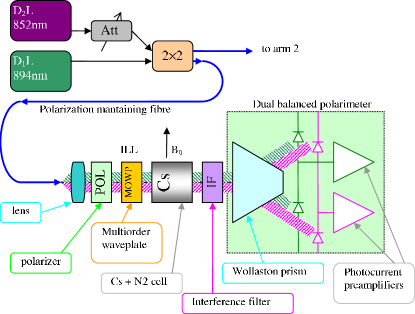
The magnetometer used in this experiment is an updated version of a setup previously described biancalana_ap_16 ; biancalana_arnmrs_13 ; belfi_josa_09 . It consists of two identical arms having as sensors Cs vapour and buffer gas (at 23 Torr) in sealed cells. Each arm (see Fig. 6) contains an illuminator providing two co-propagating laser radiations, a Cs sensor, and a balanced polarimeter. The polarimeter analyzes the polarization of the emerging probe radiation in half-beam sections so that, as a total, four polarimetric signals are available.
The two laser radiations have different wavelengths. One of them is resonant with the D1 transitions of the Cs atoms at 894 nm. This light is kept at a relatively high intensity (mW/cm2) and it is used to optically pump the atoms. The other radiation is near resonant with the D2 transitions at 852 nm and it is used to probe the atomic spins precession.
The magnetometric head is fibre-coupled to the laser sources. More precisely, the pump radiation D1L and the probe radiation D2L are coupled to polarisation-maintaining fibres. A proper mixture of the two radiations is then accomplished using an on-fibre mixer. Both the light sources are based on solid-state continuous-wave devices.
The probe radiation is tuned at a constant frequency (the optimum is found to be at about 2 GHz on the blue wing of the (D2) unresolved resonance set), and is attenuated before mixing by means of an on-fibre device. The pump radiation is used at full power (in the mW range), and is broadly frequency modulated, in such way that it goes periodically in- and out-of resonance with the component of the (D1) transition set.
At the fibre exit, just before the vapour cells to be illuminated, the two laser lights are collimated into parallel beams about 10 mm in diameter, their linear polarisation are reinforced by a polarising cube, and finally a special multi-order waveplate (MOWP) makes the pump radiation circularly polarised, while leaving the probe one linearly polarised. This technique is based on an advantageous opportunity offered by the two-colour operation of the system. In fact, it is possible to build a multi-order quartz wave-plate with a nominal relative delay of 4.75 wavelengths for D1 radiation and 5.00045 wavelengths for D2 radiation: such plates when oriented at with respect of the polarization direction of linearly polarized radiations renders circular only the component that is subject to a dephasing.
Appendix C Faraday Rotation Detection
The pump laser aligns the Cs atomic spins along its propagation axis producing a macroscopic magnetization of the atomic vapour. The presence of a perpendicular magnetic field forces the atomic magnetization to precess in the orthogonal plane, so that its component along the optical axis oscillates in time with the Cs Larmor frequency. In order to counteract the relaxation processes, the pump laser is made periodically resonant, synchronously with the Larmor precession. Upon these conditions, the atomic sample behaves similarly to a damped oscillator resonantly forced. In particular the Cs magnetization along the optical axis evolves with a phase, which depends on the detuning between the the Larmor frequency and the the pump laser modulation frequency (forcing signal).
The measure of such phase provides direct and accurate information about the actual field. The latter results from the superposition of a dominant bias term and a small time-dependent component generated by the nuclear spins under measurement.
The precession of the atomic magnetization can be detected with a high efficiency looking at the circular birefringence of the medium, which is particularly strong for a radiation near resonant with the atomic system, as for the case of the probe radiation. Thus, the polarimetry on the transmitted probe radiation offers an efficient tool for deriving the time dependent magnetic field acting on the Cs atoms, i.e. the time evolution of the nuclear spins in the NMR sample.
Appendix D Sample shuttling system, and premagnetization
A pneumatic sample shuttling system is set up to displace the sample from the premagnetization area to the measurement area. It uses compressed air, at about 0.4 MPa, controlled by standard electrovalves which are computer controlled with a 1 ms time accuracy. Typical shuttling times are 140 ms for forward displacement and 1.2 sec for backward displacement, for a pipe of 2 m in length. Shorter times (down to about 50 ms) can be achieved using higher pressure, at expense of some reduction in reliability and in shot-by-shot reproducibility. At the end of the fast, forward displacement, the sample is pneumatically decelerated, in order to avoid bouncing and mechanical shock at the arrival.
The premagnetization of the sample is accomplished in a home-made Halbach assembly using sixteen 1-inch, cubic Nd magnets. The magnetic field strengths inside the magnetizing volume is approximately 1 T. Such volume has a cylindrical shape, 25 mm in diameter and 50 mm in length. The diameter matches the outer diameter of the shuttle pipe, and the length exceeds the sample-holder cartridge length. The cartridge is made of polyether-ether-ketone polymer (PEEK), a material selected for its excellent mechanical and chemical resistance properties. The cartridge is accurately machined to match the inner pipe diameter and may host up to a 5 ml sample. Details about the shuttling system and the premagnetization assembly are available in a technical note biancalana_rsi_14 .
Appendix E Data analysis
The polarimetric signals from the four channels of the magnetometer are acquired using a standard ADC National Instruments card (NI6250) with 1 MS/s rate per channel and samples. The phase is extracted on the basis of numerical Larmor frequency demodulation, and it is converted in magnetic field units according to the expression given in the Appendix of Ref.[biancalana_ap_16 ]. The field-difference between two channels of the magnetometer (the baseline is about 55 mm) is analyzed. The field-difference signal contains signal due to spin nucleus free decay (FID signal), while disturbances originating from far located sources appear as common-mode terms and are cancelled by subctraction. The NMR spectrum is evaluated from the fast Fourier transform of the differential field signal. In order to visualize FID signal coming from a specific nuclear spin a linear numerical filtering (band-pass filter of a specific order) is applied.
References
- (1) A. G. Palmer, “NMR characterization of the dynamics of biomacromolecules,” Chemical Reviews, vol. 104, no. 8, pp. 3623–3640, 2004. PMID: 15303831.
- (2) M. Bloom and E. Sternin, “Transverse nuclear spin relaxation in phospholipid bilayer membranes,” Biochemistry, vol. 26, no. 8, pp. 2101–2105, 1987.
- (3) A. D. Meltzer, D. A. Tirrell, A. A. Jones, and P. T. Inglefield, “Chain dynamics in poly(amidoamine) dendrimers: a study of proton NMR relaxation parameters,” Macromolecules, vol. 25, no. 18, pp. 4549–4552, 1992.
- (4) R. E. Block and B. C. Parekh, “Deuterium nuclear spin relaxation in biological tissues,” Magnetic Resonance in Medicine, vol. 5, no. 3, pp. 286–289, 1987.
- (5) Z. Ababneh, H. Beloeil, C. B. Berde, G. Gambarota, S. E. Maier, and R. V. Mulkern, “Biexponential parameterization of diffusion and T2 relaxation decay curves in a rat muscle edema model: Decay curve components and water compartments,” Magnetic Resonance in Medicine, vol. 54, no. 3, pp. 524–531, 2005.
- (6) D. A. Case, “Molecular dynamics and NMR spin relaxation in proteins,” Accounts of Chemical Research, vol. 35, no. 6, pp. 325–331, 2002. PMID: 12069616.
- (7) R. Barbieri, M. Quaglia, M. Delfini, and E. Brosio, “Investigation of water dynamic behaviour in poly(HEMA) and poly(HEMA-co-DHPMA) hydrogels by proton T2 relaxation time and self-diffusion coefficient NMR measurements,” Polymer, vol. 39, no. 5, pp. 1059 – 1066, 1998.
- (8) M. Akke and A. G. Palmer, “Monitoring macromolecular motions on microsecond to millisecond time scales by constant relaxation time NMR spectroscopy,” Journal of the American Chemical Society, vol. 118, no. 4, pp. 911–912, 1996.
- (9) L. E. Kay, “Protein dynamics from NMR,” Biochemistry and Cell Biology, vol. 76, no. 2-3, pp. 145–152, 1998. PMID: 9923683.
- (10) H. H. Ong, A. C. Wright, and F. W. Wehrli, “Deuterium nuclear magnetic resonance unambiguously quantifies pore and collagen-bound water in cortical bone,” Journal of Bone and Mineral Research, vol. 27, no. 12, pp. 2573–2581, 2012.
- (11) F. W. Wehrli, “Magnetic resonance of calcified tissues,” Journal of Magnetic Resonance, vol. 229, pp. 35 – 48, 2013. Frontiers of In Vivo and Materials MRI Research.
- (12) D. A. Reiter, P.-C. Lin, K. W. Fishbein, and R. G. Spencer, “Multicomponent relaxation analysis in cartilage,” Magnetic Resonance in Medicine, vol. 61, no. 4, pp. 803–809, 2009.
- (13) E. Steiner, S. Bouguet-Bonnet, J.-L. Blin, and D. Canet, “Water behavior in mesoporous materials as studied by NMR relaxometry,” The Journal of Physical Chemistry A, vol. 115, no. 35, pp. 9941–9946, 2011. PMID: 21793571.
- (14) C. Huang, A. Bilgin, T. Barr, and M. I. Altbach, “ relaxometry with indirect echo compensation from highly undersampled data,” Magnetic Resonance in Medicine, vol. 70, no. 4, pp. 1026–1037, 2013.
- (15) J. E. Birdwell and K. E. Washburn, “Multivariate analysis relating oil shale geochemical properties to NMR relaxometry,” Energy & Fuels, vol. 29, no. 4, pp. 2234–2243, 2015.
- (16) A.Raj, S.Pandya, X.Shen, E.LoCastro, T.D.Nguyen, and S.A.Gauthier, “Multi-compartment relaxometry using a spatially constrained multi-gaussian model,” PLoS One, vol. 9, no. 6, p. e98391, 2014.
- (17) Y. Cabrales, M. Lores, and Y. Machado, “Deuterium magnetic relaxation process during the polymerization of hemoglobin S,” Applied Magnetic Resonance, vol. 33, p. 207, Apr 2008.
- (18) X. Meng, M. Foston, J. Leisen, J. DeMartini, C. E. Wyman, and A. J. Ragauskas, “Determination of porosity of lignocellulosic biomass before and after pretreatment by using Simons’ stain and NMR techniques,” Bioresource Technology, vol. 144, pp. 467 – 476, 2013.
- (19) D. P. Weitekamp, A. Bielecki, D. Zax, K. Zilm, and A. Pines, “Zero-field nuclear magnetic-resonance,” Physical Review Letters, vol. 50, pp. 1807–1810, 1983.
- (20) I. M. Savukov and M. V. Romalis, “NMR detection with an atomic magnetometer,” Phys. Rev. Lett., vol. 94, p. 123001, Mar 2005.
- (21) G. Bevilacqua, V. Biancalana, P. Chessa, and Y. Dancheva, “Multichannel optical atomic magnetometer operating in unshielded environment,” Applied Physics B, vol. 122, no. 4, pp. 1–9, 2016.
- (22) W. E. Bell and A. L. Bloom, “Optically driven spin precession,” Phys. Rev. Lett., vol. 6, pp. 280–281, Mar 1961.
- (23) G. Bevilacqua, V. Biancalana, A. Ben Amar Baranga, Y. Dancheva, and C. Rossi, “Microtesla NMR -coupling spectroscopy with an unshielded atomic magnetometer,” Journal of Magnetic Resonance, vol. 263, pp. 65–70, 2016.
- (24) V. Biancalana, Y. Dancheva, and L. Stiaccini, “Note: A Fast Pneumatic Sample-shuttle with Attenuated Shocks,” Review of Scientific Instruments, vol. 85, no. 3, p. 036104, 2014.
- (25) K. Duda, Interpolation algorithms of DFT for parameters estimation of sinusoidal and damped sinusoidal signals IN:Fourier transform - signal processing. InTech, Rijeka, Croatia, 2012.
- (26) W. E. Bell and A. L. Bloom, “Optically Driven Spin Precession,” Phys. Rev. Lett., vol. 6, pp. 280–281, Mar 1961.
- (27) D. Macaluso and O. M. Corbino, “Sopra una Nuova Azione che la Luce Subisce Attraversando alcuni Vapori Metallici in un Campo Magnetico,” Nuovo Cimento, vol. 8, p. 257, 1898.
- (28) D. Budker and M. Romalis, “Optical Magnetometry,” Nature Physics, vol. 3, p. 227, 2007.
- (29) G. Bevilacqua, V. Biancalana, P. Chessa, and Y. Dancheva, “Multichannel Optical Atomic Magnetometer Operating in Unshielded Environment,” Applied Physics B, vol. 122, no. 4, pp. 1–9, 2016.
- (30) G. Bevilacqua, V. Biancalana, Y. Dancheva, and L. Moi, “Chapter Three - Optical Atomic Magnetometry for Ultra-Low-Field NMR Detection ,” vol. 78 of Annual Reports on NMR Spectroscopy, ch. 3, pp. 103 – 148, Academic Press, 2013.
- (31) J. Belfi, G. Bevilacqua, V. Biancalana, S. Cartaleva, Y. Dancheva, K. Khanbekyan, and L. Moi, “Dual Channel Self-oscillating Optical Magnetometer,” J. Opt. Soc. Am. B, vol. 26, pp. 910–916, May 2009.