Galaxy And Mass Assembly (GAMA): Blue spheroids within 87 Mpc
Abstract
In this paper we test if nearby blue spheroid (BSph) galaxies may become the progenitors of star-forming spiral galaxies or passively-evolving elliptical galaxies. Our sample comprises 428 galaxies of various morphologies in the redshift range (8-87 Mpc) with panchromatic data from the Galaxy and Mass Assembly survey. We find that BSph galaxies are structurally (mean effective surface brightness, effective radius) very similar to their passively-evolving red counterparts. However, their star-formation and other properties such as colour, age and metallicity are more like star-forming spirals than spheroids (ellipticals and lenticulars). We show that BSph galaxies are statistically distinguishable from other spheroids as well as spirals in the multi-dimensional space mapped by luminosity-weighted age, metallicity, dust mass and specific star formation rate.
We use HI data to reveal that some of the BSphs are (further) developing their disks, hence their blue colours. They may eventually become spiral galaxies — if sufficient gas accretion occurs — or more likely fade into low-mass red galaxies.
keywords:
galaxies: evolution; galaxies: fundamental parameters; galaxies: structure; galaxies: star formation; galaxies: stellar content1 Introduction
Traditionally, passively-evolving red galaxies have been associated with spheroidal morphology, while optically-blue, star-forming galaxies are found to be spiral or irregular. These observations are strengthened by the existence of two distinct locii for red and blue galaxies in the colour-magnitude space: the “blue cloud” for the star-forming galaxies and the “red sequence” for the passively evolving spheroids residing in dense environments.
In this paper we show that this colour-morphology relation breaks down for the blue spheroid (BSph) galaxies111In the context of this paper, Blue spheroids are extremely blue and compact spheroid galaxies. Morphologically they resemble small elliptical galaxies or bulges of spirals., especially below , or where spheroidal galaxies are found to be predominantly blue and star-forming. Using observed and derived properties of galaxies, in this paper we examine the BSph galaxies as the likely (i) progenitors of passively-evolving low-mass elliptical galaxies, (ii) intermediate stage in the evolution of massive spirals or, (iii) unique population different from both the elliptical and spiral galaxies.
Due to their fascinating nature BSph galaxies have been the subject of many studies in the last few years. Schawinski et al. (2009) for instance, presented a sample of BSphs selected by visual inspection from the Galaxy Zoo. Their sample comprised BSph galaxies at . They found that BSph galaxies mostly reside in low-density environments, forming 6 per cent of all spheroidal galaxies at low redshift. Using the deep Millennium Galaxy Catalogue ( mag arcsec-2; Liske et al., 2003), Driver et al. (2006) classified 11.2 per cent of the galaxies at as BSphs, while Cameron et al. (2009) confirmed that BSphs are rare in the local Universe with a volume density of h Mpc-3.
Kannappan, Guie, & Baker (2009) found that BSph galaxies become more common with decreasing stellar mass, such that their fraction increases from to below . Since the latter mass scale coincides with the mass scale below which the mean global atomic gas fraction increases for all types of galaxies (Kannappan, 2004; Kannappan & Wei, 2008; Janowiecki et al., 2017), Kanappan et al. suggested that the presence of cold gas may be crucial to the existence of BSph galaxies. Their findings were complimentary to that of Noeske et al. (2006) who analysed a sample of 26 luminous BSph galaxies at high redshift () to show that most of the BSphs had a smaller, brighter star-forming component with an extended, almost exponential disk-like component with scale length of kpc. Based on their results, Noeske et al. (2006) suggested that the majority of BSph galaxies at high- will evolve into small disk galaxies or low-mass spheroids222Throughout this paper we collectively refer to lenticulars, BSphs and elliptical galaxies as spheroids unless stated otherwise.. They neither find any evidence suggesting inside-out growth scenario which could turn BSphs to large disks, nor do they see any disk growth around BSphs (but see Graham, Dullo, & Savorgnan, 2015; Graham, Ciambur, & Savorgnan, 2016; Graham et al., 2017, for an alternative view). Lopes et al. (2016) also investigated a sample of low- galaxies in various environments. Their analysis suggests that while highly-asymmetric BSphs may originate in mergers, the star formation histories of BSphs are likely to be heterogenous.
In this paper we utilize the arsenal of data compiled by the Galaxy and Mass Assembly survey (GAMA; Driver et al., 2016), which provides an unprecedented view of low-redshift galaxies using 21-band photometry and fibre-spectroscopic data as discussed in the following section. In Section 3 we analyse the physical properties of BSphs relative to other types of galaxies, and perform automatic classification of all galaxies in multi-dimensional parameter space in Section 4. We analyse the neutral Hydrogen data for our sample, where available in Section 5. We discuss our findings in the context of existing literature in Section 6, and finally summarise our results in Section 7. Throughout this paper we assume a CDM concordance cosmological model with km s-1 Mpc-1, and to calculate all distances and magnitudes.
2 data
2.1 Spectroscopic and photometric data
The GAMA survey is a combined spectroscopic and photometric multi-wavelength programme. GAMA has measured photometry for over 230 deg2 on the sky in 21 wavebands, and obtained spectroscopic redshifts for galaxies () (Baldry et al., 2010; Robotham et al., 2010; Driver et al., 2011; Hopkins et al., 2013; Driver et al., 2016).
The sample used in this paper is the same as that used in Mahajan et al. (2015, hereafter paper I), but with some of the derived parameters updated in accordance with the latest versions of the GAMA II catalogues (Liske et al., 2015). We direct the reader to Paper I for details of sample selection and its characteristics, highlighting only the most relevant aspects below briefly for completeness. Our sample comprises 428 galaxies333All but four galaxies from Paper I are excluded because of missing data in GAMA II catalogues. selected to have very well constrained spectroscopic redshifts in the range 444 uses the flow model described in Tonry et al. (2000).. This redshift range was chosen to exclude galactic stars and enable morphological classification of galaxies by visual inspection using shallow ( sec per band) Sloan Digital Sky Survey (SDSS; data release 7) imaging. The spectroscopic campaign for GAMA is based on the SDSS imaging complete to mag, which translates to mag at the maximum redshift () of data used in this paper.
We use the matched-aperture photometry measured across 21 wavebands for GAMA galaxies using the Lambda Adaptive Multi-Band Deblending Algorithm in R (LAMBDAR; Wright et al., 2016). Specifically, we use LambdarSDSSgv01, LambdarSDSSrv01 and LambdarInputCatUVOptNIRv01 catalogues from the LAMBDAR data management unit (DMU). The magnitudes are then -corrected to using the -corrections from the kcorr_auto_z00v05 DMU (Loveday et al., 2012). We note that the -corrections in this DMU have been obtained using the SDSS model magnitudes and GAMA matched aperture AUTO magnitudes from the ApMatchedCatv06 DMU. Since the correlation between the AUTO and LAMBDAR magnitudes for our sample is better than 95 per cent555 per cent excluding irregular galaxies from our sample. they can be applied to LAMBDAR magnitudes for our sample. The mean -correction for our sample in the and -bands is mag.
| GAMA ID | Morphology | z | ALFALFA ID | HI Flux () | log HI | |||
|---|---|---|---|---|---|---|---|---|
| mag | mag | Jy km s-1 | Jy km s-1 | |||||
| 105589 | 19.67 | 0.03 | 3 | 0.019 | - | - | - | - |
| 106916 | 19.58 | 0.04 | 6 | 0.015 | 249428 | 0.63 | 0.05 | 8.72 |
| 107137 | 13.94 | 0.01 | 11 | 0.015 | - | - | - | - |
| 107226 | 19.39 | 0.03 | 6 | 0.016 | - | - | - | - |
| 116572 | 19.84 | 0.02 | 6 | 0.020 | - | - | - | - |
| 117059 | 19.87 | 0.04 | 5 | 0.011 | - | - | - | - |
| 118764 | 18.47 | 0.09 | 3 | 0.011 | - | - | - | - |
| 119004 | 17.87 | 0.05 | 3 | 0.013 | - | - | - | - |
2.2 Physical properties of galaxies
The best-fit values for several physical parameters for all galaxies in the three equatorial regions of the GAMA survey have been obtained by running the spectral energy distribution fitting code Multi-wavelength Analysis of Galaxy Physical Properties (magphys; da Cunha, Charlot, & Elbaz, 2008) on the 21-band photometry taken from the Lambdarcatv01 DMU (Driver et al., 2016). We use the stellar mass (), star formation rate (SFR), -band light-weighted age and metallicity () obtained from the Magphys DMU (version 6) in our analysis below.
The SFR derived from magphys is an integrated measure of the SFR and therefore represents the star formation activity of a galaxy averaged over a long period of time (0.1 Gyr for magphys). It may thus be argued that for galaxies undergoing a strong burst of star formation, magphys-derived SFR may be very different from the instantaneous SFR. In order to test this hypothesis we converted the H equivalent width666The EW(H) are obtained from the SpecLineSFRv05 (Gordon et al., 2017). to luminosity using eqn. 5 of Hopkins et al. (2003)777We assume a constant stellar absorption correction of 2.5 Å as in Gunawardhana et al. (2013).. The instantaneous ( Myr) SFR is then estimated using the luminosity-to-SFR conversion factor given by Kennicutt (1998).
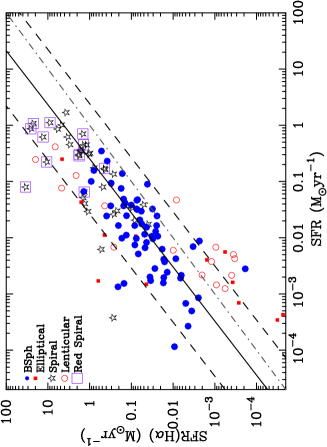
Figure 1 shows a comparison between the two measures of SFR for our sample. On average, the magphys-derived SFR is dex lower than the H SFR. We therefore conclude that for the sample used here, the average SFR can be converted to an instantaneous SFR by using a simple scaling factor. The use of the latter instead of former will only change our results qualitatively. We therefore use the magphys-derived “average” SFR throughout.
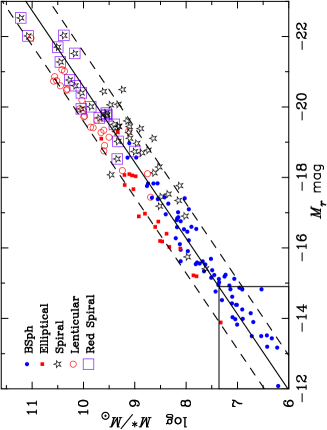
Figure 2 shows that the absolute -band magnitude and magphys-derived for our sample are well correlated888Although not shown for clarity, all 428 galaxies were included in evaluating the least square fit relation and the scatter therein. as . Based on this figure and the limiting magnitude of mag, in the following we adopt as the limiting stellar mass for our sample. 16.3 per cent (27/165) of the galaxies shown in Figure 2 fall in the incomplete zone (the fraction increases to per cent when Irr and LSB galaxies are included). For completeness we show all data points in the following figures, highlighting the ones in the incomplete zone of the - space.
2.3 Morphological classification
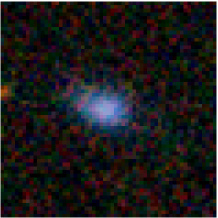
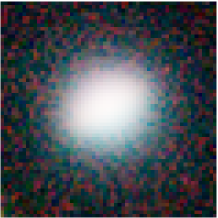
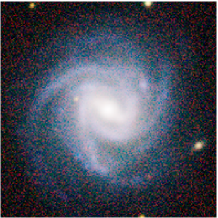
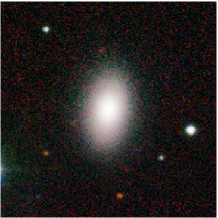
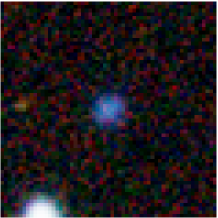
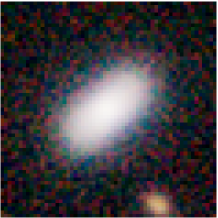
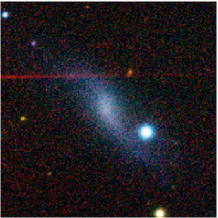
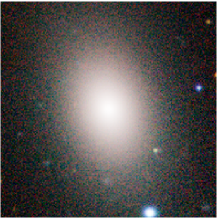
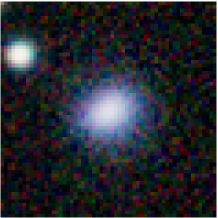
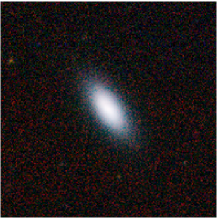
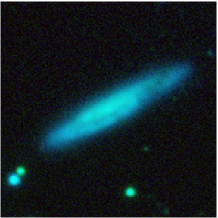
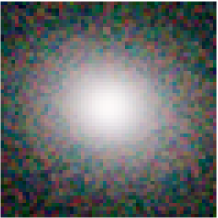
The morphological classification of galaxies used in this work is the same as that in paper I and we direct the reader to section 3.1 therein for details, briefly summarising our methodology below for completeness. Visual classification of the three-colour images999Each image is generated using the SDSS and the UK Infrared Telescope (UKIRT) Infrared Deep Sky Survey (UKIDSS) Large Area Survey (LAS) -band data. http://www.ukidss.org/surveys/las/las.html of all galaxies in the redshift range - was done by Mahajan, Driver and Drinkwater multiple times. Some representative examples of the postage stamp images classified into different categories are shown in Figure 3. We found that in the chosen redshift range our data could be categorised into six classes:
-
•
Elliptical: Galaxies which are morphologically elliptical in shape. They are mostly red in colour.
-
•
Spirals: Galaxies showing well-defined spiral arms or clearly identifiable edge-on disks. These galaxies often show conspicuous signs of ongoing star formation, such as HII regions, and stellar associations forming spiral arms.
-
•
Lenticulars: Red, disk galaxies with a resolved nucleus. These galaxies are mostly big and bright, occasionally showing signs of some ongoing star formation in rings around nucleus, or low surface brightness disks without spiral arms.
-
•
Blue spheroids (BSph): Colour plays a key role in successfully identifying these galaxies. They are very blue and generally compact spheroids, morphologically similar to small elliptical galaxies or bulges of spiral galaxies.
-
•
Low surface brightness (LSB) galaxies: These extended objects show very poor contrast with the background in the five-band SDSS imaging. We note that a substantial fraction of these galaxies may have been misclassified due to the very shallow imaging data used here. Many of these galaxies may also be classified as irregular, and as we will show below, these two classes overlap in most of the parameter space explored here.
-
•
Irregulars (Irr): All confirmed extended sources that do not belong to any of the above categories.
Although we did not use luminosity in our classification scheme, the results were luminosity-dependant, such that the latter three classes (BSphs, LSBs and Irr) dominate the low-luminosity regime in our sample, with irregulars being the most dominant population ( per cent), followed by BSphs ( per cent).
415/428 ( per cent) of our sources are also found in the VisualMorphologyv03 DMU of GAMA. In our chosen redshift range we find 57 ( per cent) galaxies are classified as the “little blue spheroids” in the VisualMorphologyv03 DMU, of which 29 ( per cent) are also classified as BSphs in this paper.
Table 1 gives the GAMA II IDs, -band magnitude and the uncertainty in it, and redshifts compiled from the above mentioned DMUs along with the morphological classification (as per paper I) for all the galaxies in our sample. The morphological classification is 1: Elliptical, 2: Spiral, 3: Irregular, 5: BSph, 6: LSB and 11: Lenticular. Since the focus of this paper is to compare BSphs with spirals and other spheroids, in the following we only show the 165 galaxies which are identified into one of these morphology classes unless specified otherwise. A complete version of Table 1 is available online. Any further information for any of the 428 galaxies from this sample can be obtained from the GAMA website101010http://www.gama-survey.org/ by using the unique GAMA IDs.
3 Analysis of physical properties
In this section we discuss the trends in various physical properties for the galaxies in our sample, briefly discussing how each of them may contribute towards our understanding of the evolution of the BSph galaxies.
3.1 Luminosity and Colour
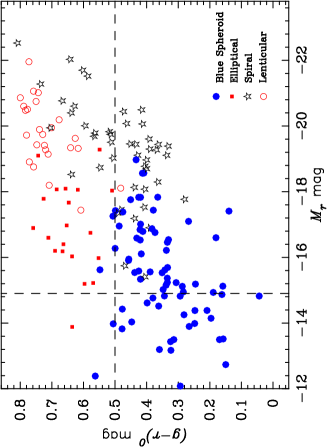
In Figure 4 we show the distribution of spheroidal and spiral galaxies in the colour-magnitude diagram. While the BSphs occupy the region with the bluest colours irrespective of the magnitude, the lenticulars are the most luminous and optically red in colour. The elliptical galaxies have red colour similar to lenticulars, but are less luminous than the latter. Almost 2/3rd of the spiral galaxies have mag, but the rest of them acquire increasingly redder colour as they become more luminous than mag. Figure 4 as well as visual inspection of spiral galaxies in our sample suggests that mag is a good divider for segregating blue spirals from red ones. The red spirals are marked in all the following figures to distinguish them from their blue counterparts.
Figure 4 shows that the passively-evolving galaxies (ellipticals and lenticulars) and star-forming spirals and BSphs form a continuous distribution in the optical colour-magnitude space.
3.2 Star formation
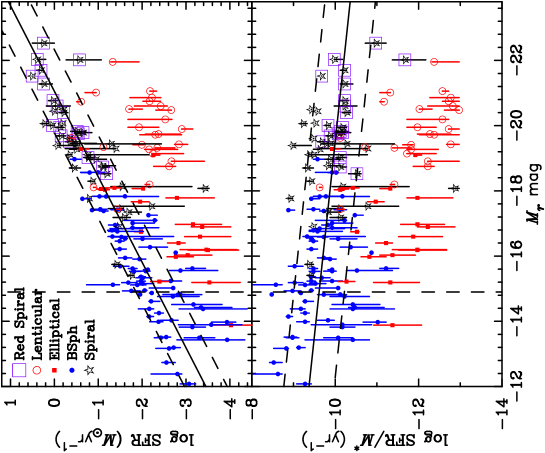
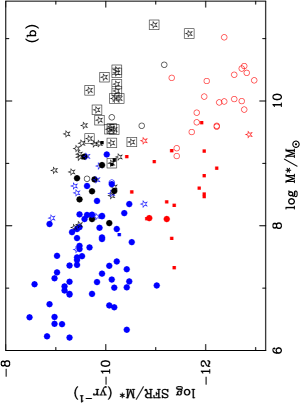
In Figure 5 we show the distribution of the SFR and SFR/ for galaxies with different morphologies as a function of their -band absolute magnitude. The BSphs and spirals form a sequence such that the SFR increases with luminosity, according to the fitted relation represented by a solid line in the top panel of Figure 5. The passively evolving ellipticals and lenticular galaxies also seem to follow a similar relation although with a lower normalisation factor. This trend is replicated for the SFR/, although with a lower slope for the fitted relation since most of the star-forming galaxies (BSphs and spirals) have SFR/ in the range to yr-1, unlike their log SFR which varies by dex. The log SFR/ for the passively evolving ellipticals and lenticulars on average decreases by dex relative to the star-forming galaxies. The -band absolute magnitude is related to the SFR and SFR/ in Figure 5 by the relations:
| (1) |
and
| (2) |
where, the uncertainty is the 1- deviation in the fitted linear least squares relation for star-forming galaxies (BSphs and spirals only).
These trends in the SFR and SFR/ show that BSph galaxies are closer to spirals than ellipticals in the sense that they follow the same relation as the spirals, mostly occupying the lower (higher) edge of the SFR (SFR/) distribution.
3.3 Age and Metallicity
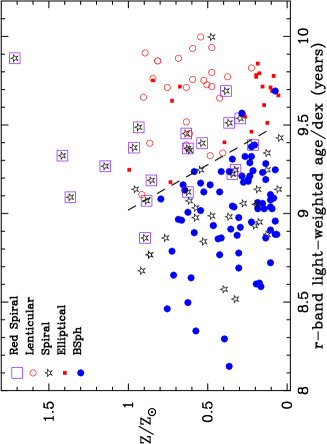
In Figure 6 we show the distribution of our galaxies in the age-metallicity space. The star-forming spirals and BSphs cluster together in the left of the diagram at lower age and metallicity (), while the ellipticals coincide with the lenticulars in the other half. As expected, most of the red spirals identified in Figure 4 are found closer to the dividing line, or coincide with the passively-evolving galaxies in this age-metallicity space. At least half of the red spirals on average also have greater than the lenticulars. We show an approximate dividing line in Figure 6 to guide the eye to the suggested division between the star-forming and passively-evolving galaxies. The significance of this line will become clear in the next section where we employ an automated algorithm to find clusters of galaxies based on various combinations of other physical properties.
Since BSph galaxies coincide with star-forming spirals in Figure 6, it can be concluded that they may have shared similar star formation histories.
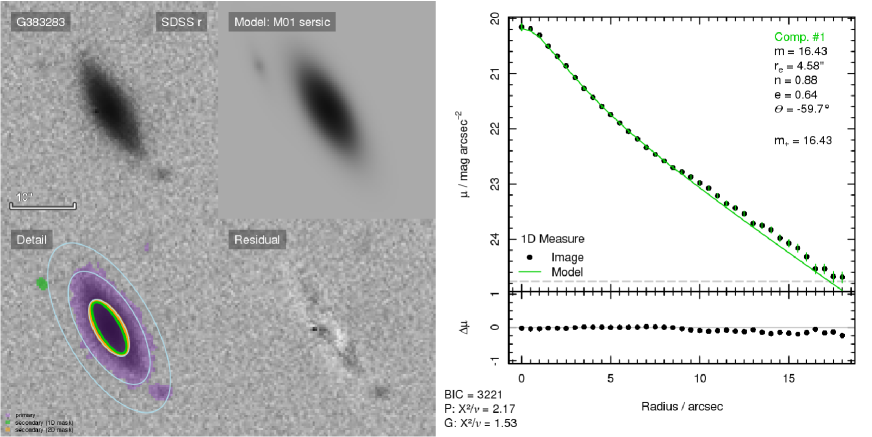
3.4 Structural properties
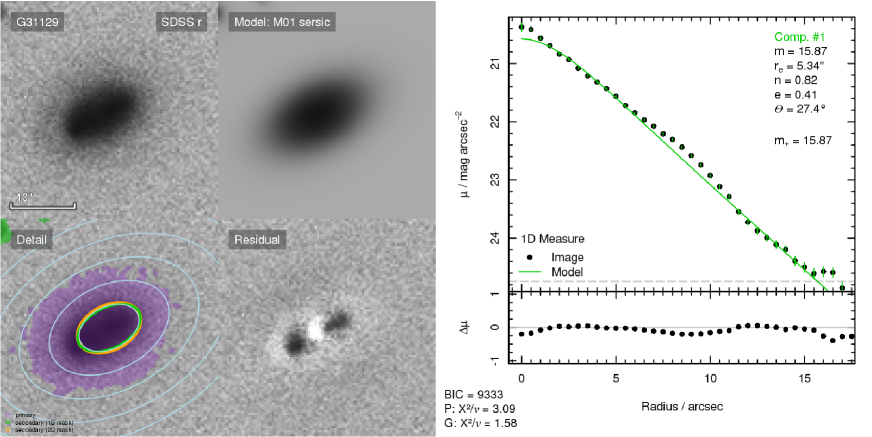
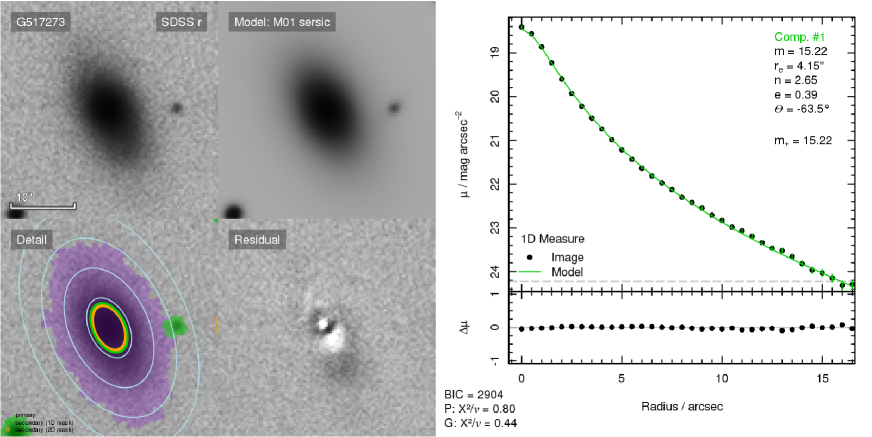
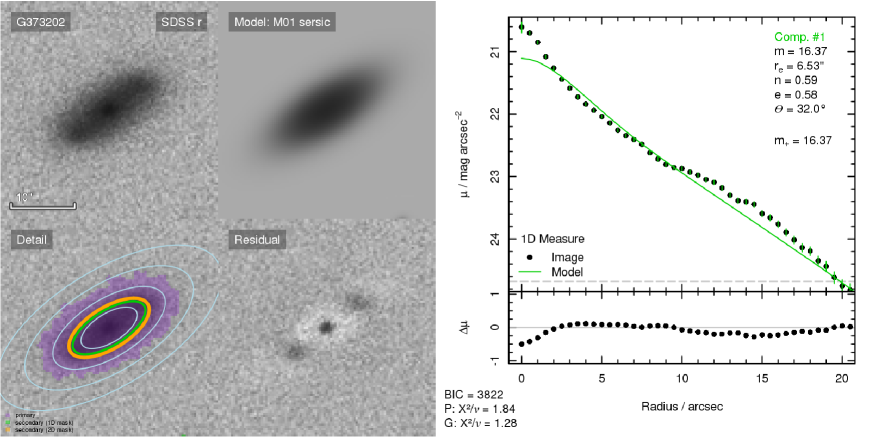
Light profile of all galaxies in the GAMA database in 20 wavebands were fitted using a single sérsic profile using the Structural Investigation of Galaxies via Model Analysis (sigma; v1.0-2 Kelvin et al., 2012). The properties of our sample as outputted by sigma are described in Paper I. Figure 7 and 8 show two examples each of BSph galaxies and ellipticals in SDSS -band. The residual images evidently show the presence of a disk or a nuclear component in addition to the bulge modelled by the single-sérsic profile in these systems. Such non-negligible residuals are found for per cent of ellipticals and per cent of BSph galaxies in our sample. This is consistent with the fraction ( per cent) found by George (2017) using the SDSS Stripe 82 data for BSph galaxies. Together these results elucidate that although this class of galaxies is termed BSphs here (and “little blue spheroids” or “blue ellipticals” or “blue early-type galaxies” elsewhere), structurally they can be further subdivided into at least two different types: genuine blue spheroids, and blue dwarf elliptical galaxies which can be resolved into two components, and therefore should instead be called blue dwarf “lenticulars” instead of ellipticals or spheroids.
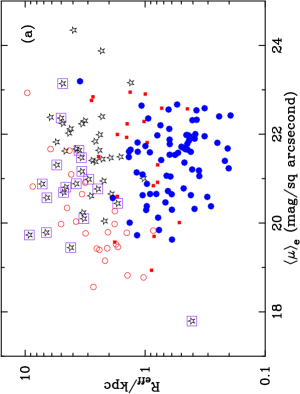
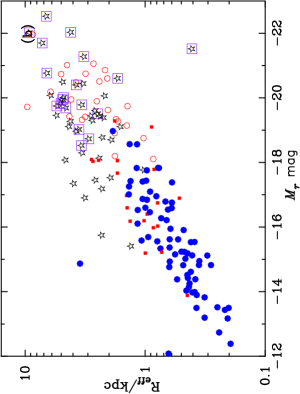
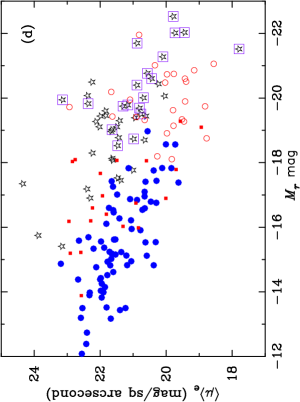
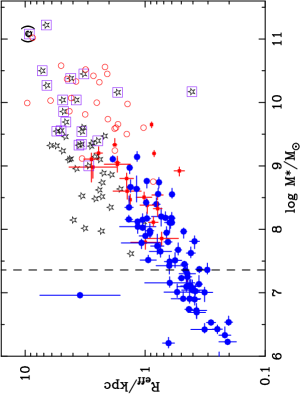
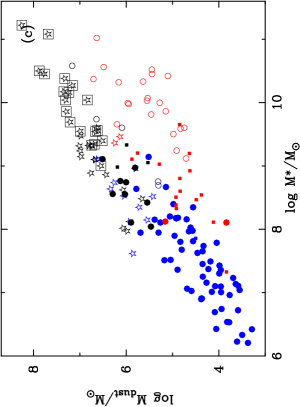
In Figure 9 we show the 2-d space mapped by the structural parameters and average surface brightness () as a function of and and the latter two with each other. Figure 9 reiterates our results from Paper I, i.e. BSph galaxies are structurally similar to ellipticals, spanning the same range of , , luminosity and . Figure 9 (c) shows that BSphs, ellipticals and red spirals form a single sequence in the stellar mass- space, but star-forming spirals and lenticulars deviate away from the mean sequence such that at any on average star-forming spirals are larger and lenticulars are smaller than the red spirals. Figure 9 (d) shows that all spheroids follow the same mean relation of declining with increasing luminosity. But at fixed luminosity, spirals always have higher surface brightness relative to the spheroids.
In a nutshell this section shows that BSph galaxies are structurally similar to their passively-evolving counterparts, but resemble star-forming spirals in age, and star formation properties. In the following section we examine the clustering properties of galaxies using automatic clustering algorithm and re-analyse their distribution in some of the parameter spaces discussed above.
4 k-means clustering analysis
| analysis | parameters | |||||||
|---|---|---|---|---|---|---|---|---|
| 1 | age, Z, | 165 | 2 | 88 | 77 | – | 92% | 24% |
| 2 | age, Z, SFR/ | 165 | 2 | 120 | 45 | – | 97% | 41% |
| 3 | age, Z, SFR/, | 165 | 3 | 74 | 50 | 41 | 85% | 16% |
| 4 | age, Z, SFR/, , | 165 | 3 | 69 | 59 | 37 | 84% | 12% |
Note: is the number of galaxies in the sample, is the preferred number of clusters, and are the number of galaxies assigned to cluster . is the percentage of all visually-classified BSph galaxies assigned to the first cluster and is the percentage of all galaxies in the first cluster which were not classified as BSph.


One approach to test for connections between different galaxy populations is to examine the clustering properties of their parameters. Specifically, we used an objective clustering algorithm to test if the blue spheroidal galaxies were assigned to a group of their own, or if they clustered with either the spiral or the elliptical galaxies in our sample. We used the “k-means” algorithm (MacQueen, 1967) to decompose the data into a specified number of clusters. For a given number of clusters, this finds the cluster positions that minimise the sum of the squares of the distances from each data point to its cluster centre. We determined the best number of clusters to adopt by using the NbClust (Charrad et al., 2012) package in the R programming language. This package uses 23 different methods for determining the best number of clusters and selects the number proposed by the most methods. Before starting the clustering analysis we removed any objects with missing data and then scaled the remaining galaxies to have a mean of zero and standard deviation of unity in each parameter. All the parameters we analysed were logarithmic measurements (or magnitudes). This approach is very similar to our analysis in Paper 1.
We applied the clustering analysis to several combinations of MAGPHYS parameters reflecting the stellar populations: age, metallicity, stellar mass, dust mass and specific star formation rate. These are listed in Table 2.
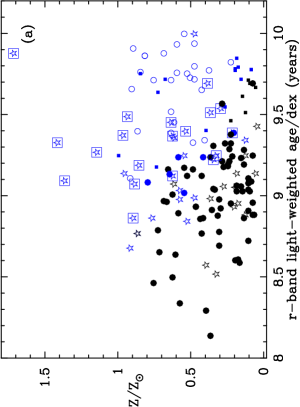
For the first analysis, we considered age, metallicity and . In this case, two clusters were preferred, containing 88 and 77 galaxies respectively (see Table 2). The larger cluster has galaxies at lower ages, metallicities, stellar masses and dust masses, as shown in Figs. 10 (a), (b) and (c). This cluster contains 92 per cent of the blue spheroids, but is strongly (24 per cent) contaminated by other galaxy types. The smaller cluster contains 67 per cent of the spiral galaxies and 87 per cent of the passive (elliptical and lenticular) galaxies. This partition has therefore demonstrated some separation between the BSphs and both the other main galaxy types.
For the second analysis, we replaced stellar mass with specific star formation. In this case also two clusters were preferred (see Table 2). The largest cluster again contained galaxies at lower ages, metallicities, dust masses and stellar masses. This cluster contains 97 per cent of the BSphs, but is heavily (41 per cent) contaminated by other galaxy types than for the first analysis.
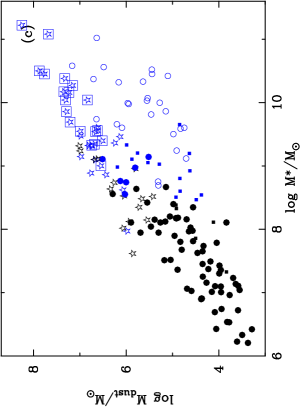
For the third analysis, we added in dust mass. In this case three clusters were preferred, as shown in Figs. 11 (a), (b) and (c) (see Table 2).The largest cluster comprising BSphs contained 74 galaxies and 85 per cent of all BSphs in our sample, but is comparatively less contaminated (16 per cent) by other galaxy types. We further note that adding in stellar mass to this list (analysis 4) reduces the contamination by other galaxy types, by effectively removing some of the spirals from the cluster containing BSphs, but does not increase the completeness fraction of BSphs in their cluster.
In summary therefore, the clustering analyses we applied have separated the BSphs from both the spiral and the passively-evolving spheroids in our sample. This also evidently shows that once all the four parameters namely, age, , SFR/ and are taken into account, BSphs are statistically different from both spirals and ellipticals.
5 Atomic gas mass
Recent and current evolution of star formation properties of galaxies are strongly dependent on the amount of gas contained in them. Similarities in the star formation properties of BSph galaxies and spirals suggests that they may obey similar SFR- scaling relation. In order to test this hypothesis we make use of the Arecibo Legacy Fast ALFA survey (ALFALFA; Giovanelli et al., 2005) which is a blind extragalactic HI survey done using the Arecibo telescope to conduct a census of the local HI universe over a cosmologically significant volume.
101/428 galaxies in our sample have been detected by the ALFALFA survey with median(mean) signal-to-noise ratio (SNR) of 12(25), and . To find the HI counterparts, we matched the LAMBDAR position coordinates to the coordinates of the optical counterpart found by the ALFALFA team (Haynes et al., 2011). All except 7 of the 101 sources from our sample are matched to counterparts within (maximum separation 9′′) from the optical counterpart of the HI source as described above; five of these are irregular galaxies, and one each is an LSB and a spiral galaxy, respectively. These 7 sources are included in Figures 12 and 13.
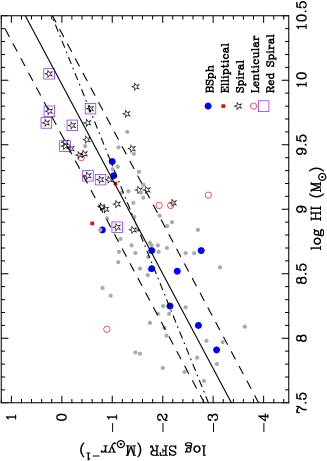
In Figure 12 we show the SFR of different morphological types of galaxies as a function of their HI mass. For completeness, we show all the 101 galaxies from our sample detected by the ALFALFA survey. For all galaxies, SFR is positively correlated with HI mass with a slope of . The red spirals lie above the mean relation, suggesting that these galaxies have higher SFR than expected for their HI mass. The BSphs seem to follow the mean scaling relation as all the other star-forming galaxies in this space. These observations suggest that even if a BSph develops a disk and moves rightward towards higher and SFR in Figure 12, it is likely to obey the same scaling relation as the spirals, only a few of which significantly deviate away from it. But since only two ellipticals are detected in HI, these observations are inconclusive about the fate of the BSphs once the star formation and gas supply fades away.
6 Discussion
The aim of this paper is to test whether BSph galaxies could be progenitors of spirals or passively-evolving elliptical galaxies or if they form a different class of their own based on their structural, physical and star formation properties. BSph galaxies form around 20 per cent of all low-mass () galaxies, and 82.5 per cent of all low-mass spheroids in our sample, which is in agreement with the fractions found by Kannappan, Guie, & Baker (2009). Furthermore, Moffett et al. (2016) found that the “little blue spheroids” classified in the GAMA visual morphology DMU contribute of the stellar mass density at . Our analysis showed that BSphs are structurally very similar to low-mass elliptical galaxies. The fraction of elliptical and BSph galaxies which are likely to contain disk or other components missed by a single sérsic profile used for fitting the galaxies is also similar (Figs. 7 and 8; also see George, 2017).
The deep imaging data from the SDSS Stripe 82 has been examined to look for tidal features in the red sequence elliptical galaxies and BSphs. While Kaviraj (2010) found that only 283 per cent of the 238 ellipticals in their sample show tidal features, George (2017) found a fraction of 587 per cent for the BSphs using analysis of residual images similar to the ones shown in Fig. 7. George (2017) also found that tidal features are more common around massive BSphs (), which are absent in our sample. But since the detection of such features depends upon the depth of the imaging data (see for instance table 3 of Kim et al., 2012), it is not surprising that we fail to find any significant differences between the residual images of ellipticals and BSphs using the shallow SDSS -band imaging data.
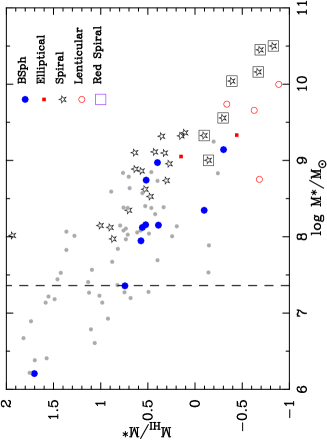
The scaling relations (Figure 9) for spheroids and spirals shows that BSphs occupy similar range of parameters: , and as the red ellipticals. This implies that if BSphs are ellipticals experiencing strong starburst, the phenomenon causing starburst has left their morphology unchanged. The 10 BSphs from our sample which were detected by the ALFALFA survey show a significant amount of atomic gas. Figure 13 shows that the median (and mean) ratio of atomic-gas-to-stellar-mass in BSphs is . It also shows that even in this small sample of BSphs the ratio varies by dex over an range of two orders of magnitude, suggesting that the evolution history of BSphs is very heterogenous.
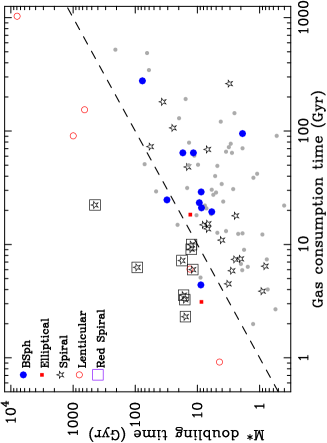
Following Kannappan, Guie, & Baker (2009), we estimated the stellar mass doubling time as the stellar mass divided by the SFR, and gas depletion time scale as the atomic gas mass divided by the SFR. These time scales are crude approximations uncorrected for future infall of new gas or decline of star formation. Figure 14 shows these two time scales for the galaxies in our sample for which HI data are available. Assuming that the unmeasured molecular gas mass in these galaxies is not very large, galaxies on the left of the line of equality can not double their stellar mass without accreting new gas. Figure 14 therefore shows that most BSph galaxies (8/10) can evolve significantly even under the hypothetical closed-box scenario assumed here, and hence may not undergo any morphological changes.
But if a BSph needs to develop a disk similar to a spiral galaxy its radius must increase by a factor of (Figure 9), implying a large increase in mass. So along with the presence of large amount of gas, BSphs should form stars with great efficiency. The gas consumption time-scale shown in Figure 14 crudely represents the inverse of star formation efficiency, i.e. . Even in our small sample it is evident that the BSphs are on average less efficient at forming stars than spiral galaxies. It is therefore plausible but not mandatory that at least some of the BSph galaxies may evolve into small disk galaxies (also see Noeske et al., 2006).
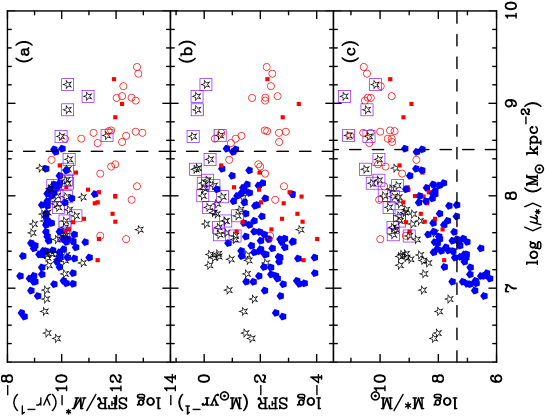
Using nearby () galaxies more massive than a few times from the SDSS, Kauffmann et al. (2006) reported a critical stellar surface mass density, log kpc-2 above which the star formation in disk-dominated galaxies occurs in short-lived intense bursts. We estimated for all the galaxies in our sample. Figure 15 shows for the spheroids and spiral galaxies111111Two BSphs and one red spiral galaxy at 5.37, 6.09 and 10.45 kpc-2 do not appear in the figure because of the chosen range for the ordinate. Both the BSphs fall below the mass completeness limit; log for the red spiral. as a function of their , SFR and sSSFR, respectively. For our sample only 28 galaxies have greater than the critical threshold, of which 17 (61 per cent) are passively-evolving lenticulars and six (21 per cent) are red spirals.
Figure 15 shows that the stellar surface mass density is strongly correlated with stellar mass irrespective of galaxy morphology. The SFR is found to be a function of for the BSphs and spirals, but not for the ellipticals and lenticulars. The sSFR for BSph and spiral galaxies is independent of albeit with large scatter, some of which may be attributed to the weak correlation between and SFR (Figure 5). The sSFR for red spirals is remarkably constrained to yr-1 despite their and varying by as much as two dex. For their relatively more massive sample, Kauffmann et al. (2006) found that sSFR remains constant for all galaxies with log kpc-2, unlike our sample where low-mass ellipticals and passively-evolving lenticulars even below the critical have lower sSFR than their star-forming counterparts.
We can conclude two things from Figure 15, firstly the criticality of the threshold below which the mean sSFR of galaxies of a given mass and stellar surface density does not not depend upon either mass or surface density (Kauffmann et al., 2006), is invalid for our sample with a lower average stellar mass than the sample of Kauffmann et al.. Secondly, the BSphs follow a linear relation similar to spirals in the - space, but with a different normalization factor. This analysis therefore shows that for our sample, is a function of surface density irrespective of galaxy morphology, unlike the SFR and sSFR for which the trends vary with galaxy morphology.
7 Summary
In this paper we examine the likelihood of BSph galaxies as progenitors of spiral or elliptical galaxies. In order to do so, we make use of the data products derived from the panchromatic imaging and optical spectra of the GAMA galaxies. This paper presents our complete sample of 432 galaxies (also used in Paper I) spanning the redshift range , and devoid of very high-density environments.
We find that even though BSphs are structurally very similar to ellipticals, the distribution of their luminosity-weighted age, , and sSFR are more like the star-forming spirals than the passively-evolving spheroids (ellipticals or lenticulars). BSphs also follow the same SFR- and - scaling relation as the spirals. We further showed that at any given , BSphs are more compact than spirals and on average have higher stellar surface mass density at than spiral galaxies, implying that on average their star formation efficiency is lower than spiral galaxies.
The automated clustering algorithm k-means applied to the multi-dimensional parameter space mapped by age, and decomposes the spheroids and spiral galaxies into two “clusters”. The larger of these comprise 92 per cent of the BSphs but is heavily contaminated (24 per cent) by other types of galaxies having low age, and . Adding in the to the multi-dimensional space yields a preference for three clusters, of which the one containing low age, , and and high sSFR galaxies comprises 85 per cent of the BSphs but is less contaminated (16 per cent) by other galaxy types.
The gas supply for star formation in a galaxy is regulated by the infall of new material onto the parent dark matter halo as it grows. In massive halos at later times, the time required by the gas to fall and cool becomes much larger than the dynamical time and therefore halts the supply of cold gas for the galaxy. For CDM cosmology, it has been shown that the transition between infall-regulated and cooling flow regime occurs at a halo mass of around M⊙ (Birnboim & Dekel, 2003; Kereš et al., 2005).
Most of the galaxies in our sample, particularly all the low-mass galaxies must have infall-regulated supply of gas. Their future is therefore likely to depend on environment: BSphs in the low-density region can accrete more cold gas, therefore developing an intermediate– or large–scale disk, while those in the high density environment are prone to more lumpy accretion building an elliptical galaxy. A bit of both the processes is likely to result in a low-mass lenticular. It is possible that this is an ongoing process at all redshifts but because these galaxies have low mass, we are only able to observe them locally.
To conclude, our data suggest that although BSph galaxies are structurally similar to ellipticals and have physical and star-formation properties like spirals, statistically they are distinguishable from either of them in the multi-dimensional parameter space mapped by age, , and sSFR. Therefore, based on our analysis we conclude that some BSphs may evolve into disk galaxies in the future, while others in the low-density environments may evolve into small red ellipticals. But their currently observable properties statistically distinguish them from spirals as well as ellipticals.
8 Acknowledgements
GAMA is a joint European-Australasian project based around a spectroscopic campaign using the Anglo-Australian Telescope. The GAMA input catalogue is based on data taken from the Sloan Digital Sky Survey and the UKIRT Infrared Deep Sky Survey. Complementary imaging of the GAMA regions is being obtained by a number of independent survey programmes including GALEX MIS, VST KiDS, VISTA VIKING, WISE, Herschel-ATLAS, GMRT and ASKAP providing UV to radio coverage. GAMA is funded by the STFC (UK), the ARC (Australia), the AAO, and the participating institutions. The GAMA website is http://www.gama-survey.org/ . We are grateful to the reviewer for their suggestions and comments which helped improve this manuscript.
Mahajan is funded by the INSPIRE Faculty award (DST/INSPIRE/04/2015/002311), Department of Science and Technology (DST), Government of India.
References
- Abazajian et al. (2009) Abazajian K. N., et al., 2009, ApJS, 182, 543
- Baldry et al. (2010) Baldry I. K., et al., 2010, MNRAS, 404, 86
- Birnboim & Dekel (2003) Birnboim Y., Dekel A., 2003, MNRAS, 345, 349
- Cameron et al. (2009) Cameron E., Driver S. P., Graham A. W., Liske J., 2009, ApJ, 699, 105
- Charrad et al. (2012) Charrad M., Ghazzali N., Boiteau V., Niknafs A., 2012, UseR! 2012, CGB12a
- da Cunha, Charlot, & Elbaz (2008) da Cunha E., Charlot S., Elbaz D., 2008, MNRAS, 388, 1595
- Davies et al. (2016) Davies L. J. M., et al., 2016, MNRAS, 455, 4013
- Driver et al. (2006) Driver S. P., et al., 2006, MNRAS, 368, 414
- Driver et al. (2011) Driver S. P., et al., 2011, MNRAS, 413, 971
- Driver et al. (2016) Driver S. P., et al., 2016, MNRAS, 455, 3911
- Gordon et al. (2017) Gordon Y. A., et al., 2017, MNRAS, 465, 2671
- Graham, Dullo, & Savorgnan (2015) Graham A. W., Dullo B. T., Savorgnan G. A. D., 2015, ApJ, 804, 32
- Graham, Ciambur, & Savorgnan (2016) Graham A. W., Ciambur B. C., Savorgnan G. A. D., 2016, ApJ, 831, 132
- Graham et al. (2017) Graham A. W., Janz J., Penny S. J., Chilingarian I. V., Ciambur B. C., Forbes D. A., Davies R. L., 2017, ApJ, 840, 68
- George (2017) George K., 2017, A&A, 598, A45
- Giovanelli et al. (2005) Giovanelli R., et al., 2005, AJ, 130, 2598
- Gunawardhana et al. (2013) Gunawardhana M. L. P., et al., 2013, MNRAS, 433, 2764
- Haynes et al. (2011) Haynes M. P., et al., 2011, AJ, 142, 170
- Hopkins et al. (2003) Hopkins A. M., et al., 2003, ApJ, 599, 971
- Hopkins et al. (2013) Hopkins A. M., et al., 2013, MNRAS, 430, 2047
- Janowiecki et al. (2017) Janowiecki S., Catinella B., Cortese L., Saintonge A., Brown T., Wang J., 2017, MNRAS, 466, 4795
- Kannappan (2004) Kannappan S. J., 2004, ApJ, 611, L89
- Kannappan & Wei (2008) Kannappan S. J., Wei L. H., 2008, AIPC, 1035, 163
- Kannappan, Guie, & Baker (2009) Kannappan S. J., Guie J. M., Baker A. J., 2009, AJ, 138, 579
- Kauffmann et al. (2006) Kauffmann G., Heckman T. M., De Lucia G., Brinchmann J., Charlot S., Tremonti C., White S. D. M., Brinkmann J., 2006, MNRAS, 367, 1394
- Kaviraj (2010) Kaviraj S., 2010, MNRAS, 408, 170
- Kelvin et al. (2012) Kelvin L. S., et al., 2012, MNRAS, 421, 1007
- Kennicutt (1998) Kennicutt R. C., Jr., 1998, ARA&A, 36, 189
- Kereš et al. (2005) Kereš D., Katz N., Weinberg D. H., Davé R., 2005, MNRAS, 363, 2
- Kim et al. (2012) Kim T., et al., 2012, ApJ, 753, 43
- Liske et al. (2003) Liske J., Lemon D. J., Driver S. P., Cross N. J. G., Couch W. J., 2003, MNRAS, 344, 307
- Liske et al. (2015) Liske J., et al., 2015, MNRAS, 452, 2087
- Lopes et al. (2016) Lopes P. A. A., Rembold S. B., Ribeiro A. L. B., Nascimento R. S., Vajgel B., 2016, MNRAS, 461, 2559
- Loveday et al. (2012) Loveday J., et al., 2012, MNRAS, 420, 1239
- MacQueen (1967) Macqueen J., “Some methods for classification and analysis of multivariate observations”, Proc. Fifth Berkeley Symp. on Math. Statist. and Prob., Vol. 1 (Univ. of Calif. Press, 1967), 281, 297
- Moffett et al. (2016) Moffett A. J., et al., 2016, MNRAS, 462, 4336
- Mahajan et al. (2015) Mahajan S., et al., 2015, MNRAS, 446, 2967 (Paper I)
- Noeske et al. (2006) Noeske K. G., Koo D. C., Phillips A. C., Willmer C. N. A., Melbourne J., Gil de Paz A., Papaderos P., 2006, ApJ, 640, L143
- Robotham et al. (2010) Robotham A., et al., 2010, PASA, 27, 76
- Schawinski et al. (2009) Schawinski K., et al., 2009, MNRAS, 396, 818
- Tonry et al. (2000) Tonry J. L., Blakeslee J. P., Ajhar E. A., Dressler A., 2000, ApJ, 530, 625
- Wright et al. (2016) Wright A. H., et al., 2016, MNRAS, 460, 765