ALMA Twenty-six arcmin2 Survey of GOODS-S at One-millimeter (ASAGAO): X-ray AGN Properties of Millimeter-Selected Galaxies
Abstract
We investigate the X-ray active galactic nucleus (AGN) properties of millimeter galaxies in the Great Observatories Origins Deep Survey South (GOODS-S) field detected with the Atacama Large Millimeter/submillimeter Array (ALMA), by utilizing the Chandra 7-Ms data, the deepest X-ray survey to date. Our millimeter galaxy sample comes from the ASAGAO survey covering 26 arcmin2 (12 sources at a 1.2-mm flux-density limit of 0.6 mJy), supplemented by the deeper but narrower 1.3-mm survey of a part of the ASAGAO field by Dunlop et al. (2017). Fourteen out of the total 25 millimeter galaxies have Chandra counterparts. The observed AGN fractions at is found to be 90% and % for the ultra/luminous infrared galaxies with /= 12–12.8 and /= 11.5–12, respectively. The majority (2/3) of the ALMA and/or Herschel detected X-ray AGNs at appear to be star-formation dominant populations, having / ratios smaller than the “simultaneous evolution” value expected from the local black-hole mass to stellar mass (-) relation. On the basis of the and stellar mass relation, we infer that a large fraction of star-forming galaxies at have black hole masses smaller than those expected from the local - relation. This is opposite to previous reports on luminous AGN at same redshifts detected in wider and shallower surveys, which are subject to selection biases against lower luminosity AGN. Our results are consistent with an evolutionary scenario that star formation occurs first, and an AGN-dominant phase follows later, in objects finally evolving into galaxies with classical bulges.
1 Introduction
A key issue in cosmic evolution is the growth history of supermassive black holes (SMBHs) in galactic centers and their stellar populations, leading to the tight bulge-mass to SMBH-mass correlation observed in the present universe (see Kormendy & Ho 2013 for a recent review; following them, we use the term “bulge” only for classical bulges and elliptical galaxies). Overall good agreement between the star formation and mass accretion history from to (e.g., Boyle & Terlevich, 1998; Marconi et al., 2004; Ueda, 2015; Aird et al., 2015) implies that they seem to have mostly “co-evolved” on cosmological timescales. It is not yet clear, however, how strictly stars and the SMBH were coeval in an individual galaxy. Large dispersion in the bulge to SMBH mass ratio in high redshift objects suggests that the evolution processes are more complex than a simple “co-evolution” hypothesis and that the observational result may be largely subject to selection biases of the sample studied (Kormendy & Ho, 2013).
Both star formation and mass accretion co-moving densities peak at Madau & Dickinson (2014); Ueda et al. (2014), which is often referred as “cosmic noon”. Submillimeter observations discovered IR luminous galaxies (submillimeter galaxies; SMGs) at these redshifts, where violent star formation deeply enshrouded by dust takes place (e.g., Smail et al., 1997). These objects would be a key population for understanding the origin of galaxy-SMBH co-evolution; many theoretical studies suggest that major mergers trigger both star formation and mass accretion, making them appear as IR luminous galaxies containing an obscured AGN (e.g., Hopkins et al., 2006). Sensitive X-ray observations provide an efficient way for detecting such AGN (e.g., Alexander et al. 2005). Due to the limited angular resolution of previous (single-dish) sub/millimeter or FIR observatories (), however, it is often difficult to robustly determine their multiwavelength counterparts and thereby estimate their star formation rate and mass accretion rate.
The Atacama Large Millimeter/submillimeter Array (ALMA) is changing the situation thanks to its unprecedented angular resolution and sensitivity at sub/millimeter wavelengths. The GOODS-S region is one of the best fields for studying faint AGN in distant galaxies, because the deepest X-ray survey to date has been performed with the Chandra observatory there (Luo et al., 2017). On the basis of an ALMA follow-up of SMGs in the Extended-Chandra Deep Field South (E-CDFS) field (ALMA LABOCA E-CDFS Submillimeter Survey, ALESS; Hodge et al. 2013), Wang et al. (2013) determined the AGN fraction to be 15% at an X-ray flux limit of erg cm-2 s-1 (0.5–8 keV); hereafter we refer to these AGN as the “ALESS-AGN sample”. More recently, utilizing the Chandra 4 Ms and Karl G. Jansky Very Large Array (JVLA) survey catalogs, Rujopakarn et al. (2016) have identified 6 AGN from 16 millimeter galaxies in the GOODS-S/ultra deep field (UDF) detected by Dunlop et al. (2017) (hereafter D17), two of which were first discovered in the ALMA spectroscopic survey covering a 1 arcmin2 area in the UDF (ASPECS, Aravena et al. 2016). Using ALMA in cycle 3, our team has performed an unbiased deep 1.2-mm imaging survey over a 26 arcmin2 region inside the GOODS-S-JVLA field (Alma twenty-Six Arcmin2 survey of Goods-south At One-millimeter, ASAGAO), which fully encompasses the GOODS-S/UDF. This survey fills the gap in the survey parameter space (sensitivity and area) between the ALESS and the UDF survey. The results using the JVLA radio-continuum data, which are also important for identifying AGN, will be reported in a separate paper (Rujopakarn et al. in prep.).
In this paper, we investigate the X-ray AGN properties of millimeter galaxies detected in our survey and that by D17, utilizing the latest Chandra 7 Ms source catalog (Luo et al., 2017). We mainly refer to the FourStar Galaxy Evolution Survey (ZFOURGE) catalog for identification of ALMA sources detected in the ASAGAO (the source catalog will be presented in Hatsukade et al., in prep.). The ZFOURGE catalog also provides a sample of galaxies not detected with ALMA located in our survey region. We investigate relations among X-ray luminosity (or mass accretion rate), infrared luminosity (or star formation rate, SFR), and stellar mass of these samples, and discuss the implications on the galaxy-SMBH co-evolution at cosmic noon. Throughout the paper, we adopt the conversion from IR luminosity (without AGN contribution) to SFR as SFR/( yr-1) , which is based on Kennicutt (1998) re-calibrated for a Chabrier (2003) initial mass function (IMF)111Any SFR values quoted from the literature are re-scaled to this calibration.. The cosmological parameters of km s-1 Mpc-1, , and are adopted. The errors in the number fraction based on a small-size sample () are given at 1 confidence limits referring to Table 6 of Gehrels (1986).
2 Millimeter Galaxy Catalog
2.1 Observations and Source Detection
ALMA band 6 (1.2 mm) observations of the ( arcmin2) area of the ASAGAO were conducted in September 2016 in the C40-6 array configuration for a total observing time of 45 hours (Project code: 2015.1.00098.S, PI: K. Kohno). The details of the observations and data reduction are described in Hatsukade et al. (in prep.), and here we briefly summarize them. Two frequency tunings were adopted centered at 1.14 mm and 1.18 mm to cover a wider frequency range, whose central wavelength was 1.16 mm. The correlator was used in the time domain mode with a bandwidth of 2000 MHz (15.625 MHz 128 channels). Four basebands were used for each tuning, and the total bandwidth was 16 GHz covering the 244–248 GHz, 253–257 GHz, 259–263 GHz, and 268–272 GHz frequency ranges. The number of available antennas was 38–45.
The data were reduced with Common Astronomy Software Applications (CASA; McMullin et al., 2007). The maps were processed with the CLEAN algorithm with the task tclean222The adopted parameters are as follows: natural weighting, cell size of 0.15 arcsec, gridder of mosaic, specmode of muti-frequency synthesis, and nterms of 2.. Clean boxes were placed when a component with a peak signal-to-noise ratio (SN) above 5.0 is identified, and CLEANed down to a level. The observations were done with a higher angular resolution () than originally requested (), and we adopted a -taper of 160 k to improve the surface brightness sensitivity, which gives the final synthesized beamsize of and the typical rms noise level of 89 Jy beam-1.
Source detection was conducted on the image before correcting for the primary beam attenuation. The source and noise properties were estimated with the Aegean (Hancock et al., 2012) source-finding algorithm. We find 12 sources with a peak SN threshold of , whereas no negative source with a peak SN is found. The integrated flux density is calculated with elliptical Gaussian fitting. Table 1 (2–4th columns) lists the position of the peak intensity and the integrated flux density corrected for the primary beam attenuation with its error.
2.2 Definition of Our ALMA Sample
To supplement our ASAGAO sample, we also include fainter flux ALMA sources detected in the deep 1.3 mm image of the UDF (4.5 arcmin2 located inside the ASAGAO field) by D17. By position matching () and flux comparison, we find that the objects with IDs 3, 6, and 8 are identical to UDF1, UDF2, UDF3 in D17, respectively. Table 1 (5th column) lists the 1.3 mm flux density of the D17 sources. We refer to D17 for the positions of these sources except UDF1, UDF2, and UDF3 (2nd–3rd columns of Table 1). In addition, we find that ID 8 (UDF3) and UDF8 are also detected in the 1.2-mm continuum map of the ASPECS (Aravena et al., 2016). The 1.2 mm fluxes obtained by ASPECS are listed in the 6th column of Table 1 for these sources. The fluxes of UDF3 obtained from ASAGAO and ASPECS are consistent within the errors.
The ASAGAO sources are cross-matched against the ZFOURGE catalog (Straatman et al., 2016), after correcting for systematic astrometric offsets ( in RA and in Dec) with respect to the ALMA image, which are calibrated by the positions of stars in the Gaia Data Release 1 catalog (Gaia Collaboration, 2016) within the ASAGAO field. The ZFOURGE fully covers the ASAGAO 26 arcmin2 field, in which 3,000 objects are cataloged with limiting magnitudes of (AB) = 26.0 to 26.3 (5) at the 80% and 50% completeness levels with masking, respectively. We search for counterparts from the ZFOURGE catalog whose angular separation from the ALMA position is smaller than , corresponding to of the statistical positional error of ALMA for a point-like source; when a counterpart is largely extended (IDs 3 and 5), we allow a larger positional offset, up to 1 arcsec. Consequently, ZFOURGE counterparts are found for 10 sources, except for IDs 9 and 11. Since the chance probability that an unrelated object falls within a radius of is only 0.004 as calculated from the source density of the ZFOURGE catalog, we can safely assume that all of these ALMA-ZFOURGE associations are true 333Some ZFOURGE objects may be lensing galaxies.. We adopt the best-estimated redshift (spectroscopic or photometric) in the ZFOURGE catalog but refer to D17 for the UDF sample and IDs 3, 6, and 8. The adopted redshift is listed in the 14th column of Table 1. The differences between the photometric redshifts in ZFOURGE catalog and the spectroscopic redshifts in D17 are found to be with a median of 0.02. This indicates that the photometric redshift errors little affect our analysis and conclusions.
We regard the 23 sources with ZFOURGE counterparts (10 sources from the ASAGAO excluding IDs 9 and 11, and 13 sources from D17 excluding the overlapping sources UDF1, UDF2, and UDF3; hereafter the ASAGAO sample and the UDF sample, respectively) as the parent sample for our subsequent studies. All of them are also detected in FIR bands (70–160 m) with Herschel/PACS (Elbaz et al., 2011).
2.3 SED fitting and Infrared Luminosities
To estimate the infrared luminosities (and hence SFRs) of the ASAGAO sample, we analyze their spectral energy distribution (SED), utilizing the MAGPHYS code (da Cunha et al., 2008, 2015). We use 43 optical-to-millimeter photometric data including the ALMA, ZFOURGE, and de-blended Herschel/SPIRE photometries (Wang, T., et al. in prep.). Checking the ALMA spectra, we have confirmed that line contamination to the 1.2 mm continuum flux is ignorable in all the targets. We use MAGPHYS high-z excitation code for the sources at , whereas the MAGPHYS original package is applied for ID 5 (). In the SED fitting, the redshift is fixed to the value in Table 1. The resultant infrared luminosities in the rest-frame 8–1000 m band ()444The MAGPHYS code returns the 3–1000 m luminosities but we adopt these values as the conventional 8–1000 m band luminosities for the ASAGAO sample because the contribution of the 3–8 m band to total dust emission is negligible (Clemens et al., 2013). are listed in the 7th column of Table 1. Further details of the SED analysis are given in Yamaguchi et al. (in prep.).
The infrared luminosity of the ASAGAO sample we derive with the MAGPHYS code are found to be consistent with the values in D17 (for IDs 3, 6, and 8) and in Straatman et al. (2016) within 0.1–0.2 dex in most cases; the maximum difference of 0.5 dex is found for ID 8 (UDF3) between our result and D17, whose 1.3 mm flux density was corrected for unusually large line emission in the analysis of D17. Straatman et al. (2016) obtained the infrared luminosities by fitting the 24, 100, and 160 m photometry with the Wuyts et al. (2008) template. For the UDF sample we refer to D17 for 555Following the recipe in Section 6.3 of D17, we converted the SFRFIR1 values in their Table 4 into using the Murphy et al. (2011) relation with a minor correction from a Chabrier to a Kruopa IMF., which were obtained by a SED fit to 24 m to 1.3 mm photometry with the spectral template by Kirkpatrick et al. (2015). The listed values include an estimated 20% AGN contribution.
The flux densities of the ASAGAO sample range from 0.6 to 3 mJy. It bridges the ALESS sample (Hodge et al., 2013) 666By transforming the 850 m flux densities to the 1.2 mm ones, the ALESS fluxes reach a similar depth (mJy ) to that of the ASAGAO survey. The major difference is that the ALESS is pointed to bright SMGs, while the ASAGAO is a blind survey. and the UDF sample (D17), which contain brighter and fainter sub/millimeter galaxies than the ASAGAO sources, respectively. The majority of our sources with ZFOURGE counterparts are located at . No object at has been identified, although it is possible that the two sources (IDs 9 and 11) lacking redshift constraints are galaxies. This result is consistent with the findings by Aravena et al. (2016) and D17 that high-z galaxies are rare in the faint ALMA populations, as expected on the basis of the selection wavelength and depth of the survey (Béthermin et al., 2015). Eight out of the 10 identified ASAGAO sources have infrared luminosities larger than and hence are classified as “ultra-luminous infrared galaxies” (ULIRGs). The star forming rate (SFR) estimated from the infrared luminosity after subtracting an estimated 20% AGN contribution (D17) ranges 9–600 yr-1.
3 Cross Matching with Chandra 7 Ms Catalog
We cross-match the ALMA source list with the Chandra 7 Ms source catalog of the CDFS (Luo et al., 2017), which contains 1008 objects detected in 0.5–2 keV, 2–7 keV, and/or 0.5–7 keV bands, among which 137 objects are located within the ASAGAO field. The sensitivity limit of the Chandra data is erg cm-2 s-1 (0.5–7 keV) for a power law photon index of 1.4, which is not uniform in our ALMA survey region. A flux of erg cm-2 s-1 (0.5–7 keV) corresponds to an intrinsic 0.5–8 keV luminosity of / (erg s-1) = 41.7 and 41.9 for a source at with an absorption of = 20 and 23, respectively, assuming our model spectrum with a photon index of 1.9 (see below). X-ray counterparts are selected if the angular separation between the ALMA and Chandra sources is smaller than 3 times their combined positional error, which is dominated by the Chandra one (0.14–0.62 arcsec, depending on the photon counts). We found 14 X-ray counterparts to the 23 ALMA sources, 8 from the ASAGAO sample (10 objects) and 6 from the UDF sample (13 objects). We confirm that all 6 of the X-ray sources in the D17 sample reported by Rujopakarn et al. (2016) using the shallower Chandra 4 Ms catalog (Xue et al., 2011) are included. The probability of spurious identification is negligibly small, 0.01, which is estimated from the surface number density of the Chandra sources in our ALMA survey region ( deg-2).
Following the recipe described in Ueda et al. (2003), we estimate the column density and intrinsic (de-absorbed) luminosity of each Chandra object. As the model spectrum, we assume a cutoff power law spectrum plus its reflection component from optically-thick cold matter with a solid-angle of 2. Both the cutoff power law and its reflection are subject to intrinsic absorption at the source redshift and Galactic absorption, which is fixed at = cm-2. Such a reflection component from the torus and/or the accretion disk is known to be commonly present in the X-ray spectra of AGN (e.g., Kawamuro et al. 2016). From the hardness ratio of the vignetting corrected count rates in the 0.5–2 keV and 2–7 keV band, we first determine the apparent photon index by assuming no intrinsic absorption. If it is found to be larger than 1.9, then we adopt this value and consider no absorption. Otherwise, we fix the intrinsic photon index to 1.9 and determine the absorption to account for the observed hardness ratio. For objects detected only in the total (0.5–7 keV) band, we assume a photon index of 1.9 and an absorption column density of / cm-2 = 20. Then, the intrinsic luminosity is calculated based on the photon index and normalization. The statistical error in the hardness ratio is taken into account to estimate the uncertainties in the photon index, absorption, and intrinsic luminosity. The results are listed in the 11–13th columns of Table 1.
The X-ray detection rate of our ALMA sample is % (14 out of 23), and % for the ASAGAO sample (8 out of 10). We adopt similar criteria proposed by Wang et al. (2013) to classify an X-ray detected object as an AGN: (I) the effective photon index ( ) is smaller than 1.0 suggestive of intrinsic absorption, (II) the de-absorbed rest-frame 0.5–8 keV luminosity () is larger than erg s-1, (III) the apparent rest-frame 0.5–8 keV luminosity () is higher than 5 times that of star formation () estimated from the infrared luminosity according to the formula of Lehmer et al. (2010) 777, and (IV) the observed X-ray to MIR flux ratio is . We then regard sources that satisfy at least one criterion (the 15th column of Table 1) and have are AGN. The 13 ALMA-Chandra objects except UDF9 are classified as AGN.
For the 9 ALMA sources that are not detected with Chandra, we give in Table 1 (10th and 13th columns) a 90% confidence upper limit of the observed flux (converted from the count-rate upper limit in that position by assuming a photon index of 1.4, that of the X-ray background, with no absorption), and that of the intrinsic luminosity obtained by assuming a photon index of 1.9 and an absorption of / cm-2 = 23 as a typical spectrum of an obscured AGN when the redshift is known. We also perform stacking analysis of the 7 Ms Chandra images for these 9 sources with the CSTACK program888http://lambic.astrosen.unam.mx/cstack/, which utilizes event files reprocessed by Cappelluti (2016) and Williams et al. (2017). No significant signals are detected in the 0.5–2 keV and 2–8 keV bands with 90% upper limits of erg cm-2 s-1 and erg cm-2 s-1 for the mean fluxes, respectively (assuming a photon index of 1.4).
To investigate the nature of the X-ray sources in the ASAGAO field that are not detected with ALMA, we cross-match them with the ZFOURGE catalog in the same way as above. We find that out of the 123 ALMA-undetected Chandra sources, 111 have ZFOURGE counterparts, among which 95 are detected Herschel/PACS and hence have estimates of their infrared luminosities. When we limit the redshift range to , where most of the ALMA-Chandra sources reside, there are 49 Chandra sources within the ASAGAO field, out of which 46 have ZFOURGE counterparts. Among them, 13 are detected with ALMA (and also with Herschel), 26 with Herschel only, and 7 are neither detected with ALMA nor with Herschel. For comparison with our ASAGAO and UDF sample, we refer to the ALMA-undetected but Herschel-detected Chandra AGN at as the “Herschel-AGN sample” in the subsequent discussions.
4 Results and Discussion
4.1 Correlation between Star Formation Rate and Stellar Mass
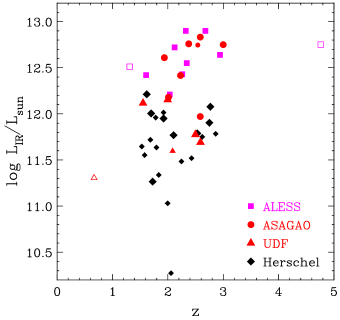
Figures 1 and 2 plot the relation between infrared luminosity and redshift and that between stellar mass () and SFR, respectively, for the X-ray sources in the ASAGAO and UDF samples (red circles and triangles), the ALESS-AGN sample (magenta squares), and the Herschel-AGN sample (black diamonds). We refer to Wang et al. (2013) and Straatman et al. (2016) for the infrared luminosities of the ALESS-AGN and Herschel-AGN samples, respectively. For all the samples, we estimate the SFRs from after subtracting an assumed 20% AGN contribution. The stellar masses (listed in the 8th column in Table 1) are taken from the ZFOURGE catalog (Straatman et al., 2016) for the ASAGAO (except IDs 3, 6, and 8) and Herschel-AGN samples, from D17 for the UDF sample and IDs 3, 6, and 8, and from Wang et al. (2013) for the ALESS-AGN sample (re-calibrated for a Chabrier IMF). All the values were derived with multiwavelength SED analyses by assuming the solar abundances, and represent the total stellar masses in the galaxies. In the figure, we draw the “main sequence” lines at , , and according to Speagle et al. (2014). Figure 1 indicates that most of the ALMA-Chandra AGN belong to main-sequence star-forming galaxies (SFGs), although a few ASAGAO objects are classified as starburst galaxies, being located more than 0.6 dex above the main-sequence line (Rodighiero et al. 2011). This is consistent with previous ALMA survey results for faint sub/millimeter galaxies (e.g., Hatsukade et al., 2015; Yamaguchi et al., 2016). The ALMA undetected AGN generally follow the same correlation at lower stellar-mass or SFR ranges.

4.2 AGN Fraction
We derive the AGN fraction in the millimeter galaxies down to an X-ray flux limit of erg cm-2 s-1 (0.5–7 keV), which is 5 times fainter than that of the ALESS-AGN sample (Wang et al., 2013). Following Wang et al. (2013), we calculate the cumulative AGN fraction at as , where the suffix (1 through ) represents each Chandra-identified AGN with a flux of and is the total number of ALMA objects that would be detected if they had fluxes brighter than . We find that the AGN fraction in the ASAGAO sample (with a flux-density limit of 0.6 mJy at 1.2 mm) is % at erg cm-2 s-1 (0.5–7 keV), whereas that in the UDF sample covering a flux density range of 0.15–0.31 mJy at 1.3 mm (or 0.18–0.39 mJy at 1.2 mm) is % at erg cm-2 s-1 (0.5–8 keV). When we limit the sample to those at , we obtain AGN fractions of % in the ASAGAO sample and % in the UDF sample (at the same X-ray flux limits as above).
The best-estimated AGN fraction obtained from the ASAGAO sample is higher than that from the UDF sample, although the significance of the difference is marginal due to the limited sample size. This is most likely related to the lower SFRs (hence lower IR luminosities) or smaller stellar masses in the latter sample. In fact, when we divide the combined ASAGAO+UDF sample at by IR luminosity, we find AGN fractions of % at erg cm-2 s-1 (0.5–7 keV) for the ULIRGs ( = 12–12.8), and % at erg cm-2 s-1 (0.5–8 keV) for the LIRGs ( = 11.5–12). The trend is consistent with previous results that the AGN fraction is small among faint millimeter galaxies (Fujimoto et al., 2016) or among galaxies with small stellar masses (Kriek et al., 2007; Yamada et al., 2009; Wang et al., 2017).
Our ASAGAO result (90%) is even higher than that by Wang et al. (2017), who obtained an AGN fraction of 50% among their green-color galaxy sample with . This may be related to the fact that the high-resolution observations of ALMA are biased towards more compact objects; if that is the case, these results imply that compact SFGs have remarkably high AGN fractions, as suggested by Chang et al. (2017) for AGN. On the other hand, the ALESS sources, whose stellar masses are larger than the ASAGAO sample (Figure 1), apparently shows a much smaller AGN fraction (20%) than ours. A primary reason is its brighter X-ray flux limit, because most of the ALESS region (E-CDFS) is covered only by 250 ks exposure of Chandra. Indeed, when we impose the same X-ray flux limit as for the ALESS-AGN sample ( erg cm-2 s-1), the AGN fraction for the ASAGAO sample becomes 25%, consistent with the ALESS result. Namely, many AGN in these millimeter galaxies are not X-ray luminous, and hence are only detectable with very deep X-ray data. This trend implies that even 90% may be a lower limit, getting higher when the Chandra exposure increases beyond 7 Ms.
4.3 X-ray Absorption Properties
Among the 12 ALMA-Chandra sources for which the X-ray hardness ratio is available, 7 have best-fit absorption column densities of (classified as “X-ray type-1 AGN” according to Ueda et al. 2003) and 5 show (“X-ray type-2 AGN”). While the obscuration fraction (5 out of 12) is consistent with that found from hard X-ray (3–24 keV) detected U/LIRGs in the COSMOS field at (12 out of 23, Matsuoka & Ueda 2017), it looks much smaller than those of local U/LIRGs; according to a recent study by Ricci et al. (2017), more than 90% of AGN in late-merger galaxies are subject to heavy obscuration . Since the X-ray luminosity range of our ALMA-Chandra sample is similar to that of typical local U/LIRGs (§ 4.4), the difference cannot be explained by the luminosity dependence of the absorbed AGN fraction (Ueda et al., 2003). In local ULIRGs, star formation activity is concentrated at the nucleus within kpc (Soifer et al., 2000). By contrast, on the basis of JVLA and ALMA imaging, Rujopakarn et al. (2016) reported that main sequence SFGs at with SFR 100 yr-1 have extended (4 kpc diameter) star-forming regions, whereas the size becomes more compact in more luminous SMGs (see also Chapman et al. 2004; Biggs & Ivison 2008; Ivison et al. 2011 for results of radio observations). The difference in the host star-forming properties between our ALMA-Chandra sample and local ULIRGs would be related to the amount of obscuring gas/dust around the nucleus.
We have to bear in mind, however, that the uncertainty in the column density is often quite large due to the limited photon statistics; a few objects (e.g., ID 1 and UDF7) tentatively classified as unobscured AGN could be even Compton-thick AGN () within the error. In an extreme case, only an unabsorbed scattered component coming from outside the torus may be detected with Chandra in heavily Compton-thick AGN; subh objects would be misidentifed as (low luminosity) X-ray type-1 AGN. In fact, according to a standard population synthesis model of the X-ray background (Ueda et al., 2014), the fraction of Compton-thick AGN at erg cm-2 s-1 (0.5–7 keV) is predicted to be 20%. This corresponds to 3 out of the 14 Chandra objects, whereas only one object is identified as Compton thick based on the best-fit hardness ratio. Nevertheless, considering the small number of possible additional Compton-thick AGN (2), main conclusions, discussed below, are not largely affected by this uncertainty, as long as the standard X-ray background model is correct.
4.4 Correlation between Infrared and X-ray Luminosities
In SFGs containing AGN, the X-ray and infrared luminosities are good indicators of the mass accretion rate onto the SMBH () and (dust-embedded) SFR, respectively. Figure 3 plots the relation between the infrared luminosity in the rest frame 8–1000 m band () and the intrinsic X-ray luminosity () for our ALMA-Chandra (ASAGAO+UDF) objects. We also plot the Herschel-AGN sample, for which is taken from Straatman et al. (2016) and is determined from the Chandra count rates in the same way as for the ALMA-Chandra objects. Furthermore, we plot the ALESS-AGN sample from Wang et al. (2013), the NuSTAR detected U/LIRGs in the COSMOS field from Matsuoka & Ueda (2017), and local ULIRGs for which results from hard X-ray (10 keV) observations with NuSTAR are published. All the values quoted in Figure 3 are total IR luminosities including both star-forming and AGN contributions. In the figure, we mark the - relation expected from pure star formation activity, based on the formula by Lehmer et al. (2010) at SFR yr-1. We also mark the relation observed in Palomer-Green (PG) QSOs (i.e., AGN-dominant population, Teng & Veilleux 2010).
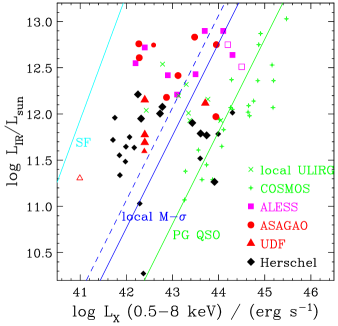
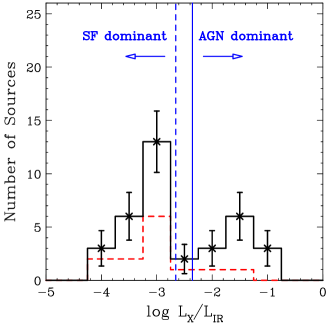
We find that our ALMA-Chandra AGN occupy a similar region to local ULIRGs, having a large scatter (2 dex) in the / ratio. Typical statistical errors in and which are 0.2 dex and 0.1 dex, respectively (Table 1), are much smaller than the scatter. The possible systematic uncertainties in (0.1–0.2 dex, Section 2) also do not affect our conclusions. Figure 4 displays the histogram of / for our ALMA-Chandra AGN and that including the Herschel-AGN sample. Bimodal distribution is strongly suggested in the latter histogram. More than half of the sources are distributed around a peak centered at / , whereas a non-negligible fraction of them show higher / ratios consistent with AGN-dominant populations. While such a large variation in the - relation is known in the local universe by combining various samples with different selections (see e.g., Figure 8 of Alexander et al. 2005), here we find a similar - variation at by directly detecting individual objects on the basis of very deep X-ray and millimeter observations of the common survey field. The mean IR luminosities for subsamples with = 42–43 and 43–44 are / = and , respectively, which are similar to each other. This is consistent with the result by Stanley et al. (2015) utilizing stacking analysis that the mean IR luminosities are fairly constant against X-ray luminosity at each redshift. Our result is quite different from previous studies inevitably biased for luminous AGN owning to their bright flux limits (e.g., see Figure 2 of Willott et al. 2013 for optical wide-area surveys, and Matsuoka & Ueda 2017 for a hard X-ray survey with NuSTAR in the COSMOS field), whose samples are predominantly located around the PG QSO line in Figure 3.
It is interesting to compare our result with the prediction of the co-evolution scenario. We assume the relation (for a Chabrier IMF)
| (1) |
The X-ray luminosity can be converted to a mass accretion rate onto the SMBH by assuming a radiative efficiency and a bolometric correction factor as
| (2) |
where is the light speed. Here we adopt , as estimated by comparison of the local SMBH mass density and the most updated AGN luminosity function (Ueda et al., 2014)999 This estimate of depends on , for which Ueda et al. (2014) assumed luminosity-dependent values by Hopkins et al. (2007). If a constant value of = 45 were adopted, we would obtain . This moves the blue lines in Figures 3 and 4 rightward by 0.3 dex but does not change our conclusions.. By analyzing the combined IR-to-mm SED of their sample, D17 estimated that the averaged fractional AGN contribution to the IR luminosity is 20%. Thus, assuming that 20% of is the intrinsic AGN bolometric luminosity, we can estimate an averaged bolometric correction factor by comparing with observed X-ray luminosities. Here we ignore X-ray undetected objects because their intrinsic X-ray luminosities would be highly uncertain if we take into account a possibility of heavily Compton-thick obscuration. Taking a luminosity-weighted average of AGN in the ASAGAO, UDF, and Herschel-AGN samples, we find (or , a bolometric correction factor from the 2–10 keV luminosity, converted by assuming a photon index of 1.9).
If the galaxy-SMBH evolution is exactly simultaneous over cosmic time, we expect the relation
| (3) |
where is the return fraction (the fraction of stellar masses that are ejected back to interstellar medium; for a Chabrier IMF), and is the mass ratio of stars to SMBHs in the local universe. Here we consider two cases: for the stellar masses only in bulge components and for the total stellar masses in both bulges and disks. As a representative value, we use , based on the latest calibration by Kormendy & Ho (2013) at a bulge mass of . Adopting a total (bulge+disk) stellar mass density of (see Madau & Dickinson 2014 and references therein) and a SMBH mass density of (Ueda et al., 2014) in the local universe, we estimate 400. By the clustering analysis of galaxies in the COSMOS field, Béthermin et al. (2014) suggested that most of galaxies with (for a Salpeter IMF) at evolve into bulge-dominated galaxies at , whereas a part of SFGs with at become SFGs or passive galaxies with at . Thus, we expect that the majority of our objects are likely the progenitors of local bulge-dominated galaxies, although a small fraction of them, with , may end up in local disk-galaxies. We therefore adopt as the main assumption in the following discussions.
Combining equations (1), (2) and (3), we show the “simultaneous evolution” relations in the vs plane by the blue solid (dashed) line in Figures 3 and 4 for the bulge (total) stellar masses. Many objects are not tightly distributed along either of these lines, suggesting that the evolution is not simultaneous in individual galaxies. The “non-coeval” nature is consistent with the finding by Yamada et al. (2009) based on K-band selected galaxies at , although they did not use far-IR/mm data to estimate the SFR. It is seen that the majority of the sources are located above the lines; if our assumptions are correct, stars would be forming more rapidly than SMBH in these galaxies. There is also a significant fraction of objects located below this line, in which SMBHs are growing more rapidly than the stars.
We note that the bolometric correction factor estimated above, , is larger than a nominal value for AGN with similar X-ray luminosities (), (Rigby et al., 2009). Vasudevan & Fabian (2007) showed, however, that the bolometric correction factor sharply correlates with Eddington ratio rather than luminosity: the mean value of rapidly increases to 70 (or ) at . This would imply that the Eddington ratio of our AGN is high, that is, they contain a rapidly growing SMBH with a relatively small black hole mass.
4.5 Correlation between X-ray Luminosity and Stellar Mass
Figure 5 plots the correlation between X-ray luminosity and total stellar mass for the AGN in the ASAGAO, UDF, Herschel-AGN samples. Adopting a bolometric correction factor , we plot the relations that would be expected if the ratio of the stellar mass to the black hole mass were for 3 assumed values of the Eddington ratio ( = 0.01, 0.1, and 1). Apparently, the majority of the AGN are located around the line indicative of inefficient SMBH accretion. This directly contradicts the previous argument that the SMBHs in our AGN sample have high Eddington ratios () in average. Time variability in the instantaneous mass accretion rate (hence in ), which could produce a large -to- variation (Hickox et al., 2014), cannot explain this contradiction, as long as we assume the local - relation. This discrepancy can be solved, however, if the black hole mass is times smaller than that expected from the stellar mass with the local - relation, that is, . In Figure 5, we also plot the ALESS-AGN sample at ; assuming that their Eddington ratios are also high, they would have similarly large values on average. This implies that these small black-hole mass systems may be young galaxies, although we cannot find clear correlation between the / ratio and the galaxy age derived from the SED fit (available in the ZFOURGE catalog). We leave it a future task to pursue this issue using a larger sample.
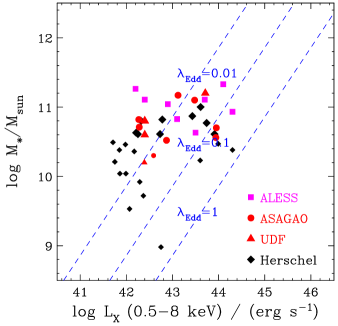
We thus infer that the majority of the ALMA/Herschel and Chandra detected population, a representative sample of SFGs with / hosting AGN at , are in a star-formation dominant phase and contain small SMBHs compared to their stellar mass. This picture is in line with earlier suggestions for more luminous (hence rare) SMGs, which are suggested to contain small SMBHs (e.g., Alexander et al., 2005, 2008; Tamura et al., 2010). This may appear to be in contrast to previous reports that luminous AGN are in an AGN-dominant phase (e.g., Matsuoka & Ueda, 2017) and have larger SMBHs than those expected from the local - relation (see Figure 38 of Kormendy & Ho 2013 for a summary). We argue that the apparent contradiction is due to selection bias for luminous AGN in such studies. In fact, a non-negligible fraction (20%) of the whole sample, mostly X-ray luminous objects, are located at lines in Figure 5. They may have SMBHs larger than those expected from the local - relation and truly be accreting with .
Recalling that the majority of our sample are likely the progenitors of local bulge-dominated galaxies, the SF dominant galaxies with small SMBHs must experience an AGN-dominant phase later, to make the tight - relation at . Indeed, such AGN-dominant, X-ray luminous populations are present in our sample, and even more luminous AGN were detected in wider and shallower surveys. Our results are consistent with an evolutionary scenario that star formation occurs first, and an AGN-dominant phase follows later (e.g., Hopkins et al., 2008; Netzer, 2009), at least in objects finally evolving into galaxies with classical bulges. If this is the case, the dichotomy in the / distribution (Figure 4) would mean that the transition time from the star-formation dominant phase to the AGN dominant one is short. It is interesting that, despite of the wide diversity of populations at , the mass-accretion rate density and the SFR density appear to “co-evolve” by roughly keeping the local - relation (e.g., Mullaney et al., 2012). We suggest that the “co-evolution” view is only valid when the mass accretion rate and SFR are averaged over a cosmological timescale for an individual galaxy, or when they are averaged for a large number of galaxies in different evolutionary stages at a given epoch.
5 Conclusions
We have reported the first results from our 26 arcmin2 ALMA deep survey at the 1.2 mm wavelength on the GOODS-S field (ASAGAO) project, supplemented by the deeper and narrower 1.3 mm survey by D17. This paper focuses on the X-ray AGN properties utilizing the Chandra 7 Ms survey data. The main conclusions are summarized as follows.
-
1.
From the ASAGAO survey, we detected 12 millimeter galaxies with signal-to-noise ratio at a flux limit of 0.6 mJy, among which 10 are identified by the ZFOURGE catalog. Most of them are luminous ( / ) main-sequence SFGs at .
-
2.
The AGN fraction in the ALMA detected galaxies at is found to be 90% for the ULIRGs with /= 12–12.8 and % for the LIRGs with /= 11.5—12. The high AGN fractions among U/LIRGs have been revealed thanks to the much deeper X-ray flux limit ( erg cm-2 s-1 in the 0.5–7 keV band) than those in previous studies.
-
3.
There is a large variation in the / relation in the ALMA and/or Herschel detected X-ray AGN at . About two thirds of them have / ratios smaller than the value expected from the local black-hole mass to stellar mass (-) relation. This suggests that the exactly simultaneous co-evolution does not take place in individual galaxies.
-
4.
If the local - relation is assumed, the majority of these AGN apparently show . This contradicts a large bolometric correction factor () estimated from the IR SED analysis by D17 and the X-ray luminosities. We infer that a large fraction of star-forming galaxies hosting AGN at have black hole masses smaller than those expected from the local - relation. These results are consistent with an evolutionary scenario that star formation occurs first, and an AGN-dominant phase follows later, at least in objects finally evolving into galaxies with classical bulges.
References
- Aird et al. (2015) Aird, J. et al. 2015, MNRAS, 451, 1892
- Alexander et al. (2005) Alexander, D. M. et al. 2005, ApJ, 632, 736
- Alexander et al. (2008) Alexander, D. M. et al. 2008, AJ, 135, 1968
- Aravena et al. (2016) Aravena, M. et al. 2016, ApJ, 833, 68
- Béthermin et al. (2014) Béthermin, M. et al. 2014, A&A, 577, A103
- Béthermin et al. (2015) Bt́hermin, M., De Breuck, C., Sargent, M., Daddi, E. 2015, A&A, 573, 113
- Biggs & Ivison (2008) Biggs, A. D., & Ivison, R. J. 2008, MNRAS, 385, 893
- Boyle & Terlevich (1998) Boyle, B. J., & Terlevich, R. J. 1998, MNRAS, 293, L49
- Cappelluti (2016) Cappelluti, N. et al. 2016, ApJ, 823, 95
- Chabrier (2003) Chabrier, G. 2003, PASP, 115, 763
- Chang et al. (2017) Chang, Y.-Y. et al. 2017, MNRAS, 466, L103
- Chapman et al. (2004) Chapman, S. C., Smail, I., Windhorst, R., Muxlow, T., Ivison, R. J. 2004, ApJ, 611, 732
- Clemens et al. (2013) Clemens, M. S. et al. 2013, MNRAS, 433, 695
- da Cunha et al. (2008) da Cunha, E., Charlot, S., & Elbaz, D. 2008, MNRAS, 388, 1595
- da Cunha et al. (2015) da Cunha, E., Walter, F., Smail, I. R., et al. 2015, ApJ, 806, 110
- Dunlop et al. (2017) Dunlop, J. S. et al. 2017, MNRAS, 466, 861 (D17)
- Elbaz et al. (2011) Elbaz, D. et al. 2011, A&A, 533, A119
- Fujimoto et al. (2016) Fujimoto, S. et al. 2016, ApJS, 222,
- Gaia Collaboration (2016) Gaia Collaboration, 2016, A&A, 595, A2
- Gehrels (1986) Gehrels, N. 1986, ApJ, 303, 336
- Hancock et al. (2012) Hancock, P. J., Murphy, T., Gaensler, B. M., Hopkins, A., & Curran, J. R. 2012, MNRAS, 422, 1812
- Hatsukade et al. (2015) Hatsukade, B. et al. 2015, ApJ, 810, 91
- Hickox et al. (2014) Hickox, R. C. et al. 2014, ApJ, 782, 9
- Hodge et al. (2013) Hodge, J. A., et al. 2013, ApJ, 768, 91
- Hopkins et al. (2006) Hopkins, P. F., et al. 2006, ApJS, 163, 1
- Hopkins et al. (2007) Hopkins, P. F., Richards, G. T., & Hernquist, L. 2007, ApJ, 654, 731
- Hopkins et al. (2008) Hopkins, P. F., Hernquist, L., Cox, T. J., & Kereš, D. 2008, ApJS, 175, 356
- Ivison et al. (2011) Ivison, R. J. et al. 2011, MNRAS, 412, 1913
- Kawamuro et al. (2016) Kawamuro, T., Ueda, Y., Tazaki, F., Ricci, C., & Terashima, Y. 2016, ApJS, 225, 14
- Kennicutt (1998) Kennicutt, R. C., Jr. 1998, ApJ, 498,
- Kirkpatrick et al. (2015) Kirkpatrick, A. et al. 2015, ApJ, 814, 9
- Kormendy & Ho (2013) Kormendy, J., & Ho, L. C. 2013, ARA&A, 51, 511
- Kriek et al. (2007) Kriek, M., et al. 2007, ApJ, 669, 776
- Lehmer et al. (2010) Lehmer, B. D., et al. 2010, ApJ, 724, 559
- Luo et al. (2017) Luo, B. et al. 2017, ApJS, 228, 2
- Madau & Dickinson (2014) Madau, P., & Dickinson, M. 2014, ARA&A, 52, 415
- Marconi et al. (2004) Marconi, A., et al. 2004, MNRAS, 351, 169
- Matsuoka & Ueda (2017) Matsuoka, K. & Ueda, Y. 2017, ApJ, 838, 128 (Erratum: 844, 172)
- McMullin et al. (2007) McMullin, J. P., Waters, B., Schiebel, D., Young, W., & Golap, K. 2007, Astronomical Data Analysis Software and Systems XVI, 376, 127
- Mullaney et al. (2012) Mullaney, J.R., et al., 2012, ApJ, 753, L30
- Murphy et al. (2011) Murphy, E.J., et al., 2011, ApJ, 737, 67
- Netzer (2009) Netzer, H. 2009, MNRAS, 399, 1907
- Oda et al. (2017) Oda, S. et al. 2017, ApJ, 835, 179
- Ricci et al. (2017) Ricci, C. et al. 2017, MNRAS, 468, 1273
- Rigby et al. (2009) Rigby, J. R., Diamond-Stanic, A. M., & Aniano, G. 2009, ApJ, 700, 1878
- Rodighiero et al. (2011) Rodighiero, G., et al. 2011, ApJ, 739, L40
- Rujopakarn et al. (2016) Rujopakarn, W., et al. 2016, ApJ, 833, 12
- Smail et al. (1997) Smail, I., Ivison, R. J., Blain, A. W. 1997, ApJ, 490, L5
- Soifer et al. (2000) Soifer, B. T. et al. 2000, AJ, 119, 509
- Speagle et al. (2014) Speagle, J. S., Steinhardt, C. L., Capak, P. L., & Silverman, J. D. 2014, ApJS, 214, 15
- Stanley et al. (2015) Stanley, F. et al. 2015, MNRAS, 453, 591
- Straatman et al. (2016) Straatman, C. M. S. 2016, ApJ, 830, 51
- Tamura et al. (2010) Tamura, Y., et al. 2010, ApJ, 724, 127
- Teng & Veilleux (2010) Teng, S. H. & Veilleux, S. 2010, ApJ, 725, 1848
- Teng et al. (2015) Teng, S. H., Rigby, J. R., Stern, D., et al. 2015, ApJ, 814, 56
- Ueda et al. (2003) Ueda, Y., Akiyama, M., Ohta, K., Miyaji, T. 2003, ApJ, 598, 886
- Ueda et al. (2014) Ueda, Y. et al. 2014, ApJ, 786, 104
- Ueda (2015) Ueda, Y. 2015, Proceedings of the Japan Academy, Ser. B, 91, 175
- Vasudevan & Fabian (2007) Vasudevan, R. V., & Fabian, A. C. 2007, MNRAS, 381, 1 235
- Wang et al. (2013) Wang, S. X., et al. 2013, ApJ, 778, 179
- Wang et al. (2017) Wang, T., Elvaz, D., Alexander, D. M. et al. 2017, A&A, 601, A63
- Williams et al. (2017) Williams, C. et al. 2017, ApJ, 838, 94
- Willott et al. (2013) Willott, C. J., Omont, A., Bergeron, J. 2013, ApJ, 770, 13
- Wuyts et al. (2008) Wuyts, S., et al. 2008, ApJ, 682, 985
- Xue et al. (2011) Xue, Y. Q., Luo, B., Brandt, W. N. et al. 2011, ApJS, 195, 10
- Yamada et al. (2009) Yamada, T., et al. 2009, ApJ, 699, 1354
- Yamaguchi et al. (2016) Yamaguchi, Y., et al. 2016, PASJ, 68, 82
| ID | RA | Dec | CID | AGN flag | ||||||||||
|---|---|---|---|---|---|---|---|---|---|---|---|---|---|---|
| (h m s) | (d m s) | (mJy) | (mJy) | (mJy) | () | () | (erg cm-2 s-1) | (cm-2) | (erg s-1) | |||||
| (1) | (2) | (3) | (4) | (5) | (6) | (7) | (8) | (9) | (10) | (11) | (12) | (13) | (14) | (15) |
| 1 | 03:32:28.51 | –27:46:58.37 | 2.580.17 | 12.760.01 | 10.8 | 522 | 4.7 | 20.0 | 1.92 | 42.3 | 2.38 | NNYN | ||
| 2 | 03:32:35.72 | –27:49:16.26 | 2.160.15 | 12.83 | 11.1 | 666 | 39.0 | 23.6 | 1.9 | 43.50.1 | 2.582 | YYYN | ||
| 3 (=UDF1) | 03:32:44.04 | –27:46:35.90 | 1.530.18 | 0.920.08 | 12.750.01 | 10.70.10 | 805 | 107.0 | 20.0 | 2.09 | 44.00.1 | 3.00 | NYYY | |
| 4 | 03:32:47.59 | –27:44:52.39 | 1.100.15 | 12.610.01 | 10.7 | 852 | 8.1 | 22 (fixed) | 1.9 | 42.30.2 | 1.94 | NNYN | ||
| 5 | 03:32:32.90 | –27:45:40.95 | 1.400.19 | 11.000.01 | 10.3 | 6.9 | 23 (fixed) | 1.9 | 41.5 | 0.523 | ||||
| 6 (=UDF2) | 03:32:43.53 | –27:46:39.27 | 1.440.22 | 1.000.09 | 12.50 | 11.10.15 | 7.5 | 23 (fixed) | 1.9 | 42.8 | 2.92 | |||
| 7 | 03:32:29.25 | –27:45:09.94 | 0.890.17 | 12.18 | 10.5 | 538 | 10.5 | 24.0 | 1.9 | 42.9 | 2.01 | YYNN | ||
| 8 (=UDF3) | 03:32:38.55 | –27:46:34.52 | 0.720.14 | 0.860.08 | 0.5530.014 | 12.750.01 | 10.30.15 | 718 | 4.5 | 20.0 | 2.44 | 42.60.2 | 2.62 | NYYN |
| 9 | 03:32:36.75 | –27:48:03.81 | 1.050.25 | 2.3 | ||||||||||
| 10 | 03:32:44.60 | –27:48:36.18 | 0.620.14 | 11.970.01 | 10.6 | 818 | 145.0 | 23.1 | 1.9 | 43.90.1 | 2.593 | NYYY | ||
| 11 | 03:32:49.45 | –27:49:09.21 | 1.340.31 | 5.7 | ||||||||||
| 12 | 03:32:31.47 | –27:46:23.38 | 1.110.28 | 12.420.01 | 11.2 | 587 | 26.3 | 23.3 | 1.9 | 43.10.1 | 2.225 | YYYN | ||
| UDF4 | 03:32:41.01 | –27:46:31.58 | 0.300.05 | 11.920.02 | 10.50.15 | 4.6 | 23 (fixed) | 1.9 | 42.5 | 2.43 | ||||
| UDF5 | 03:32:36.95 | –27:47:27.13 | 0.310.05 | 11.950.03 | 10.40.15 | 3.9 | 23 (fixed) | 1.9 | 42.2 | 1.759 | ||||
| UDF6 | 03:32:34.43 | –27:46:59.77 | 0.240.05 | 11.880.06 | 10.50.10 | 5.1 | 23 (fixed) | 1.9 | 42.1 | 1.411 | ||||
| UDF7 | 03:32:43.32 | –27:46:46.91 | 0.230.05 | 11.690.18 | 10.60.10 | 797 | 6.6 | 20.0 | 1.9 | 42.4 | 2.59 | NNYN | ||
| UDF8 | 03:32:39.74 | –27:46:11.63 | 0.210.05 | 0.2230.022 | 12.120.27 | 11.20.15 | 748 | 284.0 | 22.6 | 1.9 | 43.70.1 | 1.552 | NYYY | |
| UDF9 | 03:32:43.42 | –27:46:34.46 | 0.200.04 | 11.310.48 | 10.00.10 | 799 | 4.2 | 22 (fixed) | 1.9 | 41.00.2 | 0.667 | NNNN | ||
| UDF10 | 03:32:40.75 | –27:47:49.09 | 0.180.05 | 11.600.22 | 10.20.15 | 756 | 2.5 | 20.0 | 3.00 | 42.40.2 | 2.086 | NNYN | ||
| UDF11 | 03:32:40.06 | –27:47:55.82 | 0.190.05 | 12.150.26 | 10.80.10 | 751 | 9.3 | 21.8 | 1.90 | 42.4 | 1.996 | NNYN | ||
| UDF12 | 03:32:41.28 | –27:47:42.61 | 0.150.04 | 11.510.17 | 9.60.15 | 2.0 | 23 (fixed) | 1.9 | 42.7 | 5.000 | ||||
| UDF13 | 03:32:35.09 | –27:46:47.78 | 0.170.04 | 11.780.12 | 10.80.10 | 655 | 4.7 | 20.0 | 2.07 | 42.4 | 2.497 | NNYN | ||
| UDF14 | 03:32:40.96 | –27:46:55.34 | 0.160.04 | 11.590.17 | 9.70.10 | 3.3 | 23 (fixed) | 1.9 | 41.5 | 0.769 | ||||
| UDF15 | 03:32:35.75 | –27:46:54.98 | 0.170.05 | 11.520.31 | 9.90.15 | 1.8 | 23 (fixed) | 1.9 | 41.8 | 1.721 | ||||
| UDF16 | 03:32:42.37 | –27:47:07.79 | 0.150.04 | 11.550.20 | 10.90.10 | 4.0 | 23 (fixed) | 1.9 | 42.0 | 1.314 |
Note. — (1) ALMA source ID (those with “UDF” correspond to the D17 sources), (2)(3) ALMA source position (J2000), (4) ALMA integrated flux-density and 1 error at 1.2 mm derived from the ASAGAO survey, (5) those at 1.3 mm derived from the UDF survey (D17), (6) those at 1.2 mm derived from the ASPECS (Aravena et al., 2016), (7) infrared luminosity in the rest 8–1000 m band in units of solar luminosity (taken from D17 for the UDF sample and based on our SED fit for the ASAGAO sample) and its 1 error, (8) stellar mass in units of solar mass (taken from D17 for the UDF sample and IDs. 3, 6, and 8, and from Straatman et al. (2016) for the rest), (9) Chandra source ID in Luo et al. (2017), (10) observed X-ray flux (or 90% confidence upper limit) in the 0.5–7 keV band converted from a count rate in the 0.5–7, 0.5–2, or 2–7 keV band with the apparent photon index , (11) X-ray absorption hydrogen column density, (12) intrinsic photon index, (13) absorption-corrected X-ray luminosity (or 90% confidence upper limit) in the rest-frame 0.5–8 keV band (14) adopted redshift (after Straatman et al. 2016 or D17; 3 decimal digits for spectroscopic redshifts and 2 for photometric redshifts), (15) AGN flags for the criteria I through IV.