ALMA Detection of Interstellar Methoxymethanol (\ceCH3OCH2OH)
Abstract
We report the detection of interstellar methoxymethanol (\ceCH3OCH2OH) in ALMA Bands 6 and 7 toward the MM1 core in the high-mass star-forming region NGC 6334I at 0.1″ – 1″ spatial resolution. A column density of cm-2 at = 200 K is derived toward MM1, 34 times less abundant than methanol (\ceCH3OH), and significantly higher than predicted by astrochemical models. Probable formation and destruction pathways are discussed, primarily through the reaction of the \ceCH3OH photodissociation products, the methoxy (\ceCH3O) and hydroxymethyl (\ceCH2OH) radicals. Finally, we comment on the implications of these mechanisms on gas-phase vs grain-surface routes operative in the region, and the possibility of electron-induced dissociation of \ceCH3OH rather than photodissociation.
1 Introduction
Given its high abundance in the interstellar medium (ISM), the photodissociation of methanol (\ceCH3OH) – producing the methyl (\ceCH3), hydroxymethyl (\ceCH2OH), and methoxy radicals (\ceCH3O) – is one of the most dominant sources of reactive organic species driving interstellar chemical evolution. The branching ratio for these reactions,
| (1) | |||||
| (2) | |||||
| (3) |
is a topic of considerable interest, both in the laboratory and in astrochemical models (Laas et al., 2011). These ratios are difficult to experimentally constrain, however, given that \ceCH2OH and \ceCH3O are indistinguishable by mass spectroscopic techniques, and gas-phase production rates are low enough that direct detection by rotational spectroscopy is challenging (Laas et al., 2013). There is also a question of the relative importance of these branching ratios in gas-phase vs grain-surface chemistry (Laas et al., 2011). The observation of interstellar species which are likely to be products of one or more of these radicals, and insight into its formation in either the gas or solid phase (or both), is highly desirable.
One such highly-desirable target is methoxymethanol (\ceCH3OCH2OH), which is thought to form primarily through either the direct reaction of \ceCH3O with \ceCH2OH in the solid-phase (Garrod et al., 2008):
| (4) |
or via an O(1D) insertion into dimethyl ether (\ceCH3OCH3). Although \ceCH3O has been detected in the ISM Cernicharo et al. (2012), \ceCH2OH has proven elusive, making it difficult to accurately incorporate into chemical models. If \ceCH3OCH2OH does form through Reaction 4, and the rate can be reliably measured in the laboratory, observation of the species in the ISM would therefore provide quantitative insight into the presence of \ceCH2OH, even without its direct detection.
Observation of \ceCH3OCH2OH would therefore provide much-needed constraints on the branching ratios for Reactions 1, 2, and 3, if \ceCH3OCH2OH can be determined to have a grain-surface formation pathway.
Here, we present the first interstellar detection of \ceCH3OCH2OH using ALMA data in Bands 6 and 7 toward NGC 6334I, a massive protocluster (Hunter et al., 2006) currently forming numerous massive stars and harboring two distinct regions of hot core line emission (MM1 and MM2, Brogan et al., 2016; Zernickel et al., 2012) at a distance of 1.3 kpc (Reid et al., 2014). The observations are detailed in §2, and the spectroscopy in §3. In §4 the results are presented and analyzed, and in §5, the formation and destruction chemistry for \ceCH3OCH2OH is explored in the context of the detection.
2 Observations
| Parameter | 249 GHz | 287 GHz | 303 GHz | 344 GHz |
|---|---|---|---|---|
| Observation date(s) | 2017 Aug 18, 19 | 2016 Jul 18, 2016 Aug 02 | 2016 Jan 17 | 2016 Jul 17, 2016 Aug 02 |
| Cycle: configuration(s) | 4: C40-7 | 3: C36-4, C36-5 | 3: C36-2 | 3: C36-4, C36-5 |
| Project code | 2016.1.00383.S | 2015.A.00022.T | 2015.1.00150.S | 2015.A.00022.T |
| Phase Center (J2000 RA, Dec) | 17:20:53.30, 35:47:00.0 | 17:20:53.36, 35:47:00.0 | 17:20:53.35, 35:47:01.5 | 17:20:53.36, 35:47:00.0 |
| Band | Band 6 | Band 7 | Band 7 | Band 7 |
| Time on Source (min) | 37, 37 | 26, 26 | 27 | 27, 27 |
| Number of antennas | 42, 42 | 40, 39 | 40 | 38, 37 |
| FWHP primary beam () | 23 | 20 | 19 | 17 |
| SPW center frequencies (GHz) | 239.69, 241.16, 257.09, 258.29 | 280.1, 282.0, 292.1, 294.0 | 301.20, 302.00, 303.72 | 337.1, 339.0, 349.1, 351.0 |
| Bandwidth per SPW (GHz) | 1.875, 1.875, 0.46875 | |||
| Correlated channel width (MHz) | 0.244, 0.488, 0.244, 0.244 | 0.977 | 0.488 | 0.977 |
| Bandpass calibrator | J1924-2914 | J1924-2914, J1517-2422 | J1924-2914 | J1924-2914 |
| Gain calibrator | J1733-3722 | J1717-3342 | J1717-3342 | J1717-3342 |
| Flux calibrator | J1733-1304, J1617-5848 | J1733-1304 | J1733-1304 | J1733-1304 |
| Angular Resolution ( (P.A.)) | () | () | () | () |
| Spectral Resolution (km s-1) | 0.6 | 1.1 | 1.0 | 1.1 |
| RMS per channel (mJy beam-1 (K))aaThe rms noise per channel varies significantly depending on whether bright emission is present in a particular channel, these estimated noise levels are the average of several channels, and several off-source locations in channels with moderate line emission present. | 1.1 (2.5) | 2.0 (0.62) | 20.0 (0.48) | 3.3 (0.91) |
We present detections of the \ceCH3OCH2OH molecule in four ALMA datasets. The salient observing and imaging parameters are presented in Table 1. The Cycle 3 data (observed in 2016) were calibrated by the ALMA Cycle 4 pipeline (CASA 4.7.2) as described in Hunter et al. (2017), and the Cycle 4 data (observed in 2017) were calibrated by the ALMA Cycle 5 pipeline (CASA 5.1.1). For each dataset, the (relatively) line-free continuum channels were carefully selected and used to construct an initial continuum image model that was then used to iteratively self-calibrate the data. The same channels were also used to subtract the continuum emission in the uv-plane before the spectral cubes were imaged. The data presented here have been corrected for primary beam attenuation.
3 Spectroscopy
The rotational spectra of two conformers of
\ceCH3OCH2OH were recently published by Motiyenko et al. (2017) between 150 and 450 GHz. The detection of the lower energy conformer, Conformer I, is reported here. The dipole moment components determined in that study at the MP2/aug-cc-pVTZ level of theory and basis set were small ( D, D, D). A careful analysis of the relative intensities of A- and C-type lines in the laboratory spectrum, by a subset of the authors, showed that better agreement with corresponding relative intensities in the calculated spectrum was obtained by scaling the value of to 0.11 D. We have therefore adopted this value for this work. The overall RMS deviation of the fit was reported to be 40 kHz, corresponding to 0.04 km s-1 at these frequencies.
4 Results and Analysis
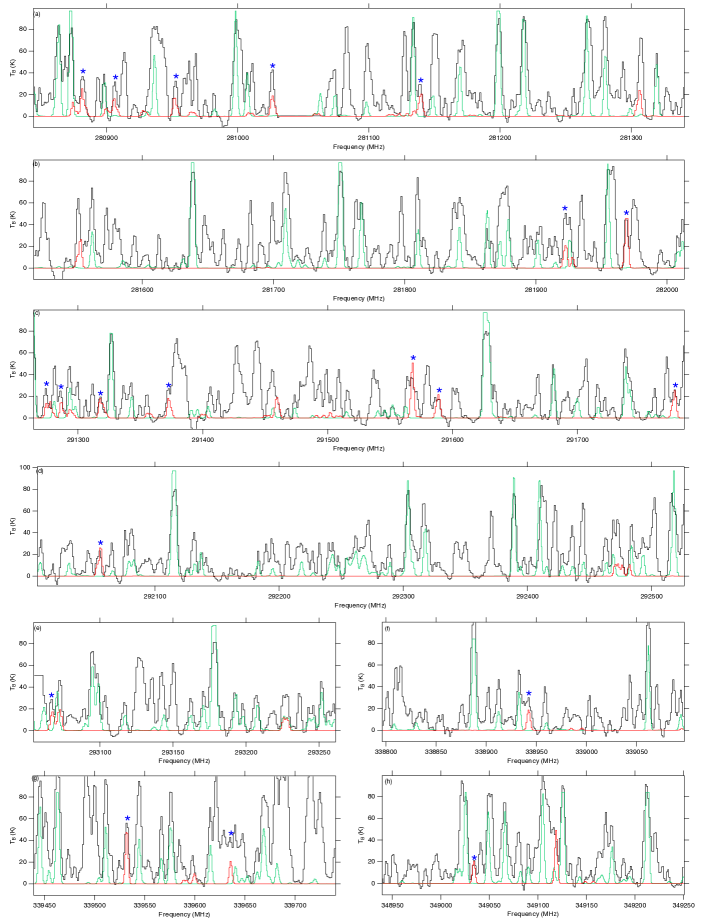
Figure 1 shows the detections of \ceCH3OCH2OH in the 0.2″ Band 7 data (black) toward MM1 convolved to the spectral resolution of the observations, and with a 2.4 km s-1 linewidth (red). The position chosen for analysis (J2000 17:20:53.373, :46:58.14) lies 400 au west of the brightest continuum peak, denoted MM1b by Brogan et al. (2016). The spectra were converted from Jy/beam to K intensity scale in each spectral window using the beam sizes listed in Table 1. Also shown is a total simulation in green of the major contributors to the line density in these portions of the spectrum: methyl cyanide (\ceCH3CN) =0,1, \ceCH3OH =0,1, methyl formate (\ceCH3OCHO) =0,1, ethanol (\ceCH3CH2OH), g′Ga-ethylene glycol (g′Ga-\ce(CH2OH)2), and g′Gg-\ce(CH2OH)2, the latter of which has only recently been detected for the first time in the ISM (Jørgensen et al., 2016). Emission from many of the lines of these species is optically-thick, and a correction was applied using the formalisms of Goldsmith & Langer (1999) and Turner (1991).
This Band 7 data contained the largest number of unblended features, and so was chosen for a preliminary excitation and column density analysis. Given the RMS noise of the observations, the somewhat significant uncertainty introduced by the continuum subtraction due to the lack of line-free channels, and the extremely large spectral dynamic range, only features at least 10 above the RMS, and not substantially blended with another spectral feature, were considered significant enough to be claimed as a detected line.
The underlying substructure of the methyl rotor-split transitions results in challenging, non-Gaussian line profiles which made it difficult to extract physically-meaningful quantitative results from a rotation diagram analysis. Instead, the convolved spectra were simulated using a single-excitation model following the formalism established in Hollis et al. (2004):
| (5) |
where is the column density (cm-2), is the upper state energy (K), is integrated line intensity (K cm s-1), is the excitation temperature (K), is the background continuum temperature (53 K at 287 GHz and 66 K at 344 GHz), the transition frequency (Hz), is the intrinsic line strength, is the transition dipole moment (Debye2)111These units must be properly converted to Joulescm3 to give in cm-2., and is the beam efficiency (assumed to be unity for these interferometric observations). The rotational partition function, , is calculated explicitly by direct summation of states ([300 K] = 81794); the vibrational partition function correction, , was obtained from quantum chemical calculations ([300 K] = 5.33; see Appendix B). We assume that the source fills the beam. The excitation temperature was fixed to 200 K, and the column density was varied to minimize the RMS intensity error for unblended transitions. A few of the strongest lines are marginally affected by optical depth, and a correction was applied using the formalisms of Goldsmith & Langer (1999) and Turner (1991). The final derived value is = 4(2)1018 cm-2 at = 200 K. The 60% uncertainty in the column density is taken as a contribution of 30% resulting from the fit to the unblended transitions, and an estimated 50% from the assumed excitation temperature, added in quadrature.
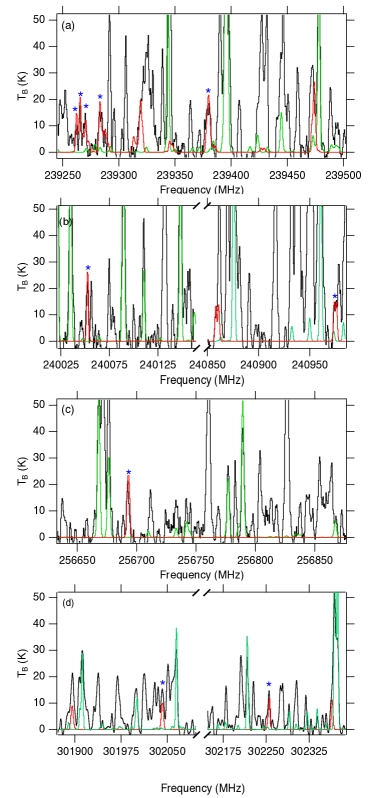
Further unblended transitions were identified in the 0.1″ Band 6 and 1″ Band 7 datasets toward MM1 (Figure 2). The simulated profiles of \ceCH3OCH2OH in the Band 6 data were made using the same values of , , and as the 0.2″ Band 7 data, and with values appropriate for the data (32 K). Because these profiles show remarkably good agreement even at twice the spatial resolution, this is likely indicating that the two observations are probing the same gas, and that the distribution is at least mostly resolved. The 1″ Band 7 data required a column density a factor of two lower, and substantially more optically thin, in agreement with a larger beam which did not resolve the substructure seen in the higher-resolution observations. In total, more than two dozen largely unblended transitions were identified in the datasets for which a distinguishable lineshape contribution was seen in the spectrum matching the predicted shape at the correct frequency. As noted earlier, the intensity match is not always precise, due to the uncertainty in the excitation temperature.
4.1 Spatial Distributions
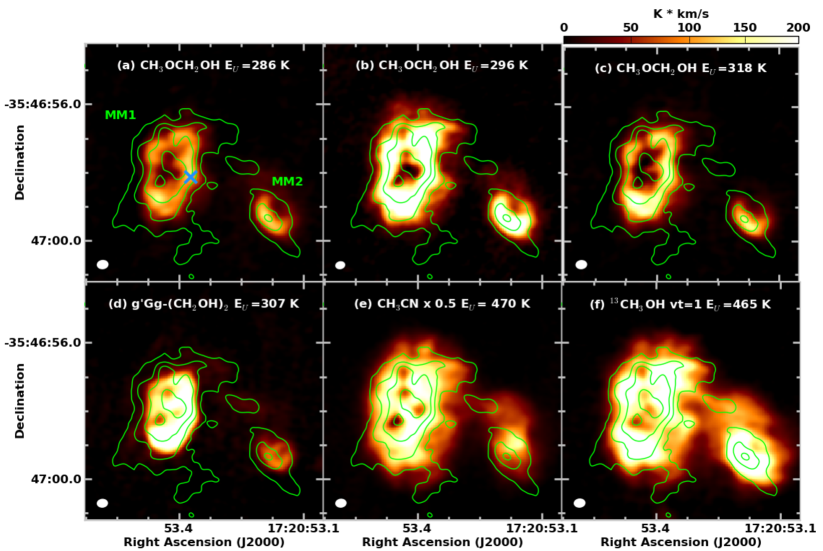
The line density in the region is such that it is challenging to select transitions which are not blended from which spatial distributions can be inferred. Figure 3 shows integrated intensity images of three unblended \ceCH3OCH2OH transitions (panels a-c), as well as images of a single unblended transition each of a′Gg-\ce(CH2OH)2, \ceCH3CN, and \ce^13CH3OH =1. The \ceCH3OCH2OH transitions show nearly identical spatial distributions to each other, as expected, and markedly different distributions from g′Gg-\ce(CH2OH)2, which is significantly more compact, as well as \ceCH3CN which, especially in MM2, shows an anti-correlated distribution. Notably, the distribution of \ceCH3OCH2OH appears to be similar to, but slightly more compact than, that of \ce^13CH3OH =1. The ring-like appearance of the molecular emission toward MM1 is due to the high dust continuum opacity () and brightness temperature of the 1 mm dust continuum emission toward the dust peaks ( K Brogan et al., 2016). Toward the continuum peaks, the high dust opacity attenuates the line emission from the backside of the region, and the high background continuum brightness temperature compared to the line excitation temperature of the transitions shown here (of order 100-200 K) leads to weaker line emission (lower excitation lines are seen in absorption against the continuum peaks). To mitigate these effects, the spectra were extracted and analyzed at a position offset from the continuum peak.
4.2 Chemical Modeling
CH3OCH2OH was included in the three-phase chemical kinetics model MAGICKAL of Garrod (2013). In an initial effort to explore the ability of the model to reproduce the observed abundance, we modified the model with the back-diffusion correction of Willis & Garrod (2017), and used a network based on that of Belloche et al. (2017), in which \ceCH3OCH2OH is produced via Reaction 4. The network also contains likely gas-phase and grain-surface destruction mechanisms for \ceCH3OCH2OH.
The chemical modeling was performed using the two-stage approach described in Garrod (2013). Phase 1 is a cold collapse to a maximum density of 2 x 108 cm-3 and a dust grain temperature of 8 K. This is followed by a warm-up from 8 K to 400 K, simulating the ‘ignition’ of a hot core. Three different warm-up timescales have been used, as the choice of timescale has been previously shown to have significant effects on the chemistry (Garrod, 2013). The fastest timescale reaches a temperature of 200 K at 5 x 10⁴ yr, and 400 K at 7.12 x 10⁴ yr. The slowest timescale reaches these milestones at 106 yr and 1.43 x 10⁶ yr; the intermediate timescale takes 2 x 10⁵ yr and 2.85 x 10⁵ yr.

The results of the model are shown graphically in Figure 4. The fast warm-up timescale produces the highest abundance of \ceCH3OCH2OH, with a maximum fractional abundance of 10-12 with respect to total hydrogen, which is well-maintained to a temperature of 400 K. The abundance of \ceCH3OH in the same model approaches 10-5, corresponding to \ceCH3OCH2OH:\ceCH3OH of 10-7. The observed ratio of \ceCH3OCH2OH:\ceCH3OH is estimated to be 1:34 (see Appendix C). The intermediate timescale shows very similar results, while the slowest timescale produces a very low gas-phase abundance of \ceCH3OCH2OH, peaking at 10-17. This is due to the increased efficiency of grain-surface destruction mechanisms in the slow warm-up timescale.
5 Discussion
Most complex organic molecules (COMs), especially saturated species, are thought to have efficient formation pathways in the solid-phase on the surface of dust grains (Garrod et al., 2008). In star-forming regions like NGC 6334I, the gradual warm-up of these grains can then thermally desorb the product molecules into the gas phase, where they are detected by radio observations (Garrod, 2013). For instance, the successive hydrogenation of CO on grains is likely the major formation route for methanol (Watanabe & Kouchi, 2002; Fuchs et al., 2009). Yet, other studies have shown that some saturated COMs, such as methyl formate and formamide (\ceNH2CHO), might have significant, if perhaps not dominant, gas-phase formation pathways (Neill et al., 2012; Codella et al., 2017). It is worthwhile, then, to consider the potential operative pathways, both in the gas- and solid-phase, for the formation of \ceCH3OCH2OH.
5.1 Radical-Radical Recombination
As noted by Motiyenko et al. (2017), the most obvious astrochemically relevant formation mechanism is the association of the \ceCH3O and \ceCH2OH radicals, which can occur on grains or in the gas. In the gas phase, an association reaction occurs via an intermediate complex, which re-dissociates into reactants unless it can relax sufficiently rapidly. In the low density interstellar medium, the relaxation mechanism is radiative, typically via emission from vibrational levels above the energy of reactants to levels below this energy and therefore stable. For ion-neutral systems such as
| (6) |
experiments in ion traps and other low-density devices have been performed and show a wide range of reaction rate coefficients, depending upon the depth of the complex potential well (which helps to determine the lifetime of the complex against dissociation), the size of the reactants, and the temperature (Gerlich & Horning, 1992). The experiments have also been supplemented by statistical calculations (e.g. Herbst 1985).
Both approaches show that a large complex well depth (a few eV), large reactants (more than 4-5 atoms), and low temperatures (100 K) are needed for the radiative rate coefficient to approach the collisional rate coefficient, and make these reactions feasible. Without these constraints, much smaller rate coefficients are obtained.
For neutral-neutral systems, very few reactions have been studied in the laboratory. Some theoretical rate coefficients have been obtained via statistical theories (Vuitton et al., 2011); these indicate indirectly that the association of the \ceCH3O and \ceCH2OH radicals might have a large rate coefficient at temperatures under 100 K, although it is also likely that the low gas-phase abundances of the reactants would render the process inefficient even with a large rate coefficient. Thus, if the radicals \ceCH3O and \ceCH2OH are more abundant on grains than in the gas for large ranges of temperature, the solid-phase association should be the more important. On the other hand, in their gas-grain modeling of the formation of \ceCH3OCH3 in cold clouds, Balucani et al. (2015) found the dominant process to be the gas-phase radiative association between \ceCH3 and \ceCH3O, assuming that it occurred at the collisional rate.
5.2 O(1D) Insertion Reactions
Another possible formation route involves the insertion of O(1D) into one of the C-H bonds of \ceCH3OCH3 (Hays & Widicus Weaver, 2013). Electronically excited species like O(1D) can form in cosmic ray-irradiated dust-grain ice-mantles, where they quickly react with a neighboring species or are quenched by the solid (Shingledecker et al., 2017; Shingledecker & Herbst, 2017). Indeed, Bergner et al. (2017) recently found evidence that an analogous reaction,
| (7) |
could occur efficiently in interstellar ices. It is possible that such excited species could also react in the gas-phase in the ISM, however, it is perhaps more likely that the excited species will emit a photon and radiatively relax before encountering a collisional reaction partner in the gas phase.
5.3 Photodissociation vs Cosmic Rays
As mentioned in §1, both \ceCH3O and \ceCH2OH can be formed from the dissociation of methanol. In the ISM, the two main drivers of dissociation are photons and cosmic rays. As recently noted by Shingledecker & Herbst (2017), the products of photochemistry and radiation chemistry are often similar, but not necessarily identical, due to differences in the underlying microscopic interactions that drive such processes. The distinction between photochemistry and radiation chemistry is potentially of importance for \ceCH3OCH2OH, and was noted by Boamah et al. (2014) and Sullivan et al. (2016). In the experiments described in those works, \ceCH3OCH2OH was detected after the exposure of condensed methanol to low-energy (20 eV) electrons, which are characteristic of the secondary electrons produced in interstellar ices due to cosmic ray bombardment (Shingledecker et al., 2017). In photodissociation experiments, however, \ceCH3OCH2OH was not detected as a product of UV-irradiated methanol ice, which Sullivan et al. (2016) indicate might make \ceCH3OCH2OH a good tracer of cosmic ray-induced chemistry in the ISM.
5.4 Grain-Surface Hydrogenation
Yet another potential formation pathway is through hydrogenation of precursor species on grain surfaces, such as:
| (8) |
or
| (9) |
Successive hydrogenation reactions have been proposed as the formation mechanism for a number of saturated species, including \ceCH3OH (Woon, 2002) and \ceNH2OH (Fedoseev et al., 2016) among numerous others Linnartz et al. (2015), although recent work has suggested this may not be efficient for substituted aldehydes (Jonusas et al., 2017). A more in-depth analysis of the potential of these types of reactions to both form \ceCH3OCH2OH and suggest other potential products, is warranted.
5.5 Comparison to Models
As discussed in §4.2, current models using only Reaction 4 are significantly under-producing \ceCH3OCH2OH. While the derived abundance of \ceCH3OH in our observations has a high degree of uncertainty, it is clear that the current models do not properly treat \ceCH3OCH2OH formation, destruction, or both. Yet, as shown in Figure 3, the \ceCH3OCH2OH distribution is remarkably similar to that of \ceCH3OH, and different from other COMs. While not definitive, this is highly suggestive of a closely-tied chemistry between these two species that would favor Reaction 4.
6 Conclusions
We have reported the detection of methoxymethanol \ceCH3OCH2OH for the first time in the ISM using ALMA Bands 6 and 7 observations toward the massive Galactic protocluster NGC 6334I. More than two dozen unblended transitions above 10 were identified. These transitions show identical spatial distributions, distinct from other complex species, and well-matched to that of \ceCH3OH, a likely precursor. Current treatments for the grain-surface formation of \ceCH3OCH2OH from \ceCH3O and \ceCH2OH significantly under-produce \ceCH3OCH2OH, likely indicating other unconsidered formation pathways exist. Further, as has recently been suggested, cosmic ray-induced chemistry may play a substantial role, making \ceCH3OCH2OH a potentially powerful tracer of this process.
ADS/JAO.ALMA#2015.1.00150.S, and
ADS/JAO.ALMA#2016.1.00383.S. ALMA is a partnership of ESO (representing its member states), NSF (USA) and NINS (Japan), together with NRC (Canada) and NSC and ASIAA (Taiwan) and KASI (Republic of Korea), in cooperation with the Republic of Chile. The Joint ALMA Observatory is operated by ESO, AUI/NRAO and NAOJ. The National Radio Astronomy Observatory is a facility of the National Science Foundation operated under cooperative agreement by Associated Universities, Inc. E. H. thanks the National Science Foundation for support of his astrochemistry program. A.M.B. is a Grote Reber Fellow, and support for this work was provided by the NSF through the Grote Reber Fellowship Program administered by Associated Universities, Inc./National Radio Astronomy Observatory. Support for B.A.M. was provided by NASA through Hubble Fellowship grant #HST-HF2-51396 awarded by the Space Telescope Science Institute, which is operated by the Association of Universities for Research in Astronomy, Inc., for NASA, under contract NAS5-26555. This work was supported by the Programme National “Physique et Chimie du Milieu Interstellaire” (PCMI) of CNRS/INSU with INC/INP co-funded by CEA and CNES.
References
- Balucani et al. (2015) Balucani, N., Ceccarelli, C., & Taquet, V. 2015, MNRAS, 449, L16
- Belloche et al. (2017) Belloche, A., Meshcheryakov, A. A., Garrod, R. T., et al. 2017, A&A, 601, A49
- Bergner et al. (2017) Bergner, J. B., Öberg, K. I., & Rajappan, M. 2017, ApJ, 845, 29.
- Boamah et al. (2014) Boamah, M. D., Sullivan, K. K., Shulenberger, K. E., et al. 2014, Faraday Discussions, 168, 249.
- Brogan et al. (2016) Brogan, C. L., Hunter, T. R., Cyganowski, C. J., et al. 2016, ApJ, 832, 1
- Cernicharo et al. (2012) Cernicharo, J., Marcelino, N., Roueff, E., et al. 2012, ApJ, 759, L43
- Codella et al. (2017) Codella, C., Ceccarelli, C., Caselli, P., et al. 2017, A&A, 605, L3
- Fedoseev et al. (2016) Fedoseev, G., Chuang, K. J., van Dishoeck, E. F., Ioppolo, S., & Linnartz, H. 2016, MNRAS, 460, 4297
- Frisch et al. (2009) Frisch, M., Trucks, G., Schlegel, H., et al. 2009, Gaussian 09, Revision B.01, Gaussian, Inc., Wallingford CT
- Fuchs et al. (2009) Fuchs, G. W., Cuppen, H. M., Ioppolo, S., et al. 2009, A&A, 505, 629
- Garrod (2013) Garrod, R. T. 2013, ApJ, 765, 60
- Garrod et al. (2008) Garrod, R. T., Weaver, S. L. W., & Herbst, E. 2008, ApJ, 682, 283
- Gerlich & Horning (1992) Gerlich, D., & Horning, S. 1992, Chem Rev, 92, 1509
- Goldsmith & Langer (1999) Goldsmith, P.F. & Langer, W.D. 1999, ApJ, 517, 209.
- Hays & Widicus Weaver (2013) Hays, B. M., & Widicus Weaver, S. L. 2013, JPCA, 117, 7142
- Herbst (1985) Herbst, E. 1985, ApJ, 291, 226
- Hollis et al. (2004) Hollis, J. M., Jewell, P. R., Lovas, F. J., & Remijan, A. 2004, ApJ, 613, L45
- Hunter et al. (2006) Hunter, T. R., Brogan, C. L., Megeath, S. T., et al. 2006, ApJ, 649, 888
- Hunter et al. (2017) Hunter, T. R., Brogan, C. L., MacLeod, G., et al. 2017, ApJL, 837, L29
- Jonusas et al. (2017) Jonusas, M., Guillemin, J.-C., & Krim, L. 2017, MNRAS, 468, 4592.
- Jørgensen et al. (2016) Jørgensen, J. K., van der Wiel, M., Coutens, A., et al. 2016, A&A, 595, A117
- Laas et al. (2011) Laas, J. C., Garrod, R. T., Herbst, E., & Widicus Weaver, S. L. 2011, ApJ, 728, 71
- Laas et al. (2013) Laas, J. C., Hays, B. M., & Widicus Weaver, S. L. 2013, JPCA, 117, 9548
- Linnartz et al. (2015) Linnartz, H., Ioppolo, S., & Fedoseev, G. 2015, International Reviews in Physical Chemistry, 34, 205
- Milam et al. (2005) Milam, S. N., Savage, C., Brewster, M. A., Ziurys, L. M., & Wyckoff, S. 2005, ApJ, 634, 1126
- Motiyenko et al. (2017) Motiyenko, R., Margules, L., Despois, D., & Guillemin, J.-C. 2017, PCCP, in press, doi:10.1039/c7cp05932a.
- Neill et al. (2012) Neill, J. L., Muckle, M. T., Zaleski, D. P., et al. 2012, ApJ, 755, 153
- Reid et al. (2014) Reid, M. J., Menten, K. M., Brunthaler, A., et al. 2014, ApJ, 783, 130
- Shingledecker & Herbst (2017) Shingledecker, C. N., & Herbst, E. 2017, Phys. Chem. Chem. Phys., in press, doi:10.1039/C7CP05901A.
- Shingledecker et al. (2017) Shingledecker, C. N., Le Gal, R., & Herbst, E. 2017, Phys. Chem. Chem. Phys., 19, 11043.
- Sullivan et al. (2016) Sullivan, K. K., Boamah, M. D., Shulenberger, K. E., et al. 2016, MNRAS, 460, 664.
- Turner (1991) Turner, B.E. 1991, ApJS, 76, 617.
- Vuitton et al. (2011) Vuitton, V., Yelle, R. V., Lavvas, P., & Klippenstein, S. J. 2011, ApJ, 744, 11
- Watanabe & Kouchi (2002) Watanabe, N., & Kouchi, A. 2002, ApJ, 571, L173
- Willis & Garrod (2017) Willis, E. R., & Garrod, R. T. 2017, ApJ, 840, 61
- Woon (2002) Woon, D. E. 2002, ApJ, 569, 541
- Zernickel et al. (2012) Zernickel, A., Schilke, P., Schmiedeke, A., et al. 2012, A&A, 546, A87
Appendix A Observed Line Parameters
| Quantum Numbers | Frequency | ||
|---|---|---|---|
| (MHz) | (Debye2) | (K) | |
| \ceCH3OCH2OH | |||
| E | 281024.6590 | 1.05 | 271.81 |
| A | 281026.0480 | 1.05 | 271.81 |
| A | 281026.0480 | 1.05 | 271.81 |
| E | 281027.8190 | 1.05 | 271.81 |
| g′Gg-\ce(CH2OH)2${}^{\dagger}$${}^{\dagger}$footnotemark: | |||
| =1 | 292703.3917 | 199.61 | 307.44 |
| =1 | 292703.3917 | 155.24 | 307.44 |
| \ceCH3CN | |||
| 294.02549 | 274.21 | 469.79 | |
| \ce^13CH3OH =1 | |||
| 282383.0330 | 3.64 | 465 | |
Note. — Only a sample of the \ceCH3OCH2OH transitions is shown here; the full table of all transitions within the range of these observations is available as Supplementary Information.
Appendix B \ceCH3OCH2OH Vibrational Partition Function
The vibrational correction to the partition function for \ceCH3OCH2OH was calculated according to Equation A1:
| (A1) |
To obtain the vibrational energy levels for \ceCH3OCH2OH, a geometry optimization and frequency analysis was performed using Gaussian 09 (Frisch et al., 2009) at the B3LYP/6-311++G(d,p) level of theory and basis set. The five lowest energy levels contribute 0.1% correction to the partition function at 200 K, and have energies of 139, 188, 360, 396, and 584 cm-1. The total correction at 200 K is 2.49.
Appendix C \ceCH3OH Column Density
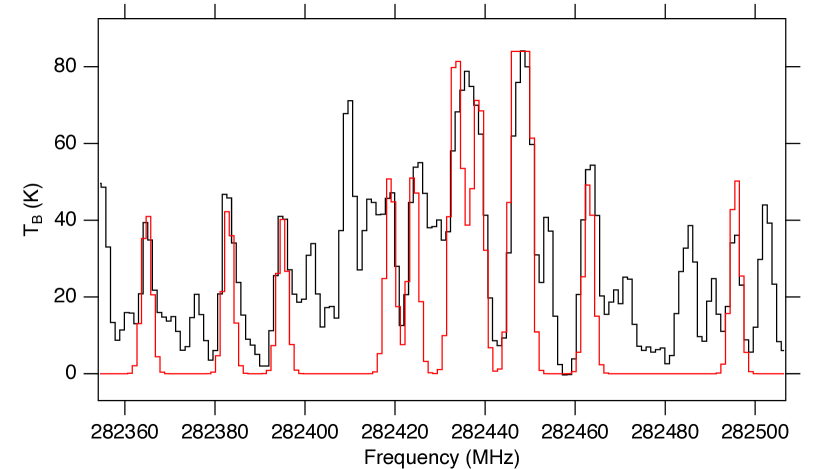
To compare with the column density of \ceCH3OCH2OH, a column density estimate of \ceCH3OH was required. In the 0.2″ Band 7 data, nearly every \ceCH3OH transition is optically thick, as is nearly every transition of \ce^13CH3OH. The lines of \ce^13CH3OH vt=1 are, however, largely optically thin (see Figure A1). We assume that the vt=0 and vt=1 states of \ce^13CH3OH are described by a single excitation temperature, and calculate a total column density of \ce^13CH3OH using the transition at 282383 MHz, which appears to be the least blended optically thin line. A background temperature of = 53 K was used, and an excitation temperature of = 150 K, based on the background temperature and the brightness temperature of the optically thick \ce^13CH3OH lines. The partition function included contributions from both vt=0 and vt=1. A linewidth of 2.8 km s-1 was fit to the lines. The resulting column density was = cm-2. A \ceCH3OH column density of = cm-2 was then inferred by scaling by a \ce^12C/\ce^13C ratio of 68 (Milam et al., 2005). Given the uncertainties involved and assumptions made, this value should be viewed as an estimate and as a lower limit.