Investigate auto-ignition of stoichiometric methane-air mixture
Abstract
Auto-ignition process of stoichiometric mixture of methane-air is investigated using detailed chemical kinetics in a single-zone combustion chamber. Effect of initial temperature on start of combustion (SOC). The Arrhenius expression for the specific reaction rate are calculated and auto-ignition was evaluated based on the species fractions and sensitivity analysis. Our results suggest that the SOC is directly related to initial temperature and the auto-ignition will not occur if the initial temperature low enough.
keywords:
Natural Gas, Detailed Chemical Kinetics1 Introduction
Study of auto-ignition process in premixed air/fuel systems will help us understand the effect of different parameters on SOC. This will be very helpful for identifying and control of SOC in premixed fueled engines like Homogenous Charge Compression Ignition (HCCI) combustion engines [1, 2, 3, 4, 5, 6]. Control of SOC is a very challenging task to commercialize the HCCI combustion engines. [7, 8].
In this study, we examined the effect of initial temperature on SOC and studied the mole fraction behavior of essential radicals for auto-ignition initialization using detailed chemical kinetics.
2 Methodology
To GRI-mech 3.0 chemical kinetic mechanism [9] was used to model detailed chemical kinetics.
Thermodynamic properties are uniform and it is assumed that the gas is an ideal gas. We also assumed that the mass inside the cylinder is homogenous at the beginning of the simulation:
| (1) |
| (2) |
Energy conservation equation is as follows:
| (3) |
The net rate of species production can be calculated using:
| (4) |
Woschni’s correlation [10] is used to simulate convective thermal transport inside the cylinder to transfer heat to cylinder wall.
| (5) |
Thermal transport modeled by a mechanism which is like conduction. So, heat flux of thermal transport will be dependent on the temperature difference of the mixture and the wall which are neighbor and on the distance as follows:
| (6) |
In Eq. 6, the is a conductivity of total flow which is found by Yang and Martin method [11, 12] and is the summation the turbulent and laminar component.
| (7) |
The ratio of turbulent to laminar component is calculated by the following equation:
| (8) |
Eq. 8 presupposes flows. The viscosity ratio can by calculated by:
| (9) |
and
| (10) |
here = 0.44 which is the Von Karman Constant, = 0.08 and is the distance to the wall. The velocity is proportional to engine rpm.
3 Results and Discussion
The effect of initial temperature on auto-ignition time is investigated in Fig 1
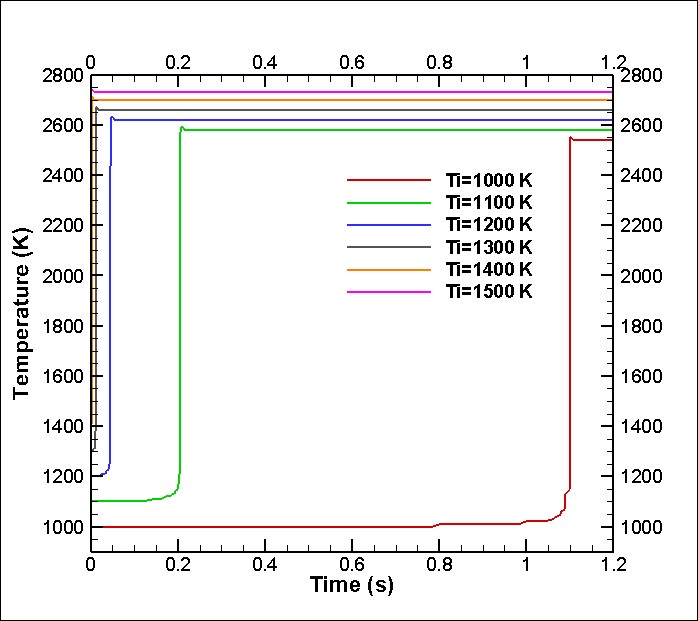
Increasing the initial temperature will increase the rate of essential radials production in the mixture and will help the SOC to happen faster. We can see as the initial temperature increases the SOC happens sooner and as the initial temperature drops below 1200K the auto ignition happens very late.
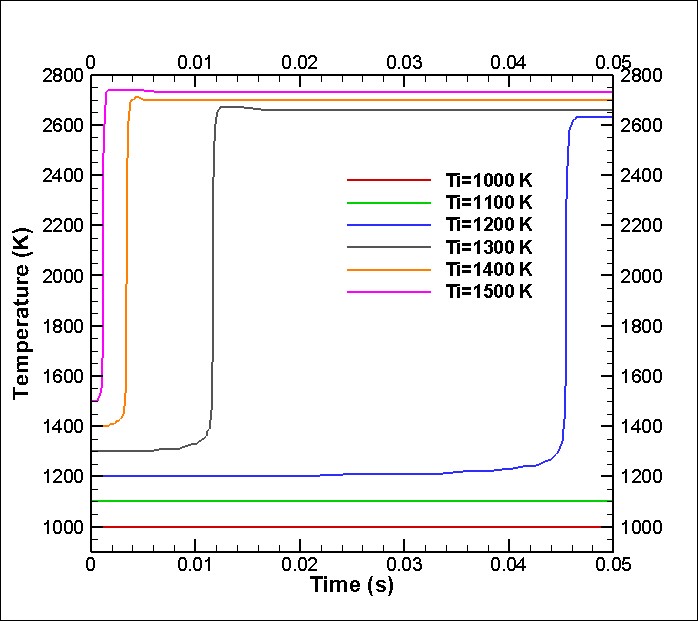
Fig. 2 shows the zoomed graph for the earlier times to see the effect of temperature for higher temperatures in more details.
We have calculated the auto-ignition delay time using this simulations. Considering 300 K delta T for auto-ignition time, the auto-ignition delay times are:
For sensitivity analysis when the mixture temperature has increased by 100 K, 200 K, and 300K, first corresponding time for 1600K, 1700K and 1800K are obtained:
| Ti (K) | 1000 | 1100 | 1200 | 1300 | 1400 | 1500 |
|---|---|---|---|---|---|---|
| AD (s) | 1.1 | 0.2 | 0.05 | 0.012 | 0.004 | 0.001 |
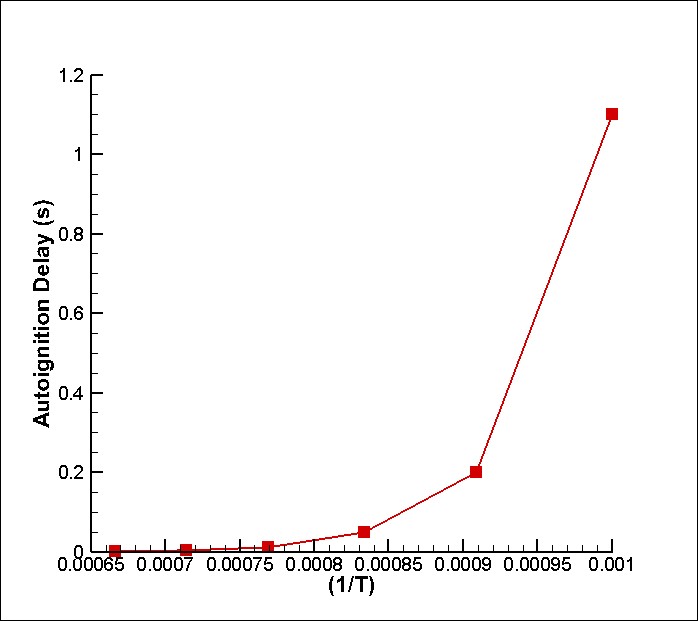
It is evident that with increasing the initial temperature, term reduces and auto-ignition term decreased as well. It is due to exponent term of Arrhenius equation which has negative sign which results to increase of rate of reaction. Therefore, reactions happen faster which results in faster production of radicals and decreasing of auto ignition delay. Fig. 3 demonstrates this auto-ignition delay time.
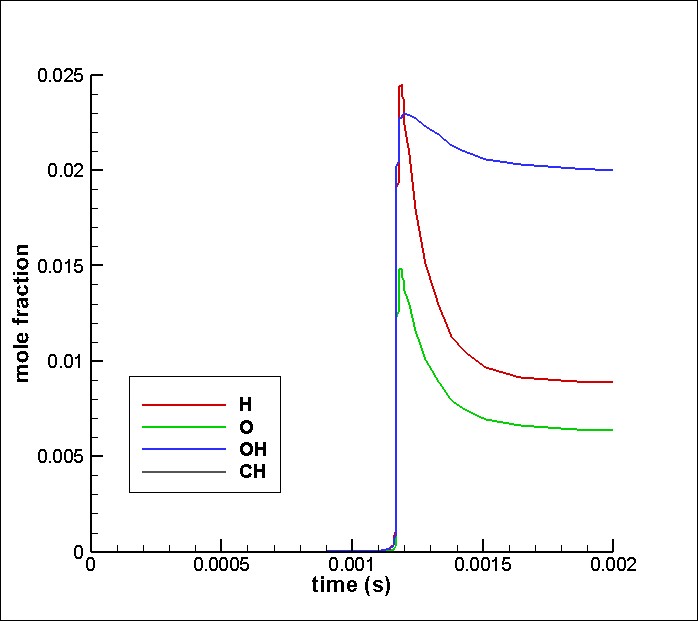
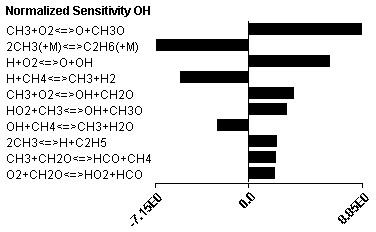
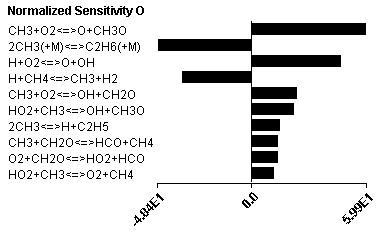
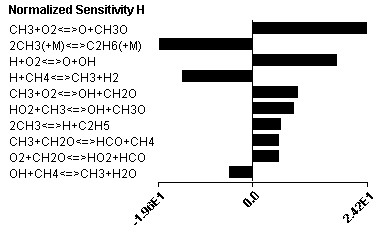
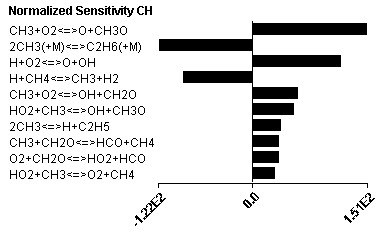
Mole fractions of OH, H, O, and CH radicals are demonstrated in Fig. 4 until auto-ignition for the =1500K case. It is obvious that production of radicals is corresponding to start of combustion. In this regard, CH does not have important effect for auto ignition while O, H and OH have significant effect. Rate of production and consumption of O and H are similar while OH has slightly different behavior.
| Time(s) | T (K) |
|---|---|
| 1.10E-03 | 1.61E+03 |
| 1.10E-03 | 1.61E+03 |
| 1.11E-03 | 1.62E+03 |
| 1.12E-03 | 1.63E+03 |
| 1.12E-03 | 1.65E+03 |
| 1.13E-03 | 1.67E+03 |
| 1.14E-03 | 1.70E+03 |
| 1.15E-03 | 1.73E+03 |
| 1.15E-03 | 1.75E+03 |
| 1.15E-03 | 1.77E+03 |
| 1.16E-03 | 1.80E+03 |
At time 0.001099 s corresponding to 1600 K the results of sensitivity analysis for O, H, CH and OH are as follow:


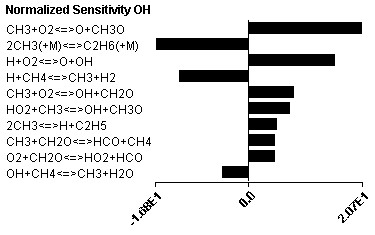
At time 0.00114 s corresponding to 1700 K the results of sensitivity analysis for O, H, CH and OH are as follow:
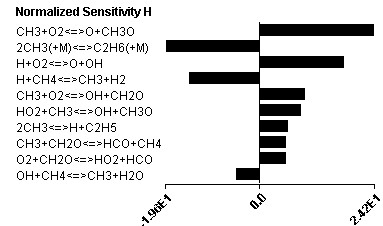
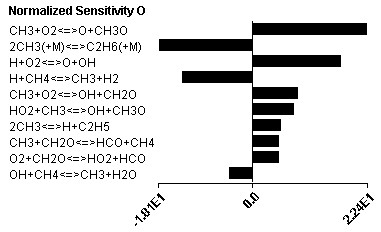

At time 0.00116 s corresponding to 1800 K the results of sensivity analysis for O, H, CH and OH are as follow:

4 Conclusions
The effects of initial temperature on auto-ignition behavior of premixed methane-air fuel is investigated using detailed chemical kinetics method. Increasing temperature from 1000 K to 1500 K reduced the Auto-ignition delay significantly. The highest reduction rate is between 1000K and 1100K and between 1100K and 1200K. The Arrhenius analysis shows that the AD is increases exponentially as the decreases or the () increases. The mole fraction study of the essential radicals of OH, O, H and CH showed that the production rates of O, OH and H are correspondence to the start of combustion and the CH radial production rate has smaller effect on the SOC.
References
References
- [1] A. Y. Nobakht, R. K. Saray, A. Rahimi, A parametric study on natural gas fueled hcci combustion engine using a multi-zone combustion model, Fuel 90 (4) (2011) 1508–1514.
- [2] A. M. Andwari, A. A. Aziz, M. F. M. Said, Z. A. Latiff, Experimental investigation of the influence of internal and external egr on the combustion characteristics of a controlled auto-ignition two-stroke cycle engine, Tech. rep. (2014).
- [3] A. Tahsini, M. Farshchi, Numerical study of solid fuel evaporation and auto-ignition in a dump combustor, Tech. Rep. 7 (2010).
- [4] R. K. Maurya, N. Akhil, Numerical investigation of ethanol fuelled hcci engine using stochastic reactor model. part 2: Parametric study of performance and emissions characteristics using new reduced ethanol oxidation mechanism, Energy Conversion and Management 121 (2016) 55–70.
- [5] A. Y. Nobakht, R. K. Saray, G. S. Astiar, Optimization of gri-mech 3.0 mechanism using hcci combustion models and genetic algorithm, International Journal of Engineering, Transactions A: Basics 24 (2) (2011) 155–168.
- [6] H. Mahabadipour, K. Srinivasan, S. Krishnan, “lost available imep”: A second-law-based performance parameter for ic engines, in: ASME 2016 Internal Combustion Engine Division Fall Technical Conference, American Society of Mechanical Engineers, 2016, pp. V001T03A021–V001T03A021.
- [7] S. Razzaghi, R. Kharrat, S. Vossoughi, D. Rashtchian, Feasibility study of auto ignition in in-situ combustion process, Tech. Rep. 5 (2008).
- [8] H. Mahabadipour, H. Ghaebi, Development and comparison of two expander cycles used in refrigeration system of olefin plant based on exergy analysis, Applied Thermal Engineering 50 (1) (2013) 771–780.
- [9] W. Gardiner, V. Lissianski, Z. Qin, G. Smith, D. Golden, M. FRENKLACH, B. Eiteneer, M. Goldenberg, N. Moriarty, C. Bowman, et al., The gri-mechtm model for natural gas combustion and no formation and removal chemistry, in: 5th Int. Conference on Combustion Technologies for a Clean Environment, 1999.
- [10] J. Chang, O. Güralp, Z. Filipi, D. N. Assanis, T.-W. Kuo, P. Najt, R. Rask, New heat transfer correlation for an hcci engine derived from measurements of instantaneous surface heat flux, Tech. rep., SAE Technical Paper (2004).
- [11] J. Yang, J. Martin, Approximate solution—one-dimensional energy equation for transient, compressible, low mach number turbulent boundary layer flows, Journal of Heat Transfer 111 (3) (1989) 619–624.
- [12] A. Y. Nobakht, H. Mahabadipour, Cfd simulation of tesla-type microvalves.