The APOSTLE simulations: Rotation curves derived from synthetic - observations
Abstract
The apostle cosmological hydrodynamical simulation suite is a collection of twelve regions in diameter, selected to resemble the Local Group of galaxies in terms of kinematics and environment, and re-simulated at high resolution (minimum gas particle mass of ) using the galaxy formation model and calibration developed for the eagle project. I select a sample of dwarf galaxies () from these simulations and construct synthetic spatially- and spectrally-resolved observations of their - emission. Using the 3Dbarolo tilted-ring modelling tool, I extract rotation curves from the synthetic data cubes. In many cases, non-circular motions present in the gas disc hinder the recovery of a rotation curve which accurately traces the underlying mass distribution; a large central deficit of dark matter, relative to the predictions of cold dark matter N-body simulations, may then be erroneously inferred.
keywords:
Galaxies: halos, galaxies: kinematics and dynamics, dark matter1 Introduction
1.1 The APOSTLE simulation suite
The apostle111A Project Of Simulating The Local Environment. simulation suite [Fattahi et al. (2016a), Sawala et al. (2016), (Fattahi et al., 2016a; Sawala et al., 2016)] is a collection of fully cosmological hydrodynamical simulations of regions each approximately in diameter. These are selected from a large cosmological N-body simulation to resemble the Local Group of galaxies in terms of the properties of the two most massive objects, analogous to the Milky Way (MW) and M 31, in terms of their virial masses, approach and tangential velocity, recession velocity of surrounding objects, and isolation from more massive structures. Each region is re-simulated at multiple resolution levels (see Table 1) using the modified P-Gadget3 smoothed-particle hydrodynamics code and calibrated galaxy formation model developed for the eagle project [Schaye et al. (2015), Crain et al. (2015), (specifically, the model is the one denoted ‘Ref’ by Schaye et al., 2015; see also Crain et al., 2015)]. At present, of the simulation volumes have been evolved at L1 resolution; all volumes have been evolved at L2 and L3 resolution.
| Resolution level | DM particle1 mass [] | Gas particle mass [] | Force softening [] |
|---|---|---|---|
| AP-L3 | 711 | ||
| AP-L2 | 307 | ||
| AP-L1 | 134 |
Notes:
1Particle masses vary by up to a factor of from volume to volume; values given are indicative.
The eagle model is calibrated to reproduce the galaxy stellar mass function (GSMF) and galaxy size distribution across the range . The apostle suite demonstrates that the same model, without recalibration, reproduces on average the Local Group GSMF down to [Sawala et al. (2016), (Sawala et al., 2016)], and the size distribution down to [Campbell et al. (2017), (Campbell et al., 2017)]. The apostle MW and M 31 analogs do not suffer from the ‘too-big-to-fail’ problem, defined by [Boylan-Kolchin et al. (2011), Boylan-Kolchin et al. (2011)]: their satellite galaxies occupy dark matter halos consistent with the observed velocity dispersions of dwarf spheroidal galaxies in the Local Group [Sawala et al. (2016), Fattahi et al. (2016b), (Sawala et al., 2016; Fattahi et al., 2016b)].
The simulation suite has been used to assist studies of stellar disc dynamics (Yozin et al. in preparation), the structure of gaseous discs [Benítez-Llambay et al. (2017), (Benítez-Llambay et al., 2017)], the assembly of stellar halos [Starkenburg et al. (2017), Oman et al. (2017b), (Starkenburg et al., 2017; Oman et al., 2017b)], the baryonic Tully-Fisher relation [Oman et al. (2016), Sales et al. (2017), (Oman et al., 2016; Sales et al., 2017)], the properties of low-mass, starless dark matter haloes [Benítez-Llambay et al. (2016), Sawala et al. (2017), (Benítez-Llambay et al., 2016; Sawala et al., 2017)], the tidal stripping of satellite galaxies [Fattahi et al. (2017), Wang et al. (2017), (Fattahi et al., 2017; Wang et al., 2017)], the mass discrepancy – acceleration relation [Ludlow et al. (2017), Navarro et al. (2017), (Ludlow et al., 2017; Navarro et al., 2017)], and the dark matter cusp-core problem [Oman et al. (2015), Oman et al. (2017a), Genina et al. (2017), (Oman et al., 2015; 2017a; Genina et al., 2017)].
1.2 The dark matter cusp-core problem
N-body simulations generically predict that cold dark matter halos have radial density profiles which rise steeply toward the halo centre, with a logarithmic slope of [Navarro et al. (1996a), Navarro et al. (1997), (Navarro et al., 1996a; 1997)], termed a cusp. The density profiles for some galaxies, as inferred from their rotation curves or other dynamical mass estimators, however, imply an approximately constant central dark matter density (slope ) within some ‘core’ region [Moore (1994), Flores & Primack (1994), de Blok (2010), (Moore 1994; Flores & Primack 1994; and see de Blok 2010 for a review)]. The same discrepancy can also be cast as a central deficit of mass, relative to the prediction from N-body simulations, as in [Oman et al. (2015), Oman et al. (2015)]. An important constraint on any proposed solution to this problem is the diversity in the rotation curves of galaxies at fixed maximum rotation velocity , especially those of dwarfs of . Any mechanism proposed to create cores – or the appearance of a core – must do so in some galaxies and not in others, and to different extent in different galaxies.
Currently viable resolutions of the cusp-core problem can be summarized as falling into several categories (or combinations thereof):
-
•
The dark matter distribution, presumed initially cuspy, may be modified by gravitational coupling to violent motions of gas within the galaxy [Navarro et al. (1996b), Read & Gilmore (2005), Pontzen & Governato (2014), (Navarro et al., 1996b; Read & Gilmore, 2005; and for a review see Pontzen & Governato, 2014)].
-
•
If the dark matter physics differs from that of generic cold dark matter, for instance if the dark matter is warm [Bode et al. (2001), Lovell et al. (2012), (Bode et al., 2001; Lovell et al., 2012)] or self-interacting [Spergel & Steinhardt (2000), Creasey et al. (2017), (Spergel & Steinhardt, 2000; Creasey et al., 2017)], the density profile may be modified.
-
•
Systematic effects and errors in the modelling of observed galaxies could cause the appearance of a core in a system hosting a dark matter cusp [Rhee et al. (2004), Valenzuela et al. (2007), Kuzio de Naray & Kaufmann (2011), Read et al. (2016), Pineda et al. (2017), Oman et al. (2017a), (Rhee et al., 2004; Valenzuela et al., 2007; Kuzio de Naray & Kaufmann, 2011; Read et al., 2016; Pineda et al., 2017; Oman et al., 2017a; and references therein)].
2 Method
2.1 Synthetic observations
I select the galaxies from the apostle L1 resolution simulations which lie in the interval . The upper bound ensures that the galaxies are ‘dark matter-dominated’ in the sense that when the gravitational force is decomposed into contributions from dark matter and stars and gas, the component due to the dark matter is dominant, on average, at every radius. The lower bound ensures that corrections to the rotation curve to account for ‘pressure support’ [Valenzuela et al. (2007), Pineda et al. (2017), (for a detailed discussion of such corrections see Valenzuela et al., 2007; Pineda et al., 2017)] are usually small.
The H i distribution in each galaxy is computed from the particle positions, chemical compositions, temperatures and densities following the prescription of [Rahmati2013, Rahmati et al. (2013)] for self-shielding from the metagalactic ionizing background radiation, with a correction for the molecular gas fraction following [BlitzRosolowsky2006, Blitz & Rosolowsky (2006)]. Each galaxy is then ‘observed’ to produce a synthetic data cube, mimicking where possible the characteristics of the little things H i survey [Hunter et al. (2012), (Hunter et al., 2012)]. The galaxies are placed at a nominal distance of and an inclination of . Another angle, , corresponding to an azimuthal rotation of the galaxy, needs to be chosen to specify a unique line of sight – this angle is randomly selected. The H i distribution is mapped onto a grid with a pixel spacing of and convolved with a gaussian beam. In the velocity direction, each particle contributes a gaussian line profile of fixed width, and amplitude proportional to the H i mass of the particle. In each pixel the velocity information is sampled in channels of width.
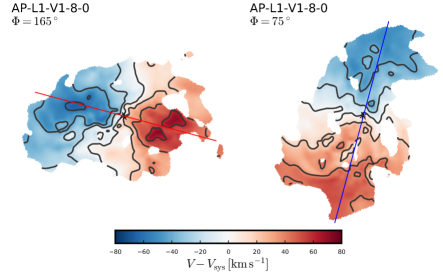
Fig. 1 is a visualization of one of the simulated galaxies, AP-L1-V1-8-0222AP-[resolution level]-[volume number]-[friends-of-friends group number]-[subgroup number]. seen from two viewing angles separated by , at a fixed inclination of . Note that, for illustrative purposes, the viewing angles have been carefully chosen, rather than randomized as described above. The maps show the intensity-weighted mean velocity in each pixel, and the straight lines indicate the kinematic major axis of each projection. Galaxies at this mass scale have substantial azimuthal asymmetries, reflected here as differences between the velocity fields after an azimuthal rotation.
2.2 Rotation curve modelling
Using the 3Dbarolo tilted-ring modelling software [Di Teodoro & Fraternali (2015), (Di Teodoro & Fraternali, 2015)], a rotation curve is extracted from each synthetic data cube. 3Dbarolo does not model the velocity field, but rather constructs a full model data cube whose residual with respect to the observed data cube is minimized via an iterative variation of the parameters of each ‘ring’ in the model. The configuration used is as in [Iorio et al. (2017), Iorio et al. (2017)], except where parameters need to be set on a per-galaxy basis (e.g. centroid, size, inclination, position angle). The centroid is fixed to the peak of the simulated stellar particle distribution as seen along the ‘line of sight’. The inclination and position angles are set to the known values used to construct the synthetic observations, but allowed to vary in the fitting process by up to and , respectively.
The rotation curves are corrected for pressure support as:
| (1) |
where is the rotation curve as recovered by 3Dbarolo, is the corrected rotation curve, is the H i velocity dispersion and is the H i surface density – all these quantities are measured directly from the synthetic data cubes.
3 Results
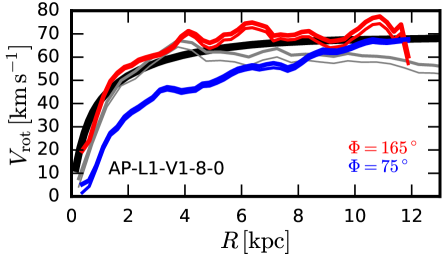
The rotation curves for AP-L1-V1-8-0 corresponding to the two orientations shown in Fig. 1 are shown in Fig. 2 as coloured lines; the thicker lines are the pressure support-corrected versions of the rotation curves shown with thin lines. The gray lines show the rotation speed as a function of radius for the simulated H i gas as measured directly from the simulation output, i.e. without the added handicaps of projection, limited ‘observational resolution’, etc. Finally, the thick black line shows the circular velocity curve for this galaxy, computed as , where is the mass enclosed within radius , and is the gravitational constant. The dark matter is the dominant contributor to at all radii for all simulated galaxies in the sample. In the orientation labelled , the ‘observed’ rotation curve overestimates somewhat the rotation speed of the gas in the galaxy; in the orientation, the rotation curve is severely underestimated.
The leading reason for the difference between the two rotation curves in Fig. 2 is the presence of a non-circular, bisymmetric flow pattern superimposed on the rotation. This imposes a velocity modulation which has two peaks and two troughs along an azimuthal loop around the galaxy. The rotation curve is driven up when gas rotating faster than the average at that radius falls on the major axis of the galaxy in projection, and down when gas rotating more slowly falls there. Such features are common in the simulated sample and lead to a wide diversity of rotation curve shapes, this despite the fact that all retain their dark matter cusp and are dark matter dominated – if their rotation curves faithfully traced their circular velocity curves the shapes would all be self-similar.
Though such bisymmetric flow patterns are easily discerned based on the simulation particle properties, their signature in the synthetic observations is more subtle. In some cases where the rotation curve is severely underestimated, I have been unable to identify any clear indication that anything might be amiss; were these real galaxies, I might erroneously come to the conclusion that they host dark matter cores.
Considering the sample of simulated galaxies as a whole, when each is modelled with a random orientation (at fixed inclination , see Sec. 2.1), the width of the rotation curve shape distribution, parametrized by the rotation speed at and [Oman et al. (2015), (Oman et al., 2015)], is comparable to that seen in real galaxies [Oman et al. (2017a), (Oman et al., 2017a)].
4 Conclusions
The ability of the scenario outlined above to constitute a convincing resolution of the cusp-core problem hinges on the ‘realism’ of the simulated galaxies. The data cubes constructed for the apostle dwarfs compare favourably with those from the things [Walter et al. (2008), (Walter et al., 2008)] and little things [Hunter et al. (2012), (Hunter et al., 2012)] surveys according to several metrics [Oman et al. (2017a), (Oman et al., 2017a)], but there are some differences even at this rudimentary level of comparison: the apostle galaxies have somewhat higher velocity dispersions on average, and perhaps also thicker H i discs. Nevertheless, there is some indication that bisymmetric non-circular flow patterns sufficiently strong to cause substantial changes to their rotation curves may be present in the DDO 47 and DDO 87 galaxies [Oman et al. (2017a), (Oman et al., 2017a)]: the residuals after subtraction of a tilted-ring model from their velocity fields reveal a ‘trefoil’ shape characteristic of a bisymmetric distortion seen in projection. I urge continued strong caution when interpreting the rotation curves of dwarf galaxies, especially in the central regions which are often poorly sampled and in which the potential impact of errors due to non-circular motions is strongest.
References
- [Benítez-Llambay et al. (2016)] Benítez-Llambay, A., Navarro, J. F., Frenk, C. S., Sawala, T., Oman, K. A., Fattahi, A., Schaller, M., Schaye, J., et al. 2016, MNRAS, 465, 3913
- [Benítez-Llambay et al. (2017)] Benítez-Llambay, A., Navarro, J. F., Frenk, C. S., & Ludlow, A. D. 2017, pre-print, arXiv: 1707.08046
- [Boylan-Kolchin et al. (2011)] Boylan-Kolchin, M., Bullock, J. S., & Kaplinghat, M. 2011, MNRAS, 415, 40
- [Bode et al. (2001)] Bode, P., Ostriker, J. P., & Turok, N. 2001, ApJ, 556, 93
- [Campbell et al. (2017)] Campbell, D. J. R., Frenk, C. S., Jenkins, A., Eke, V. R., Navarro, J. F., Sawala, T., Schaller, M., Fattahi, A., et al. 2017, MNRAS, 469, 2335
- [Crain et al. (2015)] Crain, R. A., Schaye, J., Bower, R. G., Furlong, M., Schaller, M., Theuns, T., Dalla Vecchia, C., Frenk, C. S., et al. 2015, MNRAS, 450, 1937
- [Creasey et al. (2017)] Creasey, P., Sameie, O., Sales, L. V., Yu, H.-B., Vogelsberger, M., & Zavala, J. 2017, MNRAS, 468, 2283
- [de Blok (2010)] de Blok, W. J. G. 2010, Advances in Astronomy, 2010, 789293
- [Di Teodoro & Fraternali (2015)] Di Teodoro, E. M., & Fraternali, F. 2015, MNRAS, 451, 3021
- [Fattahi et al. (2016a)] Fattahi, A., Navarro, J. F., Sawala, T., Frenk, C. S., Oman, K. A., Crain, R. A., Furlong, M., Schaller, M., et al. 2016a, MNRAS, 457, 844
- [Fattahi et al. (2016b)] Fattahi, A., Navarro, J. F., Sawala, T., Frenk, C. S., Sales, L. V., Oman, K. A., Schaller, M., & Wang, J. 2016b, pre-print, arXiv: 1607.06479
- [Fattahi et al. (2017)] Fattahi, A., Navarro, J. F., Frenk, C. S., Oman, K. A., Sawala, T., & Schaller, M. 2017, pre-print, arXiv: 1707.03898
- [Flores & Primack (1994)] Flores, R. A., & Primack, J. R. 1994, ApJ, 427, L1
- [Genina et al. (2017)] Genina, A., Benítez-Llambay, A., Frenk, C. S., Cole, S., Fattahi, A., Navarro, J. F., Oman, K. A., Sawala, T., et al. 2017, pre-print, arXiv: 1707.06303
- [Hunter et al. (2012)] Hunter, D. A., Ficut-Vicas, D., Ashley, T., Brinks, E., Cigan, P., Elmegreen, B. G., Heesen, V., Herrmann, K. A., et al. 2012, AJ, 144, 134
- [Iorio et al. (2017)] Iorio, G., Fraternali, F., Nipoti, C., Di Teodoro, E., Read, J. I., & Battaglia, G. 2017, MNRAS, 466, 4159
- [Kuzio de Naray & Kaufmann (2011)] Kuzio de Naray, R., & Kaufmann, T. 2011, MNRAS, 414, 3617
- [Lovell et al. (2012)] Lovell, M. A., Eke, V., Frenk, C. S., Gao, L., Jenkins, A., Theuns, T., Wang, J., & White, S. D. M. 2012, MNRAS, 420, 2318
- [Ludlow et al. (2017)] Ludlow, A. D., Benítez-Llambay, A., Schaller, M., Theuns, T., Frenk, C. S., Bower, R., Schaye, J., Crain, R. A., et al. 2017, Phys. Rev. Lett., 118, 161103
- [Moore (1994)] Moore, B. 1994, Nature, 370, 629
- [Navarro et al. (1996a)] Navarro, J. F., Frenk, C. S., & White, S. D. M. 1996a, ApJ, 462, 563
- [Navarro et al. (1996b)] Navarro, J. F., Eke, V. R., & Frenk, C. S. 1996b, MNRAS, 283, L72
- [Navarro et al. (1997)] Navarro, J. F., Frenk, C. S., & White, S. D. M. 1996a, ApJ, 490, 493
- [Navarro et al. (2017)] Navarro, J. F., Benítez-Llambay, A., Fattahi, A., Frenk, C. S., Ludlow, A. D., Oman, K. A., Schaller, M., & Theuns, T. 2017, MNRAS, 471, 1841
- [Oman et al. (2015)] Oman, K. A., Navarro, J. F., Fattahi, A., Frenk, C. S., Sawala, T., White, S. D. M., Bower, R., Crain, R. A., et al. 2015, MNRAS, 452, 3650
- [Oman et al. (2016)] Oman, K. A., Navarro, J. F., Sales, L. V., Fattahi, A., Frenk, C. S., Sawala, T., Schaller, M., & White, S. D. M. 2016, MNRAS, 460, 3610
- [Oman et al. (2017a)] Oman, K. A., Marasco, A., Navarro, J. F., Frenk, C. S., Schaye, J., & Benítez-Llambay, A. 2017a, pre-print, arXiv: 1706.07478
- [Oman et al. (2017b)] Oman, K. A., Starkenburg, E., & Navarro, J. F. 2017b, in: Forbes, D. A. & Lopez, E. D. (eds.), On the origin (and evolution) of baryonic galaxy halos, Galaxies, 5, 33
- [Pineda et al. (2017)] Pineda, J. C. B., Hayward, C. C., Springel, V., Mendes de Oliveira, C. 2017, MNRAS, 466, 63
- [Pontzen & Governato (2014)] Pontzen, A., & Governato, F. 2014, Nature, 506, 171
- [Read & Gilmore (2005)] Read, J. I., & Gilmore, G. 2005, MNRAS, 356, 107
- [Read et al. (2016)] Read, J. I., Iorio, G., Agertz, O., & Fraternali, F. 2016, MNRAS, 462, 3628
- [Rhee et al. (2004)] Rhee, G., Valenzuela, O., Klypin, A., Holtzman, J., & Moorthy, B. 2004, ApJ, 617, 1059
- [Sales et al. (2017)] Sales, L. V., Navarro, J. F., Oman, K. A., Fattahi, A., Ferrero, I., Abadi, M., Bower, R., Crain, R. A., et al. 2017, MNRAS, 464, 2419
- [Sawala et al. (2016)] Sawala, T., Frenk, C. S., Fattahi, A., Navarro, J. F., Bower, R. G., Crain, R. A., Dalla Vecchia, C., Furlong, M., et al. 2016, MNRAS, 457, 1931
- [Sawala et al. (2017)] Sawala, T., Pihajoki, P., Johansson, P. H., Frenk, C. S., Navarro, J. F., Oman, K. A., & White, S. D. M. 2017, MNRAS, 467, 4383
- [Schaye et al. (2015)] Schaye, J., Crain, R. A., Bower, R. G., Furlong, M., Schaller, M., Theuns, T., Dalla Vecchia, C., Frenk, C. S., et al. 2015, MNRAS, 446, 521
- [Spergel & Steinhardt (2000)] Spergel, D. N., & Steinhardt, P. J. 2000, Phys. Rev. Lett., 84, 3760
- [Starkenburg et al. (2017)] Starkenburg, E., Oman, K. A., Navarro, J. F., Crain, R. A., Fattahi, A., Frenk, C. S., Sawala, T., & Schaye, J. 2017, MNRAS, 465, 2212
- [Valenzuela et al. (2007)] Valenzuela, O., Rhee, G., Klypin, A., Governato, F., Stinson, G., Quinn, T., & Wadsley, J. 2007, ApJ, 657, 773
- [Walter et al. (2008)] Walter, F., Brinks, E., de Blok, W. J. G., Bigiel, F., Kennicutt, R. C., Jr, Thornley, M. D., Leroy, A. 2008, AJ, 136, 2563
- [Wang et al. (2017)] Wang, M.-Y., Fattahi, A., Cooper, A. P., Sawala, T., Strigari, L. E., Frenk, C. S., Navarro, J. F., Oman, K. A., et al. 2017, MNRAS, 468, 4887