Design principles for selective self-assembly of active networks
Simon L. Freedman,a Glen M. Hocky,b Shiladitya Banerjee,c and Aaron R. Dinnerb
Living cells dynamically modulate the local morphologies of their actin cytoskeletons to perform biological functions, including force transduction, intracellular transport, and cell division.
A major challenge is to understand how diverse structures of the actin cytoskeleton are assembled from a limited set of molecular building blocks.
Here we study the spontaneous self-assembly of a minimal model of cytoskeletal materials, consisting of semiflexible actin filaments, crosslinkers, and molecular motors.
Using coarse-grained simulations, we demonstrate that by changing concentrations and kinetics of crosslinkers and motors we can generate three distinct structural phases of actomyosin assemblies: bundled, polarity-sorted, and contracted.
We introduce new metrics to distinguish these structural phases and demonstrate their functional roles.
We find that the binding kinetics of motors and crosslinkers can be tuned to optimize contractile force generation, motor transport, and mechanical response.
By quantitatively characterizing the relationships between modes of cytoskeletal self-assembly, the resulting structures, and their functional consequences, our work suggests new principles for the design of active materials.
1 Introduction
Mechanical functions of living cells are determined by dynamic restructuring of the actin cytoskeleton, a highly conserved cellular machinery composed of filamentous actin (F-actin), myosin molecular motors, and crosslinking proteins 1. An enormous variety of F-actin binding proteins with diverse physico-chemical properties 2 can combine with F-actin to assemble function-specific cellular structures. Spatiotemporal control over these structures is essential for coordinated force generation during cell migration 3, 4, cell adhesion 5, cytokinesis 6, and intracellular transport 7, 8. A quantitative understanding of how diverse cytoskeletal structures are assembled from a limited set of molecular building blocks presents an outstanding challenge at the interface of soft matter physics and cell biology.
Given the many interconnected processes within cells, it is experimentally difficult to controllably study how variations in molecular-scale properties affect emergent actin network structures and function. This issue can be overcome by studying in vitro reconstitutions, which have revealed how biochemical compositions and relative amounts of actin filaments and molecular motors determine network architectures and mechanical properties 9, 10, 11, 12, 13, 14, 15, 16, 17. Such studies have shown that the types and concentrations of crosslinkers can be used to tune the length scale 12, 17 and shape 17 of microscopic contractile deformations, as well as bulk mechanical responses of actin networks 18, 19, 20, 21, 22, 23 and motor transport on them 24.
Simulations complement experiments by allowing both precise control of the physical properties of constituents and examination of microscopic mechanisms. The foci of existing simulations have mirrored the experiments described above.
- •
- •
- •
The simulation studies above provide insight into specific aspects of cytoskeletal networks (contractility, mechanical response, and transport) for assembled networks. They do not consider dramatic structural rearrangements in response to internal and external forces, and it is difficult to compare the functional consequences of specific structures between studies. Indeed, while the structural phase diagram of filaments with passive crosslinkers has been mapped and shown to exhibit homogeneous isotropic gel, bundled, clustered, and lamellar phases 31, to the best of our knowledge, a corresponding study of active materials has not been performed previously. It remains to determine the structures accessible to mixtures of filaments, crosslinkers, and motors, the conditions under which they are formed, and the interplay of network structure and function.
In this paper, we map the non-equilibrium structural phases of networks consisting of F-actin, crosslinkers, and motors. We observe homogeneous, bundled, contracted, and polarity-sorted networks within a single unified model, and characterize the parameters that control their assembly. In doing so, we introduce order parameters that can classify the extent to which networks contract into dense aggregates, sort F-actin by polarity, or bundle filaments for force propagation. Using these metrics, we demonstrate how networks can be tuned for specific mechanical functionalities, by systematic variations in network composition. New insights offered by our work include that varying kinetic properties of actin binding proteins and filament length effect network structure non-monotonically, implying optimal values for these parameters, and how different network structures set time scales of motor transport.
2 Results & Discussion
2.1 Coarse-grained model
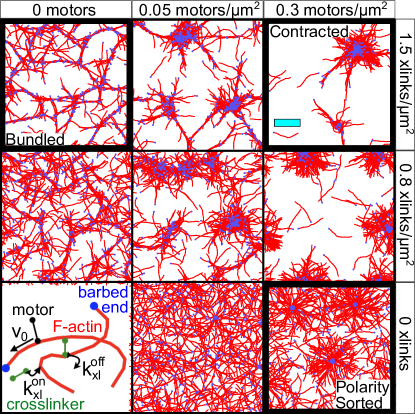
To study the spontaneous self-assembly of cytoskeletal structures at experimentally relevant length and time scales (microns and minutes), we use AFINES, a simulation framework we recently developed 20. In brief, actin filaments are modeled as polar worm-like chains (represented by beads connected by springs) with defined barbed and pointed ends (Figure 1); crosslinkers are modeled as linear springs with ends (heads) that can stochastically bind and unbind from F-actin via a kinetic Monte Carlo procedure that preserves detailed balance; molecular motors are modeled as active crosslinkers such that once bound, they walk toward the barbed ends of filaments at a load-dependent speed. We use Brownian dynamics to evolve the positions of constituents in 2D. While other similar simulation frameworks exist 32, 33, the unique implementation of detailed balance preservation in AFINES allows one to differentiate between passive systems without motors that assemble thermally, and active systems that break detailed balance, e.g. using motors which hydrolyze ATP to promote unidirectional motion. Restriction to 2D is consistent with the fact that in vitro reconstitutions of actomyosin networks are nearly flat 21, 12, 17. To enable rearrangement in 2D, we neglect excluded volume, which is reasonable since the F-actin density in our simulations is well below the isotropic to nematic transition, so network connectivity dominates the dynamics. The model is described in detail in Section S1, and Table S1 lists all simulation parameters.
2.2 Self-assembly and characterization of actin network structures
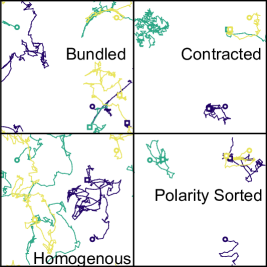
We observe three distinct network architectures formed from initially disordered mixtures of F-actin, motors, and crosslinkers: bundled, polarity-sorted, and contracted. Examples are shown for simulations of 500 10 m long filaments in Figure 1. When F-actin is mixed with crosslinkers, thick bundles form and intersect to yield a well-connected mesh. When F-actin is mixed with motors, barbed ends aggregate to form a polarity-sorted network. Combining F-actin with both motors and crosslinkers results in macroscopic contraction of the filaments into dense and disconnected aggregates.
To systematically explore how varying the properties of the network constituents affects structure formation, we introduce physical order parameters that characterize each of the observed structural phases. We compute the spatial extent of F-actin aggregation using the radial distribution function,
| (1) |
where is the probability that two actin beads are separated by a distance in the range (here, ), and is the number density of actin beads. For a homogeneous network, at all distances (Figure 2A; the small peaks at integer arise from the spacing of beads within actin filaments). In contrast, for contracted networks, for , indicating F-actin exceeds the bulk density.
While Figure 2A shows that actin filaments are nearly uniformly distributed in a polarity-sorted network, Figure 1 indicates that their barbed ends are concentrated. To quantify their aggregation specifically, we compute the ratio , where is the distance between barbed ends. Figure 2B shows that in polarity-sorted networks F-actin barbed ends aggregate (and have a secondary peak at , the rest length of motors). In contracted networks, barbed ends also aggregate to a higher degree than in bundled networks, indicating a degree of polarity sorting.
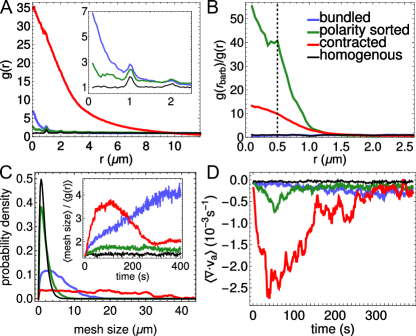
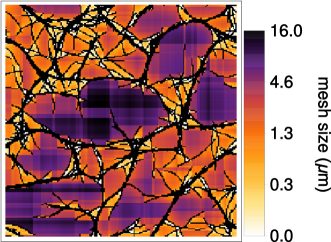
Figure 2A indicates that bundled networks aggregate at smaller length scales, , corresponding to the crosslinker rest length . To quantify the degree of bundling, and to distinguish it from contractility, we measure the distribution of network pore sizes by a procedure that is similar in spirit but simpler than that in Ref. 34. Namely, we grid the simulation box into bins and compute how many filaments pass through each. For each empty bin, we determine the lengths of the contiguous vertical and horizontal stretches of empty bins that intersect it (Figure 3). We average these lengths over all empty bins to obtain an average mesh size for each structure. This procedure can be used for analysis of experimental images, in addition to the simulation structures in the present study.
In Figure 2C, the distributions of mesh sizes for polarity-sorted and homogeneous networks are similar, indicating that the former does not coarsen significantly. The bundled and contracted networks exhibit larger pore sizes; indeed, contracted networks exhibit pore sizes spanning the simulation region, indicating that the network has ripped apart. We can distinguish these cases by normalizing the mesh size by , (here, is the approximate size of a contracted aggregate under our maximally contractile conditions, as shown in Figure 2A; see Fig. S2 for further details) which quantifies the extent of aggregation. The inset shows that, while the contracted networks initially bundle, at long times this effect is small compared to aggregation. In contrast, bundled networks have a continuously increasing normalized mesh size (Figure 2C, inset); we thus have a metric for the degree of bundling.
To examine the relationship between actin network structure and contractility, we use the divergence of actin’s velocity field, , where indicates spatial averaging (Section S2) 20. As shown in Figure 2D, becomes significantly more negative for aggregating networks than for bundling or polarity-sorted networks. Comparison with Figure 2A shows that extensive contractility is associated with large .
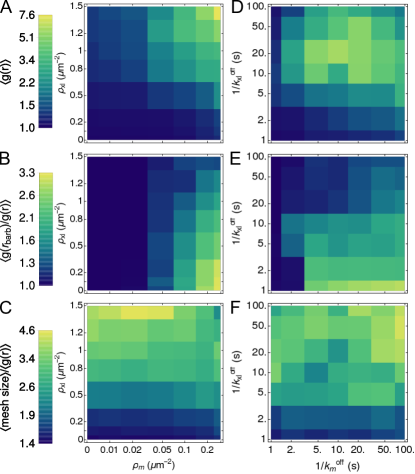
Using these order parameters, we map the structural phase space of actomyosin networks as functions of motor and crosslinker densities and their binding affinities (Figure 4). Consistent with Figure 1, networks are contracted when motor and crosslinker densities are high (Figure 4A), polarity-sorted when only motor density is high (Figure 4B), and bundled when crosslinker density is high (Figure 4C). Interestingly, while high motor densities inhibit bundling, a small population of motors () enhances filament bundling.
2.3 Non-monotonic trends in binding kinetics and filament length
Finally, we modulate molecular-level interaction parameters between F-actin and its binding partners (crosslinkers, motors) to dissect their relative roles in building different structures. These parameters are hard to change independently in experiment. At fixed motor and crosslinker densities, we find that cytoskeletal structures can be tuned by varying the dissociation constants, (Figure 4D-F). The trends are non-monotonic, in contrast to those in Figure 4A-C. In particular, contraction is highest for intermediate values of (Figure 4D), and bundling is highest for low values of with low or high (Figure 4F). Notably, this non-monotonic trend only arises for a fixed simulation time, . For a fixed value of , changing modulates structure formation in a monotonic manner, akin to changing (dashed lines in Figure 5). The non-monotonic trends are important, however, for understanding how structures form in the presence of competing kinetic processes, such as actin filament turnover 7, 35.
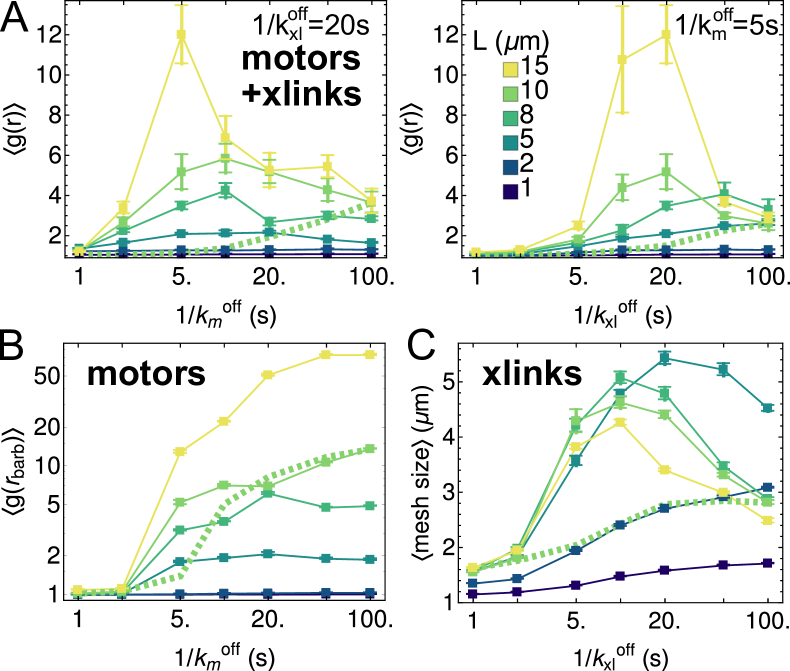
As the length () of F-actin varies considerably within cells 36, we tested how modulating and in tandem affects structure formation. In Figure 5A, we show that increasing favors aggregation by increasing network connectivity; short filaments () do not organize. As in Figure 4E, the dependence of aggregation on binding affinity is non-monotonic whenever there is significant aggregation (i.e., ). In Figure 5B, we show that for networks with only motors, at low , increasing filament length promotes polarity sorting. By contrast, at high , short lifetimes of motor attachment suppress polarity sorting. As evident from the representative network structures in Fig. S5, shortening the filaments also suppresses polarity sorting. Both the large number of filaments and their rapid diffusion favor mixing over sorting.
For networks with only crosslinkers, the mesh size (Figure 5C) is non-monotonic with respect to both filament length and crosslinker affinity. Low crosslinker affinity and short filament lengths prevent forming stably crosslinked networks (Fig. S6), again due to mixing. Conversely, assemblies with high crosslinker affinity or long filament lengths form crosslinked networks, but they rearrange slowly, so further coarsening is impeded, and the mesh size remains small. As these non-monotonic trends only occur for m, they are more likely to impact structures with longer actin filaments found in budding yeast 37, stereocilia 38, filopodia, or in vitro reconstituted networks 22, 17. Structures with shorter filaments, as found in lamellipodia or the actin cortex ( m) 39, 16, are less likely to have a finite binding affinity that maximizes contractility.
2.4 Network structure tunes transport and force propagation
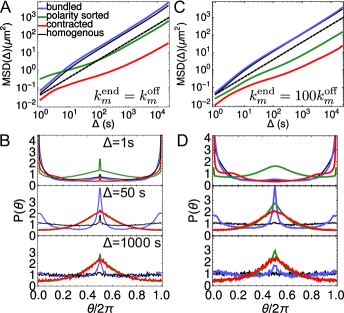
While the structures of contracted, polarity-sorted, and bundled networks clearly differ, their consequences for biophysical functions are not immediately apparent. To determine how these structures influence motor transport 40, 10, we fix the actin structures and follow the dynamics of the motors (Figure 6). This facilitates obtaining well-converged statistics for the dynamics and interpretation in terms of individual trajectories. In Figure 7A, we plot their mean-squared displacement,
| (2) |
where is the length of the trajectory and is the displacement of a motor with center of mass position at time after a lag of . While the scaling of the mean-squared displacement is consistent with simple diffusion (Figure 7A), sample trajectories (Figure 6) indicate that motors in contracted and polarity-sorted structures spend significant amounts of time trapped in aggregates of barbed ends.
We quantify caging using a previously defined metric that can distinguish different kinds of motion 41: we compute the distribution of angles, , between consecutive displacement vectors and , at different values of . We performed this measurement with the motors described above (Section 2.1), as well as ones that detach faster from the barbed ends of filaments; i.e., at the barbed end they had a detachment rate of 20. This second set of measurements was done to ascertain that the observed motor dynamics were a consequence of network structure, and not a consequence of dwelling at the barbed ends of the filaments, given that we assume a uniform detachment rate.
We find that for all structures, there is at least one time scale in which the distribution has a broad peak at (Figure 7B), indicating that motors are reversing direction, consistent with confinement 41. Motors with exhibit an additional spike in their distribution at due to barbed ends acting as local attractors, between which motors move back and forth. However, this spike is suppressed by increasing motor end detachment rate, and does not impact the diffusive or caging behavior (Figure 7C-D). For polarity-sorted networks barbed ends are most tightly aggregated, and thus motors exhibit caging at all time scales measured. Contracted networks are partially polarity-sorted, so filaments can direct motors both in and out of aggregates, making the caging more spatially extended. Because it takes longer to explore the extended length scale, the caging manifests only at s. Bundled networks show caging effects most prominently at intermediate time scales. In this case, the caging corresponds to motors cycling between oppositely oriented filaments, which can give rise to apparently glassy dynamics 30. Consistent with our results, it was recently shown that actin networks with different structures result in different angle distributions 24. However, the caging manifested in the experiments at shorter times ( s), and certain networks supported simultaneous stable peaks at and (see also 41). A key feature of the experiments that is not represented in the present model is that the myosin minifilaments in the experiments have many heads 41, 30, 24, and this was previously shown to be important in producing those observed glassy dynamics 30.
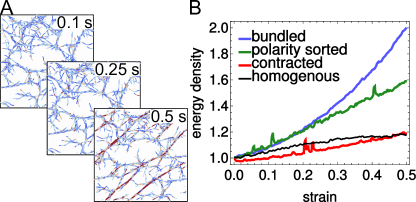
Next, we evaluated how structural rearrangements in actin networks affect their ability to propagate mechanical forces over long length scales. To this end, we subjected the final network configuration to a shear strain of magnitude (Figure 8A, algorithm described in Section S3) and measured the resulting strain energy. In Figure 8B, we show the strain dependence of the total strain energy density, , where , , and are the potential energies of the F-actin, motors, and crosslinkers, respectively, (Section S1) and is the simulation volume, assuming a thickness of . Bundled networks exhibit a quadratic dependence on strain, indicating a solid-like material response. By contrast, contracted and polarity-sorted networks are fragile, with linear dependences of energy density on strain.
3 Conclusions
We have shown how modulating the abundance and properties of cytoskeletal constituents can tune emergent network structures. For finite times, we find that motor and crosslinker binding affinities, as well as filament lengths, have optimal values for maximizing contractility, bundling, and polarity sorting. While there are still many unanswered questions on the self-organized behavior of cytoskeletal materials, our work takes an important step forward by linking kinetics to the selection of network structures with specific mechanical functions. We expect that the order parameters that we introduced can also be applied to interpretation of experimental images. Further simulations using our modeling framework can shed light on the structures accessible to mixtures with multiple types of crosslinkers, filaments, and motors, as well as structure-function relations in other active polymer assemblies, including networks of microtubules, kinesin, and dynein 42, 43. From the perspective of materials design, our work demonstrates how a limited set of molecular building blocks can self-assemble diverse active materials. This presents the prospect that theory and simulation can be used to guide the design of active biomimetic materials with desired collective mechanical properties.
4 Conflicts of Interest
There are no conflicts of interest to declare.
5 Acknowledgments
We thank M. Gardel, J. Weare, S. Stam, and K. Weirich for helpful conversations and anonymous reviewers for insightful comments and suggestions on the manuscript. This research was supported in part by the University of Chicago Materials Research Science and Engineering Center (NSF Grant No. 1420709). S.L.F. was supported by the DoD through the NDSEG Program. G.M.H. was supported by an NIH Ruth L. Kirschstein NRSA award (1F32GM113415-01). S.B. was supported by a UCL Strategic Fellowship. Simulations resources were provided by the Research Computing Center at the University of Chicago and National Institutes of Health (NIH) Grant No. 5 R01 GM109455-02.
References
- Murrell et al. 2015 M. Murrell, P. W. Oakes, M. Lenz and M. L. Gardel, Nat. Rev. Mol. Cell Biol., 2015, 16, 486.
- Michelot and Drubin 2011 A. Michelot and D. G. Drubin, Curr. Biol., 2011, 21, R560–R569.
- Pollard and Borisy 2003 T. D. Pollard and G. G. Borisy, Cell, 2003, 112, 453–465.
- Lomakin et al. 2015 A. J. Lomakin, K.-C. Lee, S. J. Han, D. A. Bui, M. Davidson, A. Mogilner and G. Danuser, Nat. Cell Biol., 2015, 17, 1435.
- Parsons et al. 2010 J. T. Parsons, A. R. Horwitz and M. A. Schwartz, Nat. Rev. Mol. Cell Biol., 2010, 11, 633–643.
- Sedzinski et al. 2011 J. Sedzinski, M. Biro, A. Oswald, J.-Y. Tinevez, G. Salbreux and E. Paluch, Nature, 2011, 476, 462.
- Munro et al. 2004 E. Munro, J. Nance and J. R. Priess, Dev. Cell, 2004, 7, 413–424.
- Tabei et al. 2013 S. M. A. Tabei, S. Burov, H. Y. Kim, A. Kuznetsov, T. Huynh, J. Jureller, L. H. Philipson, A. R. Dinner and N. F. Scherer, Proc. Natl. Acad. Sci. U.S.A, 2013, 110, 4911–4916.
- Bendix et al. 2008 P. M. Bendix, G. H. Koenderink, D. Cuvelier, Z. Dogic, B. N. Koeleman, W. M. Brieher, C. M. Field, L. Mahadevan and D. A. Weitz, Biophys. J., 2008, 94, 3126–3136.
- Kohler et al. 2011 S. Kohler, V. Schaller, A. Bausch et al., Nat. Mater., 2011, 10, 462–468.
- Alvarado et al. 2013 J. Alvarado, M. Sheinman, A. Sharma, F. C. MacKintosh and G. H. Koenderink, Nat Phys, 2013, 9, 591–597.
- Murrell and Gardel 2012 M. P. Murrell and M. L. Gardel, Proc. Natl. Acad. Sci. USA, 2012, 109, 20820–20825.
- Murrell and Gardel 2014 M. Murrell and M. L. Gardel, Mol. Biol. Cell, 2014, 25, 1845–1853.
- Ennomani et al. 2016 H. Ennomani, G. Letort, C. Guérin, J.-L. Martiel, W. Cao, F. Nédélec, M. Enrique, M. Théry and L. Blanchoin, Curr. Biol., 2016, 26, 616–626.
- Linsmeier et al. 2016 I. Linsmeier, S. Banerjee, P. W. Oakes, W. Jung, T. Kim and M. Murrell, Nat. Commun., 2016, 7, 12615.
- Chugh et al. 2017 P. Chugh, A. G. Clark, M. B. Smith, D. A. Cassani, K. Dierkes, A. Ragab, P. P. Roux, G. Charras, G. Salbreux and E. K. Paluch, Nat. Cell Biol., 2017, 19, 689–697.
- Stam et al. 2017 S. Stam, S. L. Freedman, S. Banerjee, K. L. Weirich, A. R. Dinner and M. L. Gardel, Proc. Natl. Acad. Sci. U.S.A, 2017, 114, E10037–10045.
- Gardel et al. 2004 M. Gardel, J. Shin, F. MacKintosh, L. Mahadevan, P. Matsudaira and D. Weitz, Science, 2004, 304, 1301–1305.
- Kasza et al. 2009 K. E. Kasza, G. H. Koenderink, Y. C. Lin, C. P. Broedersz, W. Messner, F. Nakamura, T. P. Stossel, F. C. MacKintosh and D. A. Weitz, Phys. Rev. E, 2009, 79, 041928.
- Freedman et al. 2017 S. L. Freedman, S. Banerjee, G. M. Hocky and A. R. Dinner, Biophys. J, 2017, 113, 448–460.
- Schmoller et al. 2009 K. Schmoller, O. Lieleg and A. Bausch, Biophys. J., 2009, 97, 83–89.
- Weirich et al. 2017 K. L. Weirich, S. Banerjee, K. Dasbiswas, T. A. Witten, S. Vaikuntanathan and M. L. Gardel, Proc. Natl. Acad. Sci. U.S.A, 2017, 114, 2131–2136.
- Lieleg et al. 2009 O. Lieleg, R. M. Baumgärtel and A. R. Bausch, Biophys. J., 2009, 97, 1569–1577.
- Scholz et al. 2018 M. Scholz, K. L. Weirich, M. L. Gardel and A. R. Dinner, bioRxiv, 2018, 277947.
- Dasanayake et al. 2011 N. L. Dasanayake, P. J. Michalski and A. E. Carlsson, Phys. Rev. Lett., 2011, 107, 118101.
- Belmonte et al. 2017 J. M. Belmonte, M. Leptin and F. Nédélec, Molecular Syst. Biol., 2017, 13, 941.
- Head et al. 2003 D. A. Head, A. J. Levine and F. C. MacKintosh, Phys. Rev. E, 2003, 68, 061907.
- Kim et al. 2009 T. Kim, W. Hwang, H. Lee and R. D. Kamm, PLoS Comput. Biol., 2009, 5, e1000439.
- Head et al. 2011 D. A. Head, G. Gompper and W. J. Briels, Soft Matter, 2011, 7, 3116–3126.
- Scholz et al. 2016 M. Scholz, S. Burov, K. L. Weirich, B. J. Scholz, S. M. A. Tabei, M. L. Gardel and A. R. Dinner, Phys. Rev. X, 2016, 6, 011037.
- Cyron et al. 2013 C. Cyron, K. Müller, K. Schmoller, A. Bausch, W. Wall and R. Bruinsma, Europhys. Lett., 2013, 102, 38003.
- Nedelec and Foethke 2007 F. Nedelec and D. Foethke, New J. Phys., 2007, 9, 427.
- Popov et al. 2016 K. Popov, J. Komianos and G. A. Papoian, PLoS Comput. Biol., 2016, 12, e1004877.
- Mickel et al. 2008 W. Mickel, S. Münster, L. M. Jawerth, D. A. Vader, D. A. Weitz, A. P. Sheppard, K. Mecke, B. Fabry and G. E. Schröder-Turk, Biophys. J., 2008, 95, 6072–6080.
- Fritzsche et al. 2016 M. Fritzsche, C. Erlenkämper, E. Moeendarbary, G. Charras and K. Kruse, Sci. Adv., 2016, 2, e1501337.
- Mohapatra et al. 2016 L. Mohapatra, B. L. Goode, P. Jelenkovic, R. Phillips and J. Kondev, Annu. Rev. Biophys., 2016, 45, 85–116.
- Chesarone-Cataldo et al. 2011 M. Chesarone-Cataldo, C. Guérin, H. Y. Jerry, R. Wedlich-Soldner, L. Blanchoin and B. L. Goode, Dev. Cell, 2011, 21, 217–230.
- Lin et al. 2005 H. W. Lin, M. E. Schneider and B. Kachar, Curr. Opin. Cell Biol., 2005, 17, 55–61.
- Salbreux et al. 2012 G. Salbreux, G. Charras and E. Paluch, Trends Cell Biol., 2012, 22, 536–545.
- Brawley and Rock 2009 C. M. Brawley and R. S. Rock, Proc. Natl. Acad. Sci. U.S.A, 2009, 106, 9685–9690.
- Burov et al. 2013 S. Burov, S. M. A. Tabei, T. Huynh, M. P. Murrell, L. H. Philipson, S. A. Rice, M. L. Gardel, N. F. Scherer and A. R. Dinner, Proc. Natl. Acad. Sci. USA, 2013, 110, 19689–19694.
- Sanchez et al. 2012 T. Sanchez, D. T. Chen, S. J. DeCamp, M. Heymann and Z. Dogic, Nature, 2012, 491, 431.
- Foster et al. 2015 P. J. Foster, S. Fürthauer, M. J. Shelley and D. J. Needleman, eLife, 2015, 4, e10837.
See pages - of actin_structs_supp.pdf